GDXJ上昇がGDXを打ち負かす by Zeal 中半
Excluding them and a fast-growing mid-tier gold miner that was oddly removed from GDXJ over the past year, the rest of the top 34 GDXJ gold miners achieved strong 3.4% YoY production growth in Q3! All the growth in the gold-mining industry is now coming from the mid-tier miners. GDXJ not only holds the best mid-tiers, but they have much-higher weightings than in the major-dominated GDX. GDXJ is the place to be.
これらを除外し、昨年GDXJから奇妙なことに除外されてしまった急成長する中規模金鉱銘柄なしでも、残りGDXJ上位34銘柄はQ3にYoYで3.4%の力強い生産量成長を果たした!いまや金鉱産業の生産増は中規模鉱山が担っている。GDXJは最良中規模銘柄を組み込んでいるだけでなく、GDXよりもその組み込み率が高い。GDXJこそ投資先に適している。
In addition to the mid-tier gold miners’ growing production and lower market capitalizations, their mining costs are in line with the majors. In Q3 the top 34 GDX gold miners averaged all-in sustaining costs of $877 per ounce. The difference between that and prevailing gold prices shows industry profitability. The top 34 GDXJ gold miners had similar $911 AISCs in Q3. Without those South African majors, it was $877 too.
中規模金鉱会社の生産量増加と時価総額が小さいことに加え、これらの鉱山の産金コストは大手に劣らない。Q3においてGDX上位34銘柄の平均AISCは$877/オンスだった。この値とゴールド市況価格の差が産業の利益となる。GDXJ上位34銘柄のAISCはQ3に同様の$911だった。南アフリカ大手を除くと、この指標は$877となる。
中規模金鉱会社の生産量増加と時価総額が小さいことに加え、これらの鉱山の産金コストは大手に劣らない。Q3においてGDX上位34銘柄の平均AISCは$877/オンスだった。この値とゴールド市況価格の差が産業の利益となる。GDXJ上位34銘柄のAISCはQ3に同様の$911だった。南アフリカ大手を除くと、この指標は$877となる。
So if you can get past the fact GDXJ certainly isn’t a “Junior Gold Miners” ETF, it is superior to GDX in every way. The top 34 GDX stocks averaged 288.8k ounces mined in Q3, while GDXJ’s top 34 came in 43% lower at 163.3k. That’s still far above the 75k conservative junior threshold, but this mid-tier gold-miner range is where the vast majority of world production growth is happening. GDXJ action reflects this.
というわけで、みなさんがGDXJが「小型金鉱株」ETFでないことを理解すれば、GDXよりも遥かに優れている。GDX上位34銘柄の産金量はQ3において平均288.8Kオンスだ、一方GDXJ上位34銘柄は163.3Kオンスであり43%少ない。ただし控えめに見た小型金鉱株のしきい値75Kよりは遥かに大きい、しかしこの中規模金鉱株で圧倒的な産金量増加が起きつつある。GDXJの値動きはこれを反映している。
というわけで、みなさんがGDXJが「小型金鉱株」ETFでないことを理解すれば、GDXよりも遥かに優れている。GDX上位34銘柄の産金量はQ3において平均288.8Kオンスだ、一方GDXJ上位34銘柄は163.3Kオンスであり43%少ない。ただし控えめに見た小型金鉱株のしきい値75Kよりは遥かに大きい、しかしこの中規模金鉱株で圧倒的な産金量増加が起きつつある。GDXJの値動きはこれを反映している。
I’ve been writing about GDXJ outperforming GDX in my quarterly-results essays and newsletters for the better part of several years now. But until this week I hadn’t done the work to formally quantify GDXJ’s superior upside. I’ve been curious about it for some time, and have received more questions on it with gold stocks powering higher again. So I dug into this gold-stock bull’s GDXJ and GDX performances so far.
ここ数年、GDXJがGDXを凌ぐことを私は四半期決算分析やその他の記事で書いてきた。しかし今週まで、私はおおっぴら定量的にGDXJの優勢を主張することはなかった。この件は私がずっと奇妙に思ってきたことであり、金鉱株が上昇しつつあるなかでこの件に関する質問をたくさん受けるようになってきた。というわけで私は今回の金鉱株ブル相場でのGDXJとGDXのパフォーマンスの違いを詳しく調べた。
ここ数年、GDXJがGDXを凌ぐことを私は四半期決算分析やその他の記事で書いてきた。しかし今週まで、私はおおっぴら定量的にGDXJの優勢を主張することはなかった。この件は私がずっと奇妙に思ってきたことであり、金鉱株が上昇しつつあるなかでこの件に関する質問をたくさん受けるようになってきた。というわけで私は今回の金鉱株ブル相場でのGDXJとGDXのパフォーマンスの違いを詳しく調べた。
Since gold miners’ stocks are exceedingly volatile, bulls and bears in them are often delineated instead by gold itself. Today’s gold bull was born in December 2015 before surging in a powerful upleg in the first half of 2016. While gold has suffered a couple of serious corrections since, it never crossed that -20% new-bear threshold. So with gold in a continuous bull market for 3.1 years now, so too are the gold stocks.
金鉱株は変動が極端に大きいため、ゴールドとの関連無くブル・ベア相場が起きることがある。現在のゴールドブル相場は2015年12月に始まった、2016年前半の急上昇前のことだ。それ以降でゴールドは深刻な調整を二度受けたが、まだベア相場とみなされるしきい値−20%は超えていない。というわけでゴールドはいまのところまだ3.1年ブル相場がつづいている、金鉱株も同様だ。
金鉱株は変動が極端に大きいため、ゴールドとの関連無くブル・ベア相場が起きることがある。現在のゴールドブル相場は2015年12月に始まった、2016年前半の急上昇前のことだ。それ以降でゴールドは深刻な調整を二度受けたが、まだベア相場とみなされるしきい値−20%は超えていない。というわけでゴールドはいまのところまだ3.1年ブル相場がつづいている、金鉱株も同様だ。
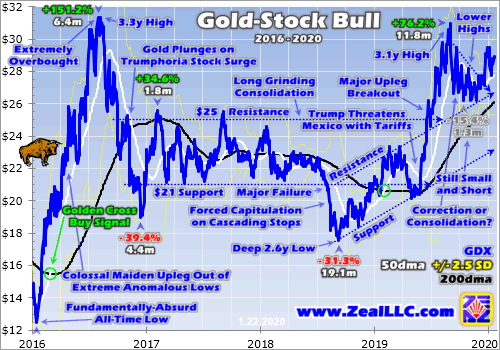
They are effectively leveraged plays on gold since gold-mining profits directly amplify underlying moves in gold. The major gold stocks of GDX generally leverage gold uplegs and corrections by 2x to 3x. So if gold rallies 10%, GDX usually climbs 20% to 30%. Since GDX has become the leading benchmark for this entire sector, GDXJ’s performance is best considered relative to GDX’s. This chart summarizes it all.
金鉱株の利益はその背景のゴールド価格をレバレッジするものだ。大手金鉱銘柄を対象とするGDXは上昇下降時のレバレッジ率が2xから3xだ。というわけでゴールドが10%ラリーするとGDXは通常20%から30%上昇する。GDXはこのセクターのベンチマークとなっており、GDXJはGDXよりも良いパフォーマンスを示すと思われている。このチャートがこの状況を示す。
金鉱株の利益はその背景のゴールド価格をレバレッジするものだ。大手金鉱銘柄を対象とするGDXは上昇下降時のレバレッジ率が2xから3xだ。というわけでゴールドが10%ラリーするとGDXは通常20%から30%上昇する。GDXはこのセクターのベンチマークとなっており、GDXJはGDXよりも良いパフォーマンスを示すと思われている。このチャートがこの状況を示す。
GDX and GDXJ were both hammered to fundamentally-absurd all-time lows back in mid-January 2016 soon after gold’s own 6.1-year secular low. Ever since gold stocks have meandered in a series of bull-market uplegs and corrections. The performances of GDXJ and GDX in these recent years are rendered in blue and red below. Key stats are shown for each major gold ETF’s uplegs and corrections during that span.
GDXとGDXJは共に、2016年1月半ばにファンダメンタルズからすると馬鹿げたレベルの安値に叩かれた、ゴールド自身が6.1年ぶりの安値になった直後のことだ。それ以来金鉱株は一連の上昇と下落を繰り返した。近年のGDXJとGDXを比べている、青と赤だ。
GDXとGDXJは共に、2016年1月半ばにファンダメンタルズからすると馬鹿げたレベルの安値に叩かれた、ゴールド自身が6.1年ぶりの安値になった直後のことだ。それ以来金鉱株は一連の上昇と下落を繰り返した。近年のGDXJとGDXを比べている、青と赤だ。
The vertical light-blue lines divide up GDXJ’s uplegs and corrections, which generally match GDX’s but sometimes see major lows or highs out of sync. Each GDXJ upleg or correction shows GDXJ’s total gain or loss, the time that move took in months, GDX’s corresponding move over that identical span, and GDXJ’s leverage to GDX in yellow. The actual full GDX uplegs and corrections are also shown below in red.
水色の先はGDXJの上昇下落を示す、多くの場合GDXと同期しているが、天井や底が同期していないときもある。GDXJの上昇や調整の期間は数ヶ月だ、GDXも同様、GDXJの対GDXレバレッジを黄色文字で示している。GDX自体の上昇や調整は赤字で書かれている。
水色の先はGDXJの上昇下落を示す、多くの場合GDXと同期しているが、天井や底が同期していないときもある。GDXJの上昇や調整の期間は数ヶ月だ、GDXも同様、GDXJの対GDXレバレッジを黄色文字で示している。GDX自体の上昇や調整は赤字で書かれている。
Even in today’s young, delayed, mostly-unpopular, and weak gold-stock bull, GDXJ has outperformed GDX by a wide margin. And that’s despite GDXJ morphing from being a true junior-gold-miner ETF in the first half of 2016 to a mid-tier gold-miner ETF over the subsequent year. Even holding bigger gold miners, their superior fundamentals to the struggling majors have enabled GDXJ to keep the performance crown.
ゴールドブル相場はまだ若く、遅れており、それほど一般的ではなく金鉱株ブル相場は弱いものだが、GDXJはGDXを大きく上回っている。GDXJが2016年前半に本当の小型金鉱株から中規模金鉱株に変身してもだ。より大きな規模の金鉱株を組み込んで入るが、苦しむ大手に比べてGDXJのファンダメンタルズは遥かに優れている。
ゴールドブル相場はまだ若く、遅れており、それほど一般的ではなく金鉱株ブル相場は弱いものだが、GDXJはGDXを大きく上回っている。GDXJが2016年前半に本当の小型金鉱株から中規模金鉱株に変身してもだ。より大きな規模の金鉱株を組み込んで入るが、苦しむ大手に比べてGDXJのファンダメンタルズは遥かに優れている。
In just 6.4 months in largely the first half of 2016, gold stocks as measured by GDX skyrocketed 151.2% higher on a 29.9% gold upleg. GDXJ well-outperformed GDX in roughly that same span, blasting 202.5% higher in 7.0 months! GDX actually rallied 146.6% within GDXJ’s exact upleg, showing the mid-tier gold-stock ETF leveraged the major gold-stock ETF’s massive upleg by a solid 1.38x. GDXJ’s upside bested GDX’s.
2016年前半の6.4か月で、GDXは151.2%上昇した、そのときゴールドの上昇は29.9%だった。GDXJは同じ期間にGDXを大きく上回っており、7.0か月で202.5%上昇した!GDXJ上昇の同じ期間にGDXの実際のラリーは146.6%であり、レバレッジ率は1.38xもある。GDXJの上昇はGDXを上回るものだ。


