中国の(ありえない)金融安定報告書
中国人民銀行の毎年何百ページに及ぶ報告書を何年分も追いかけ分析し、それを無料でブログ開示するのが、管理人にとっては驚きです。
On December 28th, 2018, the People’s Bank of China, published the English version of their epic Financial Stability Report. It is 246 pages.
2018年12月28日に中国人民銀行は英語版の金融安定報告書FSRを開示した、246ページにもなる。
The reports, when dug thru makes little mathematical sense, but it keeps the Chinese Party supplied with wonderful numbers , and its authors out of jail
この報告書は、深く分析するとその数字はほとんど意味がない、中国共産党が提供する素晴らしい数値に溢れている、そして著者たちは刑務所に収容されることもない。
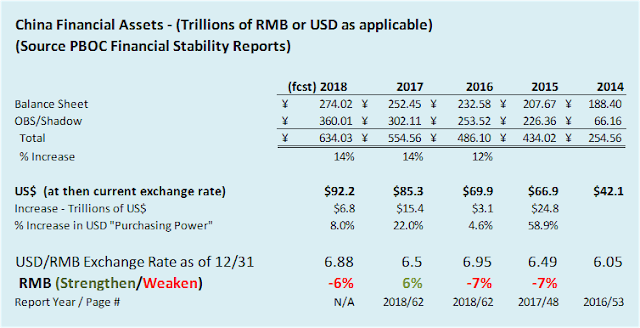
The chart below has been compiled primarily from figures from the just released sister report, the 2018 Financial Responsibility Report (page 62)
下の表は最近開示された2018金融安定化報告書(ページ62)から抽出したものだ。

- In four years the Chinese Government has created 380 Trillion Renminbi or US$ 50.1 Trillion in Financial Assets out of thin air. The dollar value of these Financial Assets increased 22% in 2017 and its forecast growth of 8% for 2018.
この4年で中国政府は人民元380Tを与信創造した、米ドルでは$50.1Tにもなる金融資産を無から生み出した。ドルベースでは2017年に22%増えており、2018には8%増えるとみられる。 - The 2015 & 2016 figures include the newly discovered (aka Restated) Off-Balance Sheet Assets disclosed in the 2017 Report (For YE 2016)
2015&2016の数値は新たに発見された(言い換えられた)Off-Balance Sheet資産であり、2017報告書で開示された(2016年末開示) - During this incredible run, Non-Performing loan ratios somehow improved, this must be due to Chinese bankers and their reputation as tough, relentless underwriters: “Downward pressure on assets quality alleviated. By end-2017, the total outstanding NPLs of banking institutions recorded RMB 2.39 trillion, an increase of RMB 195.7 billion y-o-y. The NPL ratio dropped by 0.06 percentage point y-o-y to 1.85 percent.” – page 60
この信じられないほどの素晴らしい期間に、不良債権割合は改善された、これは中国の銀行家と引き受けての努力による:「資産の質の劣化が緩まった。2017年末時点で、銀行系の不良債権総額はRMB - In the 2017 FSR (2016 YE Data) the PBOC appeared to be extremely concerned about the OBS Asset growth: “In 2017, the foundation for a resilient economy and a sound financial market is still not firm, the downside pressure on real economy cannot be overlooked, and great attention should be attached to the challenges and risks confronted by the banking sector. The banking sector will remain committed to the mandate of contributing to the real economic growth, attach more importance to risk prevention, improve risk management and hold on to the bottom line of preventing systemic risks from happening” – page 48. How they can manage the risk, while supporting Financial Asset growth at an annual rate of 14% is like an ever expanding universe, we cannot comprehend
2017FSR(2016年末データ)でPBOCは簿外資産OBSの増加に極端な懸念を示している:「2017年には、弾力性のある経済や財政の健全性の基盤が盤石ではなかった、実経済の下落圧力は見逃されるべきではない、そして銀行セクターのリスクに大きな懸念がある。銀行セクターは実経済成長に責任がある、リスク回避努力だ、リスク管理を改善しシステムリスクが現実のものにならないようにする努力。」ーーpage 48。彼らが如何にリスク管理をしているかというと、金融資産を年率14%増やしているわけで空前絶後前代未聞だ、もう理解不能だ。 - By extrapolation and applying the demonstrated 2017 Financial Asset growth rate (quantifying the PBOC’s commitment to financial austerity and tight money) to 2018 we can calculate/forecast that Chinese Financial Assets (as of the report’s release date) now amount to roughly 634 Trillion Renminbi/$92.2 Trillion or probably about 1/4th of all financial assets on the planet at current exchange rates
2017年の金融資産成長を2018に外挿すると(PBOCの金融規律を定量化すると)、現在の中国金融資産はRMB634T/$92.2Tになる、これは全世界の金融資産の1/4にもなる。 - During the same time period the RMB has weakened by only 13%, 6:05 v 6:88
この同じ期間にRMBの減価はわずか13%だった、6:05 vs 6:88。 - No economy has ever created financial assets, in equivalent reserve currency, at this pace or level
かつてここまで金融資産を創造した経済は存在しない、それは準備通貨も同様だ、このレベルと増加ペースに関して。
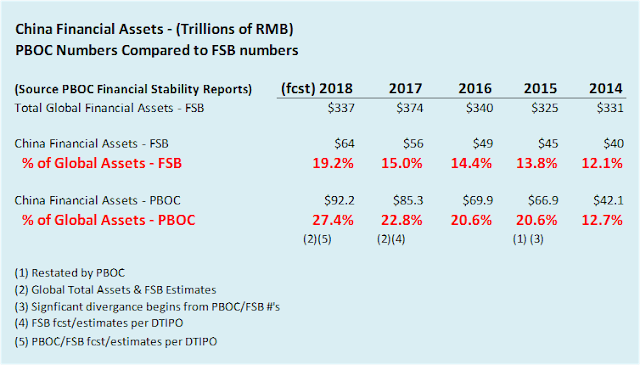
Given the above, perhaps impossible asset growth, let’s compare the above People’s Bank Of China figures to those previously provided to the Financial Stability Board (see explainer in note 1) for the Global Shadow Banking Monitoring Report (see note 2) The FSB Figures (2014, 2015 & 2016) are taken from the 2017 Data Set. 2017 Data should be available in the March 2019 Report (2018 Data Set)
このようなことを勘案すると、多分これ以上の資産成長はもう無理だ、上で議論したPBOCのデータとこれまでに開示されたGlobal Shadow Banking Monitoring Reportに関するFSBデータを比べてみよう。FSBのデータ(2014,2015そして2016)は2017のデータから読み取れる。2017のデータは2019年3月の報告書で明らかになるはずだ(2018データセット)
このようなことを勘案すると、多分これ以上の資産成長はもう無理だ、上で議論したPBOCのデータとこれまでに開示されたGlobal Shadow Banking Monitoring Reportに関するFSBデータを比べてみよう。FSBのデータ(2014,2015そして2016)は2017のデータから読み取れる。2017のデータは2019年3月の報告書で明らかになるはずだ(2018データセット)

When reviewing the figures you should observe the disparity between the PBOC Financial Stability Report and those provided to the Financial Stability Board (Since the numbers are all being reported by the PBOC, one would think they should be the same).
開示されているデータには乖離がある、PBOC Financial Stability ReportとFinancial Stability Boardの間でだ(数値はどちらもPBOCが報告したもので、だれもが本来は同じであるべきだと思うものだ)。
開示されているデータには乖離がある、PBOC Financial Stability ReportとFinancial Stability Boardの間でだ(数値はどちらもPBOCが報告したもので、だれもが本来は同じであるべきだと思うものだ)。
Here are those bullet points
その要点はこういう具合だ
その要点はこういう具合だ
- Figures reported in 2014 were about the same (give or take a trillion or two. $40.0 trillion vs. $42.1 trillion. But what’s that between friends) At that time Chinese Financial Assets were roughly 12% of Global Financial Assets as reported by the FSB. Moving forward to 2016, the disparity grew to 20.6%vs. 14.4%. The “newly discovered” Off Balance Sheet Assets
2014年のデータはどちらもほとんど同じだった(2T程度の差だった。$40.0T vs. $42.1T。でもそう大差はない)。当時中国金融資産は世界金融資産の12%程度だった、FSBデータによる。2016年になると、その差が顕著になる、20.6% vs. 14.4%だ。簿外資産/シャドーバンキングが「新たに発見」された。 - Fast forward to 2018, extrapolating the trend and accounting for an estimated decline in Total Global Asset Values over the last month we can forecast, based on 2017 growth rates that Chinese, Mainland RMB Assets (aka, the onshore Yuan) are now roughly 27% of all Global Assets
これが2018を推測すると、全世界金融資産をトレンドから推測すると下落傾向で、一方2017成長速度から推測すると中国の本土RMB資産(onshore Yuanとして知られる)は世界全資産の27%を占めると思われる。 - In the 2017 Financial Stability Report (2016 YE Data) the People’s Bank Of China attempts to explain the remarkable S20.9 trillion disparity between their own financial asset figures, and those reported to the Financial Stability Board, while half-heartedly acknowledging the risk associated with the meteoric growth of mainland Shadow Banking. “Such business is of low transparency and is easy to evade regulatory requirements for loans. Moreover, part of the money is invested in prohibited areas and most of the money is not yet covered by statistics of the Total Social Financing” – page 151 The translation, lacking polish is that the PBOC Financial Stability Report is saying is that they don’t include significant Shadow Bank Assets in their reporting to the FSB. Cos it looks bad, and reminder bankers don;t like the manual labor of Chinese prisons.
2017FSR(2016年末のデータ)によると中国人民銀行はなんと$29.9Tの乖離を説明しようとした、自らの試算開示数値と、Financial Stability Boardが見積もった数値の間でだ、渋々認めざるを得ないが中国本土のシャドーバンキングによりリスク資産が流星のごとく急増している。「こういうビジネスは透明性に欠き、債務に関する当局の規制を簡単に逃れるものだ。更にうと、その資金の一部は禁じられている分野に投じられ、資金の多くはTotal Social Financingの統計に計上していない」ーーpage 151。翻訳すると、PBOCのFinancial Stability Reportでは数字を舐めずにそのまま出してしまい、FSB報告書では巨額のシャドーバンキング資産を計上していないということだ。というのもこれは開示するとまずいと感じ、銀行家は中国刑務所の強制労働を望まなかった。
There’s a good chance that, at the current exchange rate, Chinese Asset Values now exceed total US Financial Assets at the end of 2018 (Total US Financial Assets were US$90.2 Trillion as of 2016 per the FSB data Set).
現在の為替レートでみると、2018年末において、中国の全金融資産は今や米国金融資産を超えてしまう可能性が大きい。(2016年次点で、FSBデータによると、米国全金融資産はUS$90.2Tだった)。
現在の為替レートでみると、2018年末において、中国の全金融資産は今や米国金融資産を超えてしまう可能性が大きい。(2016年次点で、FSBデータによると、米国全金融資産はUS$90.2Tだった)。
How is this (im)possible?
これが以下に(不)可能か?
これが以下に(不)可能か?
.…because very little is written off or written down. Bad Assets are rewritten, refinanced, rolled over and/or revalued. Trillions are locked into United States far from liquid, vacant, overvalued residential real-estate, mortgages and wealth management products tied to same. There’s no such thing as a default or a non-performing loan or WMP in China.
・・・・この件に関する書き物はとても少ないわけで。不良資産が書き換えられ、再融資され、借り換え/再評価されている。巨額の資金は米国を狙っている、当地では流動性、空室、不動産の過大評価ということはない、担保や資産運用には問題ない。中国ではよくある倒産、不良債権、理財商品というのは米国にはない。
・・・・この件に関する書き物はとても少ないわけで。不良資産が書き換えられ、再融資され、借り換え/再評価されている。巨額の資金は米国を狙っている、当地では流動性、空室、不動産の過大評価ということはない、担保や資産運用には問題ない。中国ではよくある倒産、不良債権、理財商品というのは米国にはない。
Why Are the Numbers Different?
どうして数値が異なるのだろうか?
どうして数値が異なるのだろうか?
The numbers produced by the PBOC in their Financial Stability Report should exactly match the numbers they provide to the Financial Stability Board. Total Bank Assets and Off Balance Sheet Assets are specific terms with specific definitions, yet, the figures seem to jump around, and differ by tens, or even hundreds of Trillions of Renminbi depending on the document and its source.
PBOCがFinancial Stability Reportに示した数値は彼らがFinancial Stability Boardに示した数値と正確に合致すべきものだ。全銀行資産と簿外資産とは特別な意味合いの在る特別な用語だ、しかし、その数値が跳ね回っているように見える、人民元で数十Tから数百Tも資料と出処によって異なるのだ。
PBOCがFinancial Stability Reportに示した数値は彼らがFinancial Stability Boardに示した数値と正確に合致すべきものだ。全銀行資産と簿外資産とは特別な意味合いの在る特別な用語だ、しかし、その数値が跳ね回っているように見える、人民元で数十Tから数百Tも資料と出処によって異なるのだ。
This fuzziness can be explained as bankers “giving the Chinese Communist Party what they want to tell the world”. I would do the same thing. Its tongue in cheek and keeps me out of breaking rocks in Upper Mongolia.
この鹹味さはこう説明される、銀行員は「中国共産党が世界に向けて発したい数値を開示する」。わたしもこれに合意する。二枚舌を常に確認せねばならず、モンゴル平原の岩を砕くようなことはしたくない。
Let’s do forensics on the Financial Assets and cooked GDP
金融資産と加工されたGDPをまるで裁判証拠資料のように科学捜査してみよう
この鹹味さはこう説明される、銀行員は「中国共産党が世界に向けて発したい数値を開示する」。わたしもこれに合意する。二枚舌を常に確認せねばならず、モンゴル平原の岩を砕くようなことはしたくない。
Let’s do forensics on the Financial Assets and cooked GDP
金融資産と加工されたGDPをまるで裁判証拠資料のように科学捜査してみよう
Focusing on the period from 2014 thru 2017…
2014から2017に注目すると・・・・
2014から2017に注目すると・・・・
- In 2014, China GDP was $10.48 trillion compared to Total Financial Assets of $42.1 trillion (i.e. Financial Assets were 4x GDP).
2014年には、中国のGDPは$10.48Tであり、一方全金融資産は$42.1Tだった(すなわち金融資産はGDPの4x倍だった)。 - By 2017, China GDP increased to $12.24 trillion and Mainland Financial Assets increased to $85.3trillion (i.e. a multiple of 7x GDP)
2017年になると、中国のGDPは$12.24Tに増え、中国本土金融資産は$85.3Tに増えた(すなわち、GDPの7x倍になった)。
As a point of reference US Total Financial Assets have been relatively constant at roughly 5x GDP over the same time period.
注目すべきは、米国の全金融資産は殆ど変わらずこの期間の間GDPの5x倍だった。
注目すべきは、米国の全金融資産は殆ど変わらずこの期間の間GDPの5x倍だった。
How can China create an additional $43.2 Trillion ($85.3 Mainland Financial assets minus $42.1 Total Financial assets) in Financial Assets in three (3) years, while increasing GDP by only about $400 billion a year.
如何にして中国は$43.2Tも( $85.2T本土金融資産マイナス$42.1T金融資産)わずか3年で金融資産を増やしたのだろうか、一方でGDPの増加はわずか$400B/年間にすぎなかった。
In the three year period from 2014 thru 2017 the Chinese economy created US$25.00 of new Financial Assets for every dollar of GDP. If we use PGDP (Productive GDP) in the ratio, it’s about $40.00 of Financial Assets per dollar of PGDP.
2014年から2017年の間に中国経済はGDPを1ドル増やすために新たな金融資産25ドルを生み出していた。ここでPGDP(Productive GDP)という指標を使うなら、PGDP1ドルあたり、40ドルの金融資産ということになる。
On earth 1, where we live, this is impossible.
現実世界でこんなことは不可能だ。
現実世界でこんなことは不可能だ。
China doesn’t publish real numbers. Debt service, at current mainland interest rates on $92.2 trillion of non-performing Financial Assets is rapidly approaching half of China’s (fake) GDP.
中国は本当の数字を発表していない。現在の中国本土の金利では$92.2Tにもなる不良金融資産の債務費用、これは中国の(フェイク)GDPの半分に近ずいている。
中国は本当の数字を発表していない。現在の中国本土の金利では$92.2Tにもなる不良金融資産の債務費用、これは中国の(フェイク)GDPの半分に近ずいている。
The assets might actually exist in some form, but if they do they are poised for monetization, their economic values to be inflated away (currently underway) or default over time.
資産というのは何らかの形で実際に存在するのかもしれない、しかしそれらが現金化されているなら、中国経済の価値は膨れ上がるか(現在進行中だ)もしくはやがて破産する。
資産というのは何らかの形で実際に存在するのかもしれない、しかしそれらが現金化されているなら、中国経済の価値は膨れ上がるか(現在進行中だ)もしくはやがて破産する。
When will this devastation finally hit the exchange rate, properly reflecting the true value of the Chinese economy.
この破壊が最終的に為替に反映されると、中国経済の本当の価値を正しく表すことになる。
この破壊が最終的に為替に反映されると、中国経済の本当の価値を正しく表すことになる。
So, forensics done, the post-mortem:
というわけで、科学捜査が終わり、今度は検死だ:
というわけで、科学捜査が終わり、今度は検死だ:
If the People’s Bank of China Financial Stability Report is accurate, then the Financial Stability BoardReport is wrong.
もし中国人民銀行のFinancial Stability Reportが正しいなら、Financial Stability Board 報告は間違っている。
もし中国人民銀行のFinancial Stability Reportが正しいなら、Financial Stability Board 報告は間違っている。
The Financial Stability Board report understate the level of its global assets, shadow assets and risks of default
Financial Stability Board 報告では世界資産、シャドー資産そしてデフォルトリスクを控えめに示している。
Financial Stability Board 報告では世界資産、シャドー資産そしてデフォルトリスクを控えめに示している。
There is +/- $ 28.2 trillion in China financial assets out in the wild that the world’s central bankers don’t know are there or where to find, bigly problem
世界の中央銀行が知らないところで中国金融資産には+/ー$28.2Tの乱暴な不確定性がある、これは大きな問題だ。
世界の中央銀行が知らないところで中国金融資産には+/ー$28.2Tの乱暴な不確定性がある、これは大きな問題だ。
And this has to be resolved and China has a really, really bad day
この状況は解決されねばならない、そうなると中国は本当に最悪の日を迎えることになる。
この状況は解決されねばならない、そうなると中国は本当に最悪の日を迎えることになる。
The End?
ジ・エンドか?
ジ・エンドか?
Notes
- The Financial Stability Board, (FSB) is intended to promote international financial stability; it coordinates amongst national financial authorities and is used as the framework for international regulatory, supervisory and other financial sector policies.
The Financial Stability Board (FSB)は国内金融の安定化を意図している;国家金融当局の調整を行う、そして国際規制の枠組みを尊重したものだ。 - Shadow banking is a catchall phrase and more uniquely in China, investors turned to wealth-management products for their superior returns. There are a number of pressures pushing business away from banks towards shadow banks:
シャードーバンキングというのは幅広い意味合いを持ち、中国では特別な意味合いで使われる、投資家はそのリターンの良さから理財商品に手を出す。規制のために銀行では扱えないようなビジネスがシャドーバンクに向かう:
- There are caps on bank lending volumes imposed by the People’s Bank of China and the limit of bank loans to deposits of 75% is constraining and regulators discourage lending to certain industries.
中国人民銀行の貸出には限度がある、また商業銀行ローン額には預金額の75%という制限がある、また当局は特定産業に対する貸出を控えている。 - Most non-bank channels have lower capital and liquidity requirements
ほとんどのノンバンクチャンネルでは資本規模や流動性が低い。 - Shadow banks are not subject to bank limits on loan or deposit rates
シャードーバンクでは貸出限度や預金金利で当局規制に従わない。 - Shadow banking avoids costly PBOC reserve requirements
シャドーバンクはPBOCの備蓄要請に応じない。 - it is estimated that close to two-thirds of the flow of business into shadow banking is effectively bank loans in disguise (in China)
(中国では)シャドーバンクに流入する資金の2/3は銀行ローンの偽装だと見られている。


