投稿

10月, 2019の投稿を表示しています

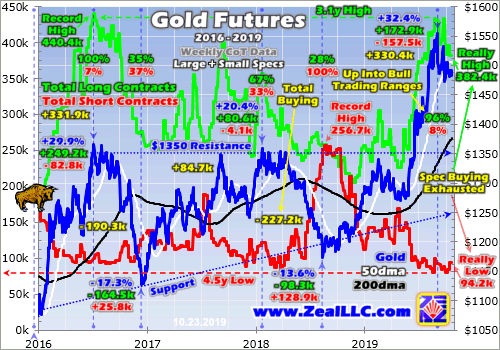
ゴールドの200日移動平均と先物投機筋ポジション

イメージ
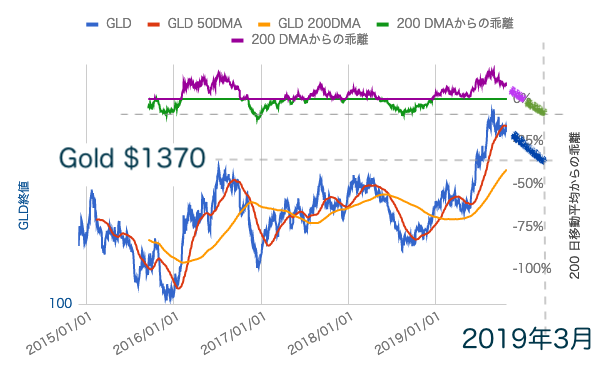
9月初めにゴールドは高値となり過熱しました、200日移動平均から17%も上方乖離し2016年夏を上回る過熱でした。その後熱が冷めてきています。9月始めからの 200日移動平均からの乖離を線形推測すると年末にゼロになり、その後3月初めには過去の下方乖離と同程度になります。過去の例を見るとそこで谷底になり再度山登りが始まります。そのときのゴールド価格は線形推測すると$1370程度です。 一方この推測がゴールド先物投機筋のポジション推移と整合性があるか?という疑問がわきます。9月初めには先物投機筋のMoney Managerのロングポジションは過去5年の変動範囲でほぼ上限に到達しました。過去の例を見ると、ここまで過熱すると投機筋ロングの弾が尽き振り子は反対側に振れます。再度熱気を帯びるには一度変動範囲が30%以下の状態で熱を冷ましてから、という傾向にあります。現在の投機筋ロングの推移を線形推測すると3月頃に30%程度となります。 という具合で、どちらももっともらしく見えます。 ただ、先のことは誰にもわかりません。金利引下げやQE4、さらには一般株式の動向によっては皆がゴールドに熱狂し、年末年始にゴールドが新高値をつけるかもしれません。世界の中央銀行はゴールドを買い込んでいるし、Peter Shiffはあれだけ熱の入った記事を公開しています。 This time is different. ここに書いたチャートはあくまでも推測です。妄想かもしれません。皆さんはどう思います?

市場の癇癪に備える:どうしてある銀行が、水曜にFEDが市場を失望させるだろうと、みるか

イメージ
Powellもクロトンの気持ちがよく分かるようになるかも。 Brace For A Market Tantrum: Why One Bank Expects The Fed Will Disappoint On Wednesday by Tyler Durden Mon, 10/28/2019 - 14:49 When it comes to the Fed's next rate decision, the market has made up its mind: as of this morning, the fed funds futures market is pricing in a probability of 91% that the Fed announces another 25bps rate cut at 2pm on Wednesday, with odds of no cut at just 9%. FEDの次の金利政策に関して、市場の期待は定まっている:今朝の時点では、水曜午後2pmにFEDが25BPS金利引下げをすることを織り込んでいる、切り下げをしない可能性はわずか9%だ。 So certain are strategists that the Fed will deliver another "insurance" cut - the third in a row - that discussion has now firmly shifted to what the Fed will do in its next, December, meeting with the FT writing that the "Federal Reserve faces the thorny decision of whether to signal an interruption to its monetary eas

どうしてゴールドは失速したか by Zeal

イメージ
Why Gold Has Stalled Adam Hamilton     October 25, 2019     3001 Words Gold has stalled out, drifting sideways to lower for nearly a couple months now.  Traders are becoming more frustrated its preceding powerful rally has failed to resume.  That is inexorably eroding this past summer’s bullish psychology.  Corrective phases to rebalance sentiment are normal and healthy after strong uplegs.  Gold had grown too overbought, exhausting traders’ near-term buying firepower in the process. ゴールドは失速した、この二ヶ月横ばいか下落だ。これまでの力強いラリーが再開せず、トレーダーのフラストレーションは溜まっている。この状況が今年の夏の強気心理を劣化させている。相場全体から見ると強い上昇後の心理再バランスというのはよくあるもので健全なものだ。ゴールドはあまりに買われすぎた、その過程でトレーダーの短期的な買いの弾が尽き果てたのだ。   Bull markets are simply an alternating series of uplegs and corrections.  Visualize the core bull-market trend as a rising straight line, and uplegs and corrections are like a sine wave oscillating around it.  Prices power to new bull highs in uplegs, surging well above tre

次の大口売り手は中国企業だ、西欧企業を手放そうとしている

イメージ
日本人にとっては既視感のある出来事で・・ The Next Big Seller Are Chinese Firms, Looking To Offload Western Companies by Tyler Durden Wed, 10/23/2019 - 19:30 Before the next recession strikes and valuations reset, who around the world will be the next bag holder? The Chinese have understood in the last several years, it could be them. Their recent acquisitions of foreign companies were paid at hefty premiums, and now, it seems that with an imminent global trade recession, these folks are ready to dump. 次の景気後退とバリュエーション見直し前に、世界中の bag holder (無用資産持ち手)となるのは誰だろう?ここ数年それは中国がそうかもと思われていた。ここ数年の彼らの海外企業買収には巨額なプレミアムが盛り込まれていた、今になり、世界貿易景気後退が差し迫り、彼らは投げ出そうとしている。 Bloomberg outlines a significant problem. Since the Chinese overpaid for many foreign companies in the l

CEO信頼指数は急落、これから起きることを消費者は望まないだろう

イメージ
CEO Confidence Plunges, Consumers Won't Like What Happens Next by Tyler Durden Mon, 10/21/2019 - 13:05 Authored by Lance Roberts via RealInvestmentAdvice.com, There is a disparity happening in the country. 国中に対立が起きている。 No, it isn’t political partisanship, but rather  “economic confidence.” それは政治的対立ではなく、「経済信頼」に関するものだ。 The latest release of  the University of Michigan’s consumer sentiment survey  rose to a three-month high of 96, beat consensus expectations, and remains near record levels. Conversely, CEO confidence in the economy is near record lows. ミシガン大学の最新消費者信頼指数は3ヶ月ぶりの高値96になった、市場予想を上回った、そして記録的なレベルだ。逆に、CEO経済信頼指数は記録的低位になっている。 It’s an interesting dichotomy. 興味深い対立だ。 The chart below shows our composite confidence index, which combines both the University of Michigan and Conference Board measures. The chart compares