次の10年、ほとんどのファイナンシャルプランはまずいことになるだろう
The Next Decade Will Likely Foil Most Financial Plans
Authored by Lance Roberts via RealInvestmentAdvice.com,
There are many individuals in the market today who have never been through an actual “bear market.” These events, while painful, are necessary to “reset the table” for outsized market returns in the future. Without such an event, it is highly likely the next decade will foil most financial plans.
現在の市場参加者の多くは本当の「ベアマーケット」を経験していない。こういう事が起きると、痛みを伴うが、将来の大きなリターンを可能にするために必要なちゃぶ台返しとなる。これがないと、多くのファイナンシャルプランは今後10年ひどいことになりそうだ。
No. The March 2020 correction was not a bear market. As noted:
2020年3月の調整はベアマーケットと呼べるようなものではなかった。以前にも指摘したが:
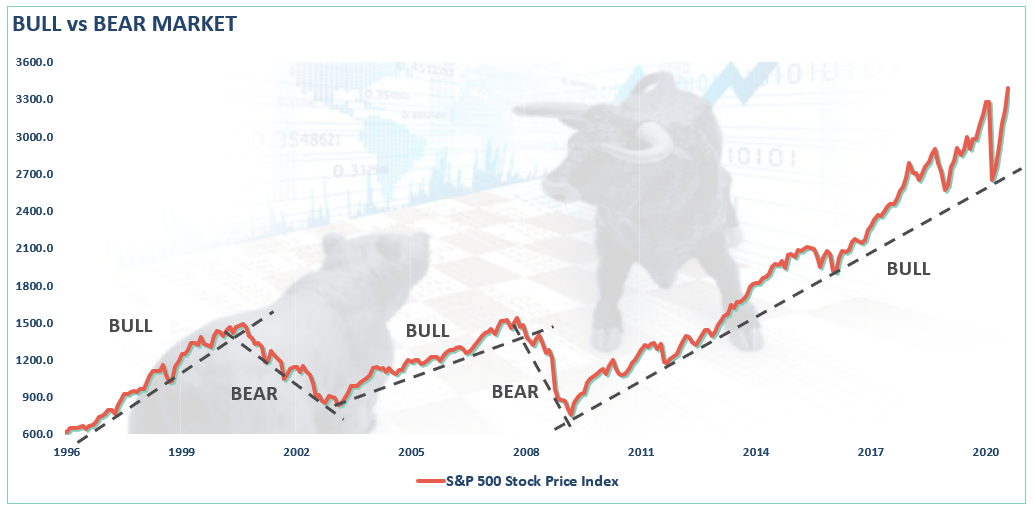
A bull market is when the price of the market is trending higher over a long-term period.
ブル相場とは長期に渡り市場価格が上昇するものだ。A bear market is when the previous advance breaks, and prices begin to trend lower.
ベア相場とはこれまでの上昇が止まり、市場価格が下落し始めることだ。
The chart below provides a visual of the distinction. When you look at price “trends,” the difference becomes both apparent and useful.
このチャートはその区分けを視覚的に示したものだ。株価の「トレンド」を見れば、その違いは明らかで有用なものだ。
The distinction is essential.
違いは明らかだ。
“Corrections” generally occur over short time frames, do not break the prevailing trend in prices, and are quickly resolved by markets reversing to new highs.
「調整」とは短期に起きるもので、これまでの価格トレンドを壊すものではない、そしてすぐに市場反転で解消し、新高値を迎える。“Bear Markets” tend to be long-term affairs where prices grind sideways or lower over several months as valuations are reverted.
「ベア相場」とは長期的な出来事であり、価格横ばい・下落が数ヶ月続きバリュエーションが回復する。
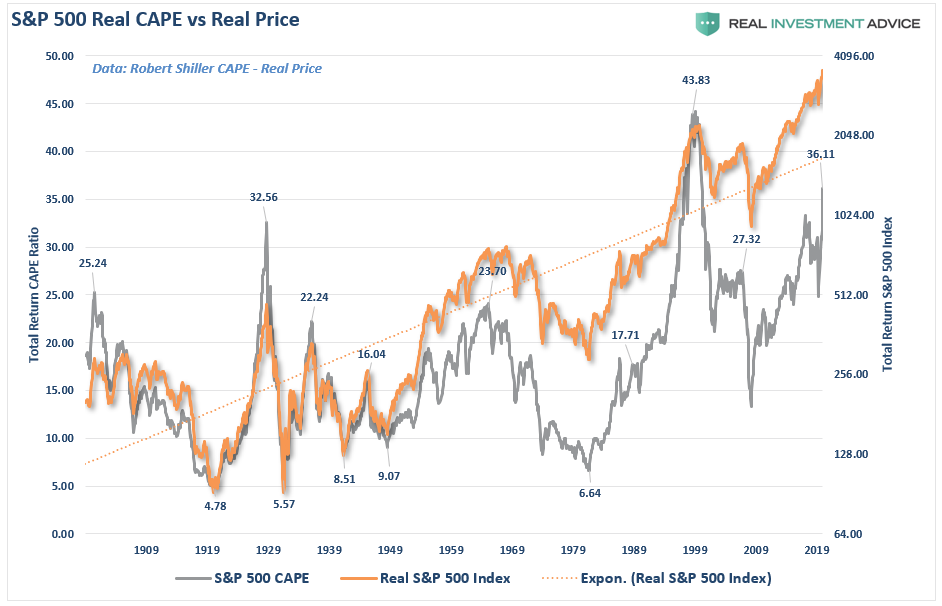
No Valuation Reversion
The last bullet point is the most important. During “bear markets,” valuations are historically reverted. However, during the 2020 correction, valuations not only did not revert, they actually increased.
最後に最も大切なことを伝えよう。過去を振り返ると、「ベアマーケット」期間にバリュエーション動向は反転してきた。しかしながら2020の調整ではバリュエーション動向が反転しないばかりか実際には増え続けた。
The problem, of course, is that valuations tell you everything about “future returns” on invested capital. Such should be relatively obvious. If you overpay for a car, a house, or a tract of raw land, when you go to sell it, you will most likely not make money. The same holds true for capital invested in markets.
当然のことであるが問題は、バリュエーションが投資資金の「将来リターン」を教えてくれる。これは相対的に明らかなことだ。もしみなさんが自動車や住宅、土地購入時に払い過ぎだと、売却時に利益を上げることはできない。市場への資金投資もこれと同じことだ。
However, in the midst of a “raging bull market,” investors, in the short-term, lose sight of this long-term reality. As Howard Marks noted in a recent Bloomberg interview:
しかしながら「加熱するブル相場」を目の当たりにした投資家たちは、短期的にこの長期的現実を忘れてしまう。Howard Marksが最近のブルームバーグのインタビューでこう答えた。
“Fear of missing out has taken over from the fear of losing money. If people are risk-tolerant and afraid of being out of the market, they buy aggressively, in which case you can’t find any bargains. That’s where we are now. That’s what the Fed engineered by putting rates at zero.
「資金を失うのではという懸念よりも利益機会を見逃してしまうのではないかという懸念のほうが大きくなっている。多くの人のリスク許容度が大きくなり市場の投資機会を見逃すのではないかと思うと、彼らは積極的に買い込む、こういうときにバーゲンセールを見つけ出すことはできない。今まさに我々はそういう状況にいる。FEDが意図的に金利をゼロにしているためだ。」
“We are back to where we were a year ago—uncertainty, prospective returns that are even lower than they were a year ago, and higher asset prices than a year ago. People are back to having to take on more risk to get return. At Oaktree, we are back to a cautious approach. This is not the kind of environment in which you would be buying with both hands.
The prospective returns are low on everything.”
「今我々は一年前と同じような状況にあるーー不確実性が高く、将来予想リターンは一年前よりもさらに低い、そして株価はー年前よりもさらに高い。人々はリターンを得るためにさらにリスクを取らざるを得ない。Oaktreeでは、注意深く行動している。両手いっぱいに市場で買い求める状況にはない。
どの銘柄も将来リターンはとても低い。」
There are two main reasons why returns over the next decade, or two, are currently being overestimated. The first is a “you problem,” the second is “math”.
今後10年、20年でのリターンが今過剰評価されている理由は2つある。一つは「あなた自身の問題」、2つ目は「算術」。
It’s A You Problem
One of the biggest impediments to achieving long-term investment returns is the impact of emotionally driven investment mistakes.
長期的投資リターンを得る最大の妨げは感情に動かされた投資行動だ。
Investor psychology is helpful in understanding the specific thoughts and actions that lead to poor decision-making. That psychology not only drives the “buy high/sell low” syndrome, but also the traps, triggers, and misconceptions that lead to a variety of irrational mistakes that reduce returns over time.
投資家の心理が考え方や行動に影響を及ぼし不適当な判断を引き起こす。こういう心理は単に「高く買って安く売る」症候群を引き起こすだけではなく、長期的リターンを悪化させる各種間違いや誤解を引き起こすキッカケ、罠に陥る。
There are 9-distinct behaviors that tend to plague investors based on their personal experiences and unique personalities.
投資家の経験や個人的資質により引き起こされるまずい行動は9つに分類される。
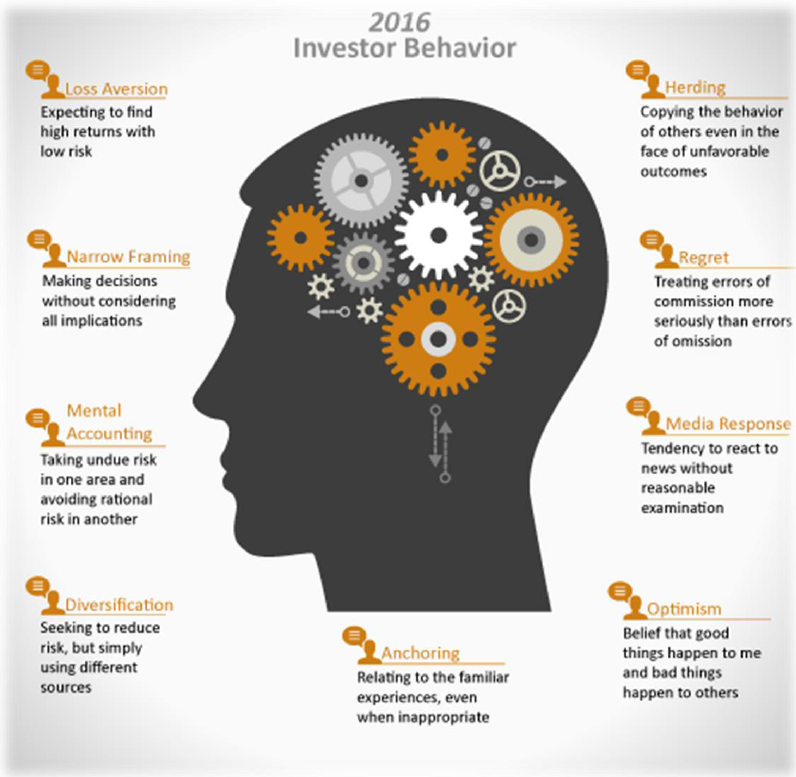
The biggest of these problems for individuals is the “herding effect” and “loss aversion.”
こういう行動のうちで最悪なのは「群集心理」と「損失回避」行動だ。
These two behaviors tend to function together compounding the issues of investor mistakes over time. As markets are rising, individuals are lead to believe that the current price trend will continue to last for an indefinite period. The longer the rising trend lasts, the more ingrained the belief becomes until the last of “holdouts” finally “buy-in” as the financial markets evolve into a “euphoric state.”
この2つの行動は複合的に機能して投資家が間違いを引き起こす。市場が上昇すると、現在の株価トレンドがずっと続くだろうと信じ込んでしまう。上昇が長引くほどに、確信に変わり、それまで「ポジションホールド」だったのがとうとう「さらに買い増し」行動となる、こうなると市場は「euphoria状態」になる。
As the markets decline, there is a slow realization that “this decline” is something more than a “buy the dip” opportunity. When losses mount, the anxiety of loss increases until individuals seek to “avert further loss” by selling.
市場が下落し始めると、だんだんと「この下落」はもはや「押し目買い」機会では無いのではと感じ始める。評価損が積み上がると、「さらなる損失回避」のために売りにでる。
The chart below shows that the behavioral trend runs counter-intuitive to the “buy low/sell high” investment rule.”
下のチャートを見れば行動トレンドが見て取れる、「安く買って高く売る」という投資の原則に反した行動を取っている。

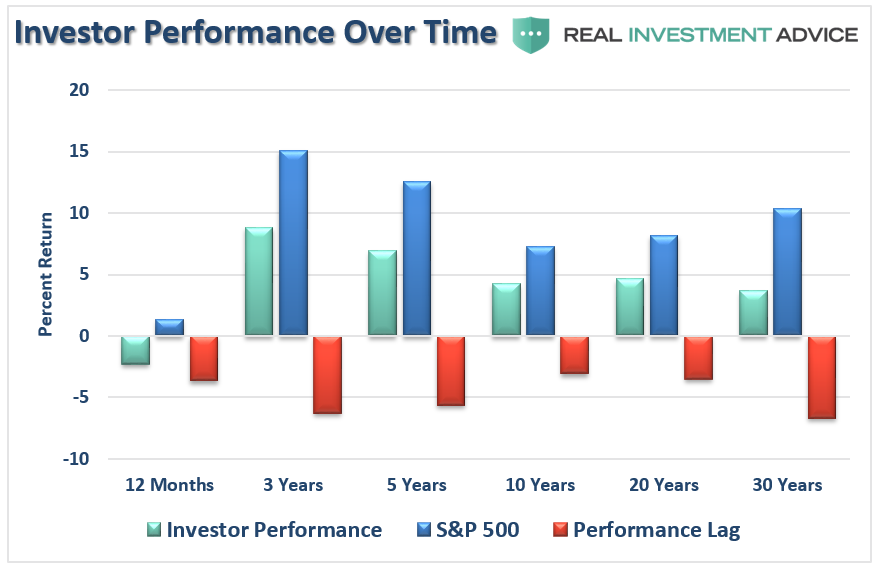
The impact of these emotionally driven mistakes leads to long-term under-performance well below those “goal-based” financial projections. According to Dalbar, this underperformance exists over exceptionally long time frames.
こういう感情的な行動が長期リターンを悪化させる。Dalbarによればこういうアンダーパフォーマンスは長期的にも見られる。
It’s Just Math
The vast majority of Americans actually have a relatively short timeframe in which to accumulate assets for retirement. For most, by the time a point in life is reached where one can seriously accumulate savings, it is about 15-20 years.
圧倒的多数の米国人は、引退に備えた資産形成にかけられる時間はかなり短い。最長期間をみつもっても、引退までに資産形成をする残された時間は15−20年程度でしかない。
And therein lies the problem.
そして多くの誤解があることが問題だ。
As we have discussed previously in “Rationalizing High Valuations:”
私どもはかつてこういう記事で議論した「高バリュエーションを冷静に見つめよ:」
“The mistake investors repeatedly make is dismissing the data in the short-term because there is no immediate impact on price returns. As noted above, valuations by their very nature are HORRIBLE predictors of 12-month returns. Investors avoid any investment strategy which has such a focus. In the longer term, however, valuations are strong predictors of expected returns.”
「投資家が繰り返す過ちは、短期的な値動きが無いためにデータを見誤ることだ。これまで議論したが、バリュエーションというのは今後12ヶ月のリターンに対してゾットするような見通しを教えてくれる。こういう支店での投資戦略を投資家は無視しがちだ。しかしながら長期的に見ると、バリュエーションは長期的リターンに対して強い先見性がある。」
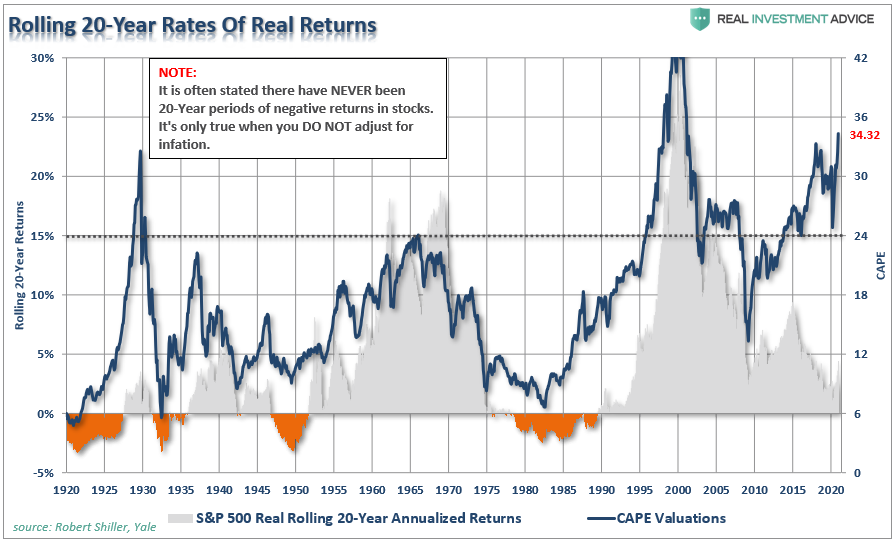
The charts below show the 10 and 20-year rolling REAL, inflation-adjusted, returns for the market as compared to trailing valuations.
下のチャート二枚はインフレ調整後の実際の10年後20年のリターンとtrailing valuationを比較したものだ。
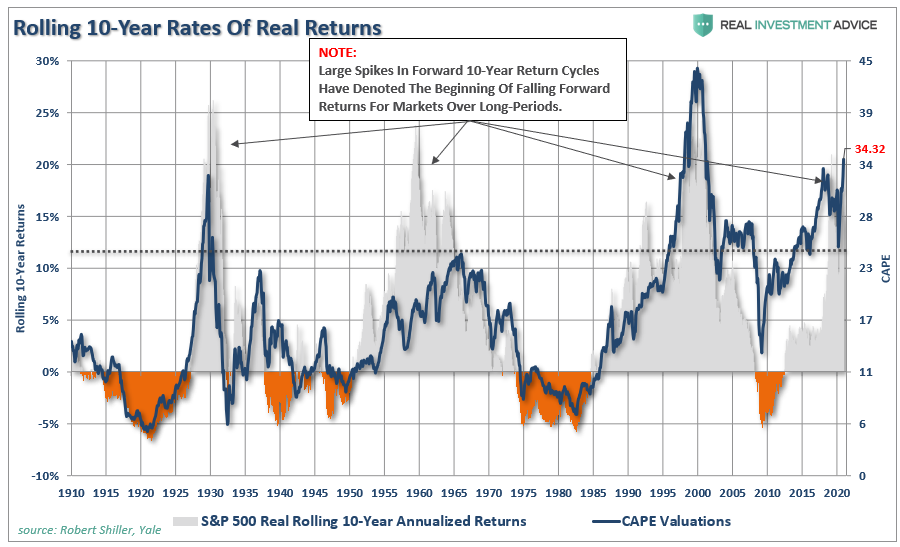
(Important note: Many advisers/analysts often pen that the market has never had a 10 or 20-year negative return. That is only on a nominal basis. Inflation must be included in the debate.)
(重要な警告:多くのフィナンシャル・アドバイザー/アナリストは市場の10年20年マイナスリターンについて言及しない。名目値についてのみだけだ。インフレも議論すべきだ。)
(そもそも日本の証券会社で10年以上の長期チャートを見せるところは少ない。)
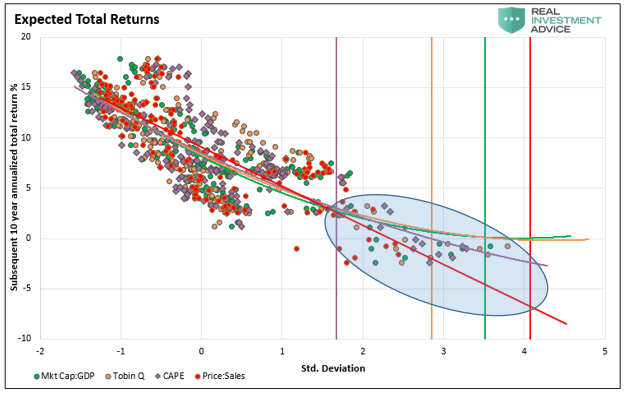
As we pointed out in “Do You Feel Lucky,” virtually all measures of valuation currently suggest that forward returns over the next decade, or longer, will be low.
「あなたは幸運と感じるか、」という記事で私どもは多くのバリュエーション指標を使い、今後10年、それ以上のリターンが少ないと見られることを示した。
There are two important points to take away from the data. First, there are several periods throughout history where market returns were not only low but negative. Secondly, the periods of low returns follow periods of excessive market valuations.
データから見てわかる重要なことが2つある。一つは、過去のデータを振り返ると現在のバリュエーションではリターンが少ないだけでなくマイナスになることが度々だった。第二に、バリュエーションが行き過ぎるとその後のリターンは小さいということだ。
This Time Is Not Different.
As David Leonhardt noted previously:
David Leonhardtが以前に書いたことだが:
“The classic 1934 textbook ‘Security Analysis’ – by Benjamin Graham, a mentor to Warren Buffett, and David Dodd – urged investors to compare stock prices to earnings over ‘not less than five years, preferably seven or ten years.’ Ten years is enough time for the economy to go in and out of recession. It’s enough time for faddish theories about new paradigms to come and go.”
「1934年の古い教科書「証券分析」ーー著者:Benjamin Graham、彼はWarren BuffettやDavid Doddの導師だがーー この本で投資家は株価を評価する際には過去5年ではなく7年から10年過去の収益を見るように教えている。10年も立つと経済全般が後退期を迎えたり終えたりするだろう。これぐらいを見ると新たなパラダイムシフトが実際に起きているかどうかを判断するに十分だ。」
History shows that valuations above 23x earnings have tended to denote secular bull market peaks. Conversely, valuations at 7x earnings, or less, have tended to denote secular bull market starting points.
歴史が教えてくれるところによれば、バリュエーションが収益の23xとなるとこれは長期ブル相場のピークを迎える頃合いだ。控えめに見て、バリュエーションが収益の7xかそれ以下となると長期的なブル相場の起点となりやすい。
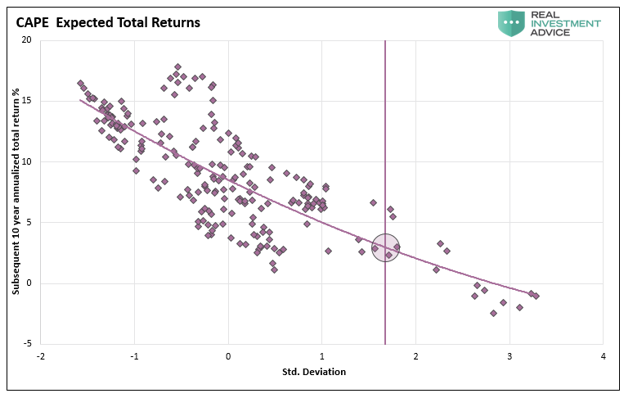
This point can be proven not only by looking at the distribution of returns in the chart below but mathematically as well.
この判断時点は下のチャートのリターン分を見てもわかるだけでなく、算術的にも明らかだ。
Capital gains from markets are primarily a function of market capitalization, nominal economic growth plus the dividend yield. Using John Hussman’s formula we can mathematically calculate returns over the next 10-year period as follows:
キャピタルゲインはまずは市場時価総額、名目経済成長率プラス配当率に依存する。John Hussmanの公式で言えば、今後10年のリターンを次式で計算できる:
(1+nominal GDP growth)*(normal market cap to GDP ratio / actual market cap to GDP ratio)^(1/10)-1
Therefore, IF we assume that GDP could maintain 2% annualized growth in the future, with no recessions, AND IF current market cap/GDP stays flat at 1.25, AND IF the dividend yield remains at roughly 2%, we get forward returns of:
しかるに、今後もGDP成長率が2%であり、景気後退が無いとしよう、そしてもし現在の時価総額/GDPが1.25のまま変わらないとする、そしてさらに配当率が2%と変わらないとしよう、この仮定のもとで将来のリターンはこうだ:
(1.02)*(1.2/1.5)^(1/10)-1+.02 = 1.75%
But there is a “whole lotta ifs” in that assumption. More importantly, if we assume that inflation remains stagnant at 2%, as the Fed hopes, this would mean a real rate of return of -0.25%.
この前提には「多くの if 」がある。もっと重要なことは、今後もFEDの期待どおりにインフレ率が2%だと実リターンは -0.25%になってしまうことだ。
In either case, these numbers are well below the majority of financial plan projections which will leave retirees well short of their expected retirement goals.
どちらにしろ、これらの予想数値は引退に備えた多くのフィナンシャルプランの予想よりも小さい、引退時に十分な資金を得られないだろう。
Conclusion
While the majority of analysis is based on the idea that individuals should “buy and hold” indexed based portfolios, reality has been far different.
殆どのアナリストは個人投資家に株式指数連動ファンドの「buy and hold」戦略を推奨する、実際にはこれは殆ど役に立たない。
With retirement plans having a finite time span for both accumulation and distribution of assets, the time lost in “getting back to even” following a major market correction is the primary consideration.
引退に備え、貯蓄をしたり投資をする時間には限りがある、大きな市場調整後相場が「元値に戻るまで」に大きな時間損失を生じる、これを考慮せねばならない。
The chart below picks up on the investor psychology chart first shown above. The chart below illustrates the difference between expectations and reality. The illustration shows the difference between the inflation-adjusted return on a $100,000 investment in the S&P 500 growing at 8% annually as opposed to the impact of gains and losses in market returns over time. The reason the chart begins in 1990, despite analysis showing 120-year investment returns, is that covers almost all investors in the markets currently.
下のチャートは投資家心理を示したものだ。ここに示すのは投資家の期待と現実の差異を示している。S&P500が年率8%の成長をするとして$100,000を投資したときの長期的利益と損失を図示した。このチャートの起点は1990年とし、120年にわたり投資リターンを図示した、これぐらいの期間をかんげれば現在の市場参加者すべてをカバーしているだろう。
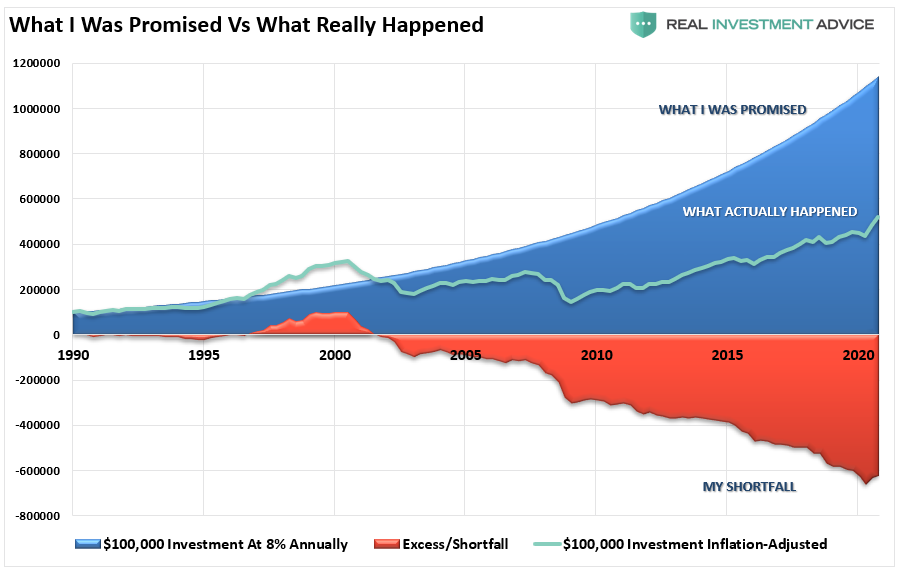
Unfortunately, most investors remain woefully behind their promised financial plans. Given current valuations, and the ongoing impact of “emotional decision making,” the outcome is not likely going to improve over the next decade, or possibly two.
残念なことに、殆どの投資家は約束されたプランを全く実現できない。現在のバリュエーションと「感情的な投資判断」を続けるなら、今後10年のみならず今後20年も良い結果は期待できない。
Conclusion
Markets are not cheap by any measure. If earnings growth fails to grow sharply, interest rates rise, not to mention the impact of demographic trends, the bull market thesis will collapse as “expectations” collide with “reality.”
どういう評価手法を用いても現在の市場は安くはない。もし収益成長が急激に伸びない限り、また金利が上がらない限り、人口動態が大きく変わらない限り、今のブル相場のテーマは終わりを告げ、「期待」は「現実」に打ち砕かれるだろう。
Such is not a dire prediction of doom and gloom, nor is it a “bearish” forecast. It is just a function of how the “math works over time.”
だからといって悲観的なことを言っているわけでもないし、「弱気」な予想をしているわけでもない。これは単に「長期的なリターンに関する算術」について言及しているだけだ。
For investors, understanding potential returns from any given valuation point is crucial when considering putting their “savings” at risk. Risk is an important concept as it is a function of “loss.”
投資家はだれも、あるバリュエーションのときの潜在的なリターンについて理解すべきで、みずからの「貯蓄」をリスク資産に投じるときに絶対的に考慮すべきことだ。リスクというのは「損失」に関する重要な概念だ。
The more risk that is taken within a portfolio, the greater the destruction of capital will be when reversions occur.
みずからのポートフォリオでさらにリスクを取ろうとするなら、予想と反対のことが起きたときには破壊的資本毀がおきることも承知すべきだ。
This time is “not different.” The only difference will be what triggers the next valuation reversion and when it eventually occurs. Two bear markets taught many this lesson. Currently, there is a whole generation of investors who will have to learn this lesson the hard way.
This time is " not different."なのだ。その違いは次のバリュエーション反転を引き起こすキッカケだけにすぎない、またそのタイミングの差でしかない。これまでの2回のベア相場が多くのことを教えてくれた。現在は、どの世代の投資家もこの教えを懸命に学ばねばならない。


