現在は長期的ブル相場だろうか?
一定のエネルギーが外部から流入する系ではその流入量が普遍一定でも、散逸構造、自己組織化をすることが知られています。散逸構造では空間時間的な周期構造が生じます。たとえば隔離された無人島にうさぎときつねを放した場合、時間とともに均衡値に近づきますが、完全な定常状態にはならずその前後で周期的な変動が起きます、うさぎを捕食しすぎてが減るとキツネの食料が減りキツネの個体数上昇には限界が生じ、その後うさぎの個体数が増えます。うさぎの数もその島の植物総量に限界があります。
株式市場にも30年前後のバリュエーション変動があります。管理人はこの原因はたぶん投資家の世代交代に起因するものだと感じています。多くの人の投資寿命は30年前後です。私を含めて現在投資をしている人は英國や日本で政府債務解消のための金融抑圧など記憶にもないでしょう、学校の歴史でも教えてくれません。あの米国でも金本位制のなかで国民からゴールドを強制買い上げし、ゴールド価格を改定したり個人がゴールド保有を長年禁止していたことを多くの人は知らないでしょう。少なくとも私は学校の歴史で習った覚えがありません。
また大統領任期に関連した8年前後の変動があります、政党は政権を維持するために選挙に向けて財政刺激策を行いますが選挙後にはこれが息切れします。大統領選挙前数ヶ月の株価動向と選挙結果、民主共和転換、の相関は90%を超えています。トランプのときもそうでした、YellenはFRB議長としては珍しい熱心な民主党員で、FEDバランスシート正常化の先送り、二回目の金利引き上げの先送りをしたのですが、2016年秋には株価が徐々に下落してしまいました。
次に短いのが1年の変動で気候に関する人の気分や新学期・新年度に関するものです。もっと短いのが週間の変動で、月曜や金曜は特異的な動きをします。こういう繰り返しは左の参考図書「市場のサイクルは永遠に」に解説されています。
Are We In A Secular Bull Market?
Written by Lance Roberts | Jan, 7, 2019
Just recently, Jeff Saut from Raymond James made a very interesting statement with respect to the recent market decline.
つい最近、Raymond James社のJeff Sautがとても面白いことを言った、最近の相場下落に関してだ。
It is an interesting point and one that has been prognosticate by several Wall Street analysts and bloggers in recent months like Josh Brown who recently penned:
これは興味深いことだ、Wall Streetのアナリストは度々こういう見解を示してきた、Josh Brownのようなブロガーもここ数ヶ月こういうふうに書いている:
Here is the problem with the analysis.
これこそ分析結果の問題だ。
Secular markets, bull or bear, are not defined by price movements.
Secular markets 市場のサイクルは、ブルであれベアであれ単に株価動向だけで判断できない。
For example, if the market is down 20%, the technical definition of a “bear market”, then any rallies and subsequent declines that set new lows, are not defined as a “secular bear market.” It is just a “bear market” where prices are “trending” lower rather than “higher.”
たとえば、もし相場が20%下落したなら、テクニカル的な定義では「bear market」だ、こうなるとどのラリーとその後の下落は新安値と捉えられる、しかしこれは「secular bear market」と定義されるわけではない。これは単に「bear market」であり株価が「傾向」として安値にむかっているだけであり、「高値」にむかっているわけではないというだけだ。
What defines secular, or very long-term, markets are valuations.
とても長期的な市場のサイクルを決めるのはバリュエーションだ。
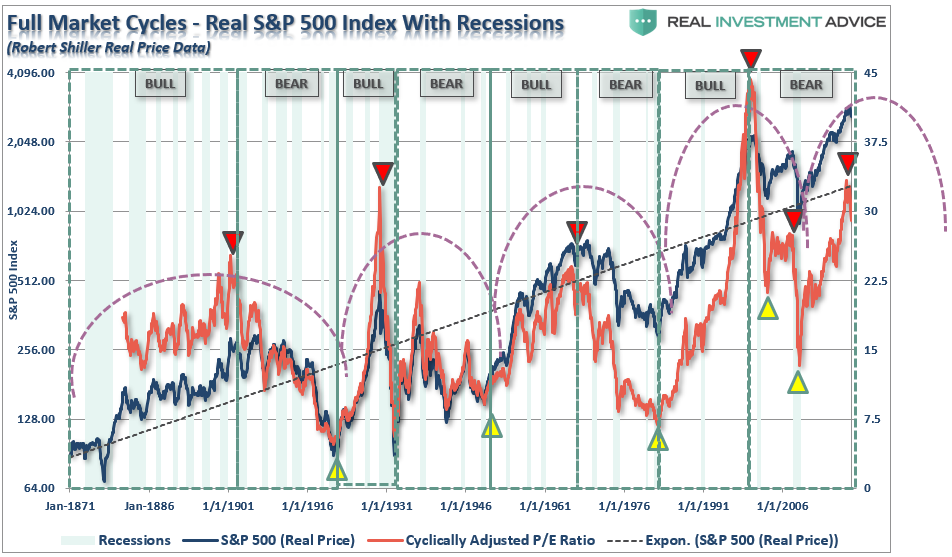
The chart below shows the history of secular bull market periods going back to 1871 using data from Dr. Robert Shiller. One thing you will notice is that secular bull markets tend to begin with valuations around 10x earnings and end at 23-25x earnings or greater. (Over the long-term valuations do matter.)
下のチャートは1871年まで遡るブル相場のサイクルを示している。ここでみなさんも気づくだろうが、secular bull 相場はバリエーションが10xPER程度から始まり23−25xPERで終わる。(長期的なバリュエーションが大切だ。)
But, here is the other problem I have with both Josh and Jeff’s thesis of a price based breakout defining a new secular “bull” market.
しかし、ここにもう一つ問題がある、JoshやJeffがテーマにしている株価のブレークアウトを元に定義する新たなsecular 「bull」相場だ。
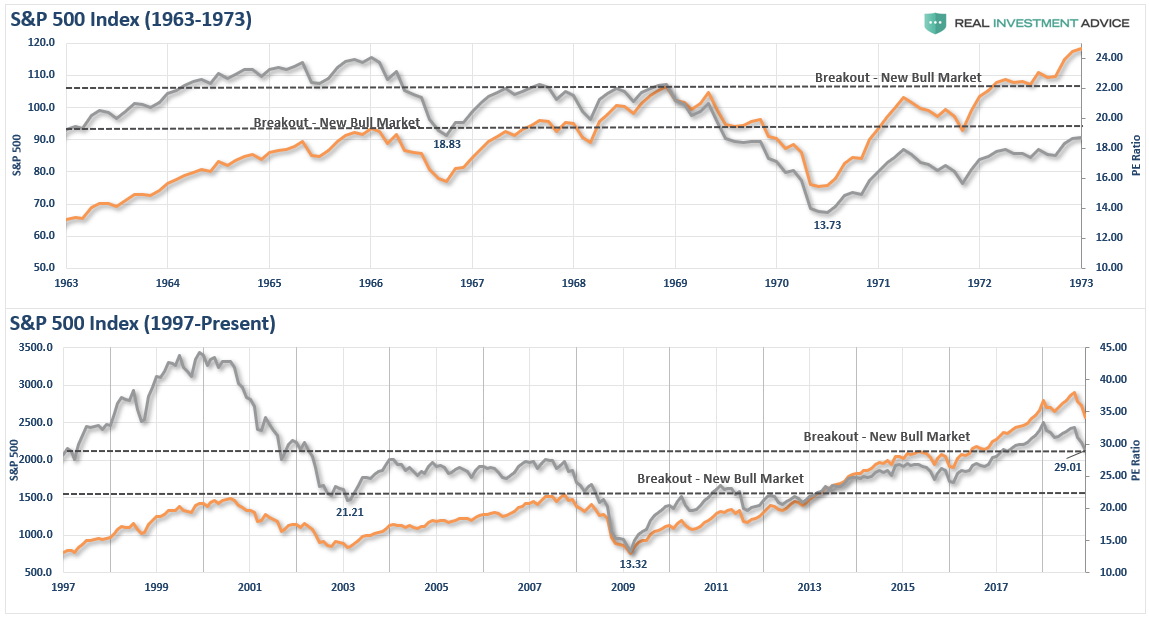
The chart below compares the last secular “bear” market that ran from 1963 to 1982 as compared the current cycle. Notice the chart for this previous period stops in 1973. I will show you the rest of this period in a moment. Also, importantly, note the level of valuations.
下のチャートは直近のsecluar 「bear」相場を示す、1963から1982のものだ、これを現在のサイクルと比べている。このチャートでは前回の期間を1973年で終わっていることに注意してほしい。残りも期間もすぐに示そう。それに加えて大切なのはバリュエーションのレベルだ。
What is important, besides the very similar pattern between the two periods, is the breakout in 1969 did not start a new “secular” bull market. Rather, it was a setup for the next major decline.
大切なことは、2つの期間のパターンはとても良く似ているが、1969年のブレークアウトは新たな「secular」bull 相場ではないということだ。むしろ、それは次の大きな下落の始まりだった。
Not so fast.
まあそう結論を急がないように。
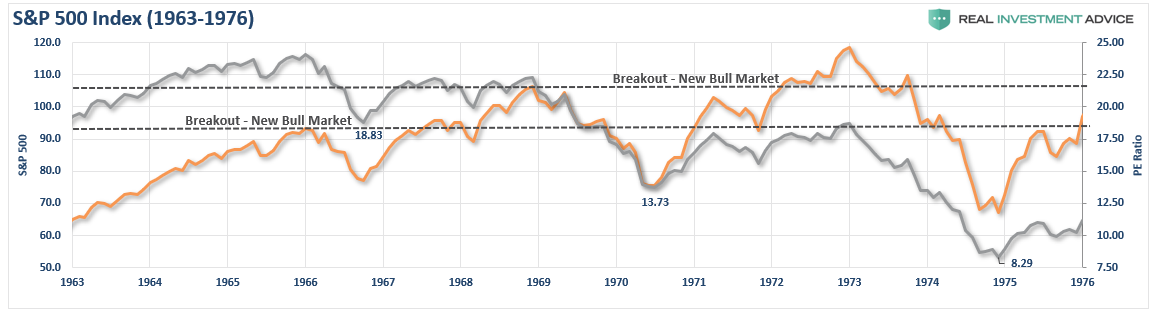
The second breakout in 1972, like the previous, was the setup for the final market dive that reset valuation levels back to historic secular bear market lows. That crash also created the necessary extreme negative in investor psychology. The 1974 bear market low was also known as a “black bear market” as investors were so brutally ravaged they did not return to the markets in earnest until nearly two decades later.
1972年の二度目のブレークアウト、これも前回と同様で、これは最終的にバリュエーションをリセットするための仕掛けだった、歴史的な secular bear 相場安値に向かうものだった。この暴落は投資家心理を極端に落ち込ますものだった。1974年のベア相場安値は「black bear market」として知られ、投資家は極端にやつれきり株価が回復するまでに20年を要した。
As noted above, it is not just price action that denotes secular bull and bear market periods.
上にも書いたが、secular bull and bear を示すのは株価ではない。
It is valuations.
それはバリュエーションなのだ。
What drives long-term secular “bull” markets is “valuation expansion.” In order to have the magnitude of “valuation expansion” needed to support a secular “bull” market, you must both start at “under-valued” levels and have the economic factors and investor enthusiasm to support a return to “over-valued” levels.
長期的な secular 「bull」相場を駆動するものは「バリュエーションの拡大」だ。secular 「bull」相場を生み出す「バリュエーション拡大」にうまく乗るためには、皆さんは2つのことが必要だ、一つは「過小評価」された状態から相場に参入すること、そして経済的環境や投資家の熱狂で「過大評価」されるれべるまで持ち続けることだ。
The ability to have a “1982-2000 affair” is highly improbable. The 1982-2000 secular bull market cycle was driven primarily by a multiple expansion process which began with valuation levels of 5-7x earnings and a dividend yield of 5%. Interest rates and inflation were at extremely high levels and were at the beginning of a 40-year decline which would increase profitability as production and borrowing costs fell.
「1982−2000の出来事」が再現するのはほとんどありえない。1982−2000のseculare bull market cycle を生み出した主要因は、当初のバリュエーションが5-7xのPERと配当率5%から何倍にもなるプロセスを経たことだ。始まりの時点で金利とインフレは極端に高く、その後40年をかけて下落した、これが生産コスト債務コスト下落で利益を増やし続けた。
The first chart shows the secular bear market of the ’60s and ’70s with an overlay of valuations, dividends, interest rates and inflation.
下の最初のチャートは60年代70年代の secular bear market を示すもので、バリュエーション、配当、金利、そしてインフレ率を同時に示している。
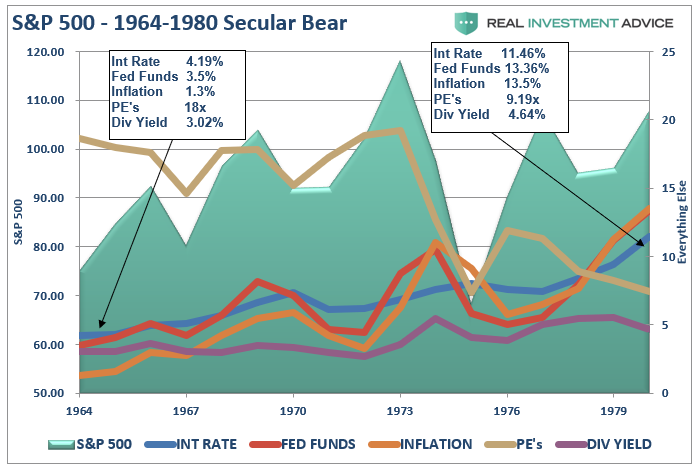
You will notice that at the beginning of the bear market in the 60’s valuations were high while everything else was low. By the end of the secular period, these factors were reversed.
みなさんも気づくだろうが、60年代にベア相場の始まりではバリュエーションは高く、他はどれも低かった。このサイクルの最後までに、これらのよういんはどれも反転した。
Now, let’s juxtapose that previous period with the much beloved, and hoped for, secular bull market of the 1980s and ’90s.
ここで、皆がこれまで熱狂しこれからもそうであってほしいこれまでと比べてみよう、1980,1990年代の secular bull 相場だ。
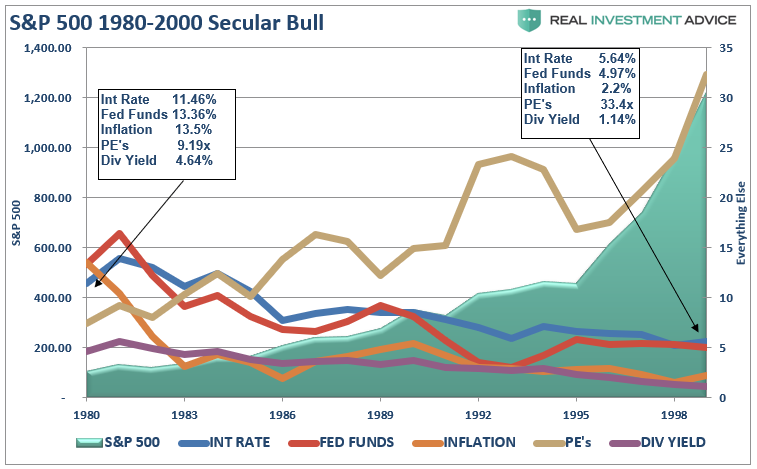
There were several contributing factors that drove that particular secular bull market:
この secular bull 相場を生み出したいくつかの要因はこういうものだ:
下の2枚のチャートが経済的ファンダメンタルズとS&P500を示す、そして1983年に変化が起きたことを示している。(赤線で分離している)
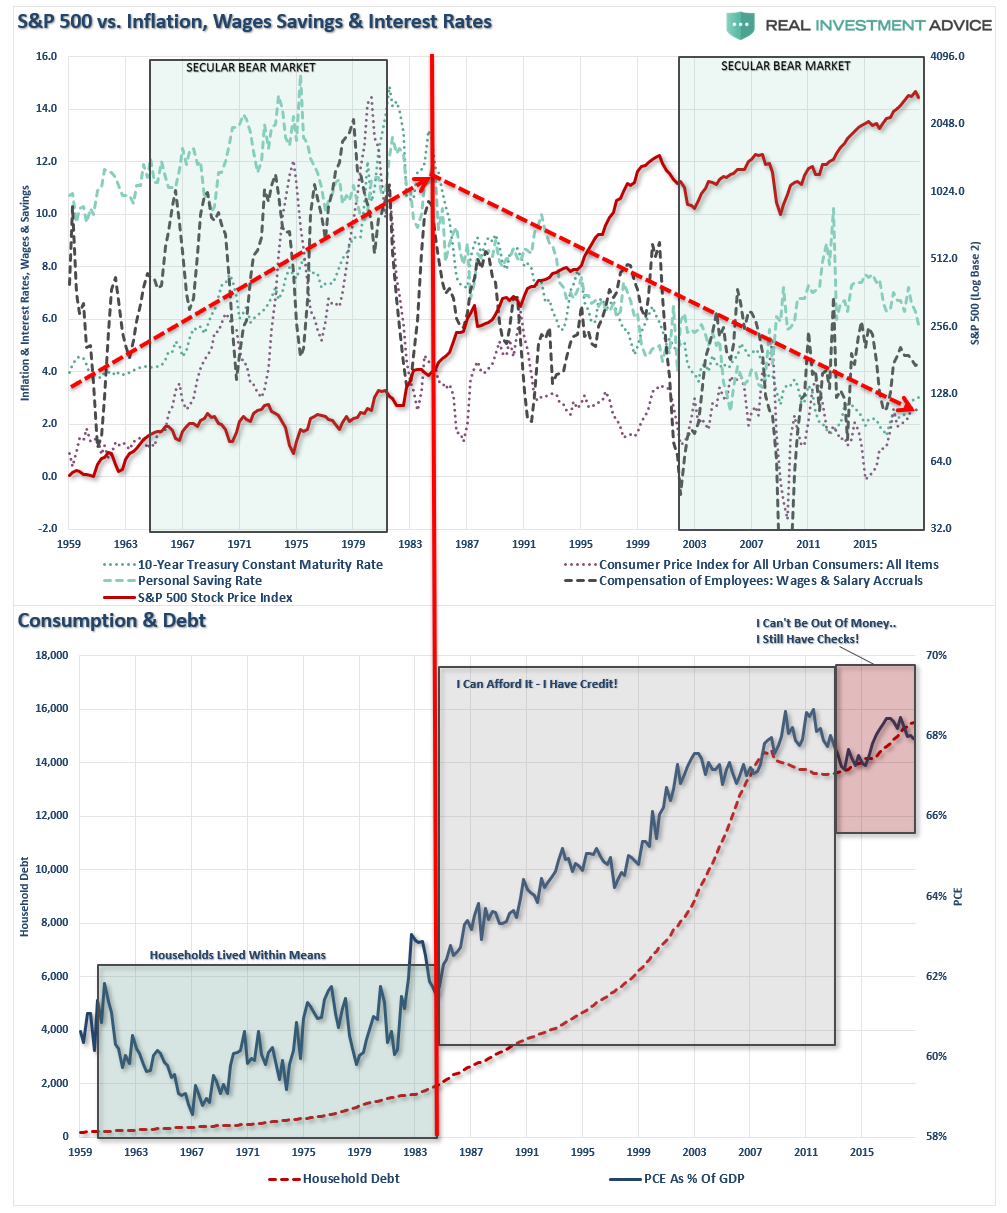
We can simplify this by overlaying debt versus the underlying economic variables.
この状況を債務と経済指標で重ねて示すこともできる。
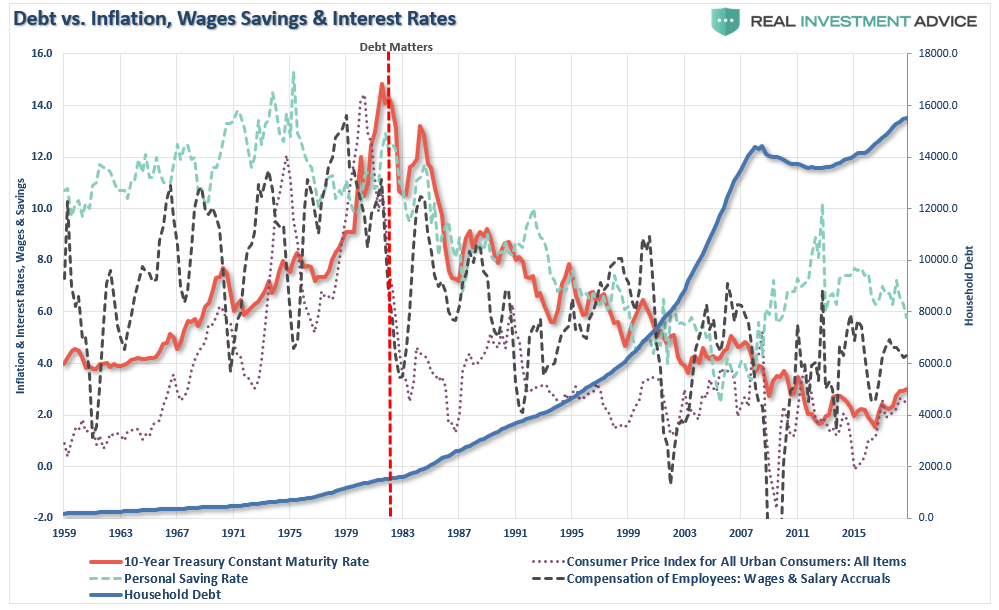
Currently, there is simply an inability to create the kind of debt-driven consumption growth seen during the ’80-’90s.
現在のところ、80年代−90年代のような債務主導の消費増加を望むことはまずできない。
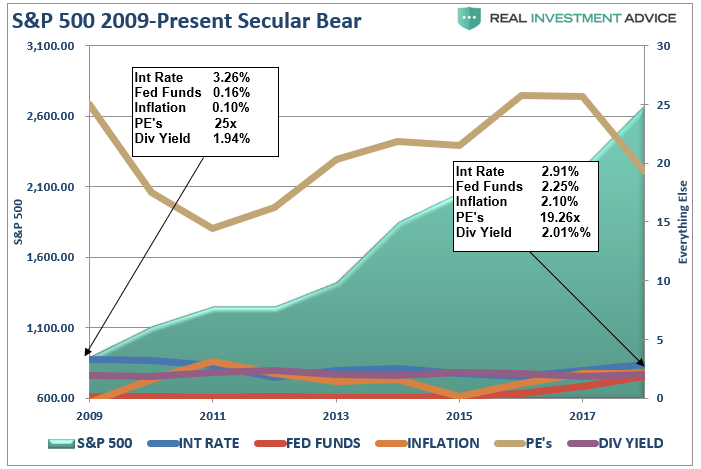
Despite much hope that the current breakout of the markets is the beginning of a new secular “bull” market – the economic and fundamental variables suggest otherwise. Valuations remain at very elevated levels which are the opposite of what has been seen previously. Interest rates, inflation, wages, and savings rates are all at historically low levels which are normally seen at the end of secular bull market periods, not the beginning of one.
現在の市場のブレークアウトが新たなsecular 「bull」相場の始まりであってほしいと多くの人が望むのは判るがーー経済やファンダメンタルズ変数が示唆するのはそうではない。バリュエーションはとても高いレベルにあり、以前に見られたものとは逆だ。金利、インフレ率、給与そして貯蓄率は歴史的に見て低いレベルであり、通常こういう状況はsecular bull相場の最後に見られるものだ、決して始まりではない。
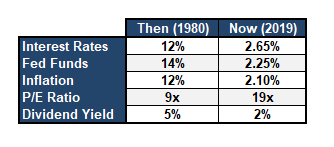
The table below shows the difference between 1980 and today.
下の表は1980年と現在を比べている。
Lastly, the consumer, the main driver of the economy, will not be able to again become a significantly larger chunk of the economy. With savings low, income growth weak and debt back at record levels, the fundamental capacity to re-leverage to similar extremes is no longer available.
最後に、経済を主導する消費、これが再び経済を大きく成長させる状況にはない。貯蓄率は低く、収入の伸びは弱い、そして債務は記録的なレベルに達している、当時と同様に再びレバレッジするファンダメンタルズ的な許容度はもはやない。
Let’s also not forget the singular most important fact.
もう一つもっとも大切な要因を忘れてはいけない。
The breakout of the markets in 2013 was not one based on organic economic fundamentals but rather through massive monetary interventions by Central Banks globally. The previous secular bull markets in our history we ones which were derived from extreme undervaluations, washed out financial markets, and extreme negative sentiment.
2013年に起きた相場のブレークアウトは有機的自然な経済ファンダメンタルズに基づいたものではない、そうではなく世界の中央銀行の巨額金融介入により生み出されたものだ。我々が歴史上これまで経験してきた secular bull 相場では、その始まりは極端な過小評価状態、金融市場との関連は薄く、そして極端なマイナス心理から生まれた。
Such is clearly not the case today.
現在、明らかにそのような状況には無い。
While stock prices can certainly be lofted higher by further monetary tinkering, the larger problem remains the inability for the economic variables to “replay the tape” of the ’80s and ’90s. At some point, the markets and the economy will have to process a “reset” to rebalance the financial equation.
さらなる金融操作で株価は確かにとても高いものだが、大きな問題は、各種経済指標は80年代、90年代の「テープを再現」することはできない。どこかの時点で、市場と経済は「リセット」プロセスが必要で、これにより金融環境をリバランスする。
However, it is precisely that reversion which will create the “set up” necessary to start the next great secular bull market. Unfortunately, as was seen at the bottom of the market in 1974, there will be few individual investors left to enjoy the beginning of that ride.
しかしながら、この反転が、次に起きる secular bull market を生み出すための「仕掛け」を作り出すものとなる。残念なことに、たとえば1974年の相場の底で見たように、この新たなブル相場の始まりに乗ることができる個人投資家はほとんどいないだろう。
つい最近、Raymond James社のJeff Sautがとても面白いことを言った、最近の相場下落に関してだ。
“Speaking to last week’s Dow Theory sell signal, we really cannot decide to ignore it, as we did with two previous false sell signals, or honor it because we continue to believe this is a secular bull market.”「先週のDow Theoryによる売りシグナルだが、私どもはこれを無視できるかどうか決めかねている、私どもはこれまで二回偽売りシグナルに遭遇した、というのも私どもは引き続きまだ長期的ブル相場の中にいると信じているからだ。」
It is an interesting point and one that has been prognosticate by several Wall Street analysts and bloggers in recent months like Josh Brown who recently penned:
これは興味深いことだ、Wall Streetのアナリストは度々こういう見解を示してきた、Josh Brownのようなブロガーもここ数ヶ月こういうふうに書いている:
“If Ari is correct, then we are currently enduring a cyclical bear market but the secular bull market that began in 2013 with fresh S&P 500 record highs is still intact.”「もしAriの主張が正しいなら、我々は現在長期的なベア相場に入っている、しかし2013年から始まった長期ブル相場はまだ生きておりS&P500の記録的高値はまだ有効だ。」
Here is the problem with the analysis.
これこそ分析結果の問題だ。
Secular markets, bull or bear, are not defined by price movements.
Secular markets 市場のサイクルは、ブルであれベアであれ単に株価動向だけで判断できない。
For example, if the market is down 20%, the technical definition of a “bear market”, then any rallies and subsequent declines that set new lows, are not defined as a “secular bear market.” It is just a “bear market” where prices are “trending” lower rather than “higher.”
たとえば、もし相場が20%下落したなら、テクニカル的な定義では「bear market」だ、こうなるとどのラリーとその後の下落は新安値と捉えられる、しかしこれは「secular bear market」と定義されるわけではない。これは単に「bear market」であり株価が「傾向」として安値にむかっているだけであり、「高値」にむかっているわけではないというだけだ。
What defines secular, or very long-term, markets are valuations.
とても長期的な市場のサイクルを決めるのはバリュエーションだ。
The chart below shows the history of secular bull market periods going back to 1871 using data from Dr. Robert Shiller. One thing you will notice is that secular bull markets tend to begin with valuations around 10x earnings and end at 23-25x earnings or greater. (Over the long-term valuations do matter.)
下のチャートは1871年まで遡るブル相場のサイクルを示している。ここでみなさんも気づくだろうが、secular bull 相場はバリエーションが10xPER程度から始まり23−25xPERで終わる。(長期的なバリュエーションが大切だ。)
But, here is the other problem I have with both Josh and Jeff’s thesis of a price based breakout defining a new secular “bull” market.
しかし、ここにもう一つ問題がある、JoshやJeffがテーマにしている株価のブレークアウトを元に定義する新たなsecular 「bull」相場だ。
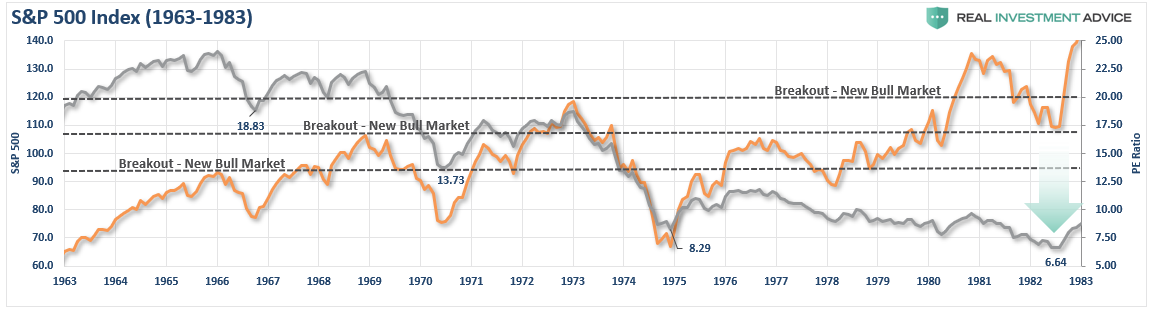
The chart below compares the last secular “bear” market that ran from 1963 to 1982 as compared the current cycle. Notice the chart for this previous period stops in 1973. I will show you the rest of this period in a moment. Also, importantly, note the level of valuations.
下のチャートは直近のsecluar 「bear」相場を示す、1963から1982のものだ、これを現在のサイクルと比べている。このチャートでは前回の期間を1973年で終わっていることに注意してほしい。残りも期間もすぐに示そう。それに加えて大切なのはバリュエーションのレベルだ。
What is important, besides the very similar pattern between the two periods, is the breakout in 1969 did not start a new “secular” bull market. Rather, it was a setup for the next major decline.
大切なことは、2つの期間のパターンはとても良く似ているが、1969年のブレークアウトは新たな「secular」bull 相場ではないということだ。むしろ、それは次の大きな下落の始まりだった。
“Okay, but the breakout in 1972 was surely the beginning of the new secular bull market – right?”「わかった、でも1972年のブレークアウトはたしかに新たな secular bull 相場の始まりだったよねーーそうだよね?」
Not so fast.
まあそう結論を急がないように。
The second breakout in 1972, like the previous, was the setup for the final market dive that reset valuation levels back to historic secular bear market lows. That crash also created the necessary extreme negative in investor psychology. The 1974 bear market low was also known as a “black bear market” as investors were so brutally ravaged they did not return to the markets in earnest until nearly two decades later.
1972年の二度目のブレークアウト、これも前回と同様で、これは最終的にバリュエーションをリセットするための仕掛けだった、歴史的な secular bear 相場安値に向かうものだった。この暴落は投資家心理を極端に落ち込ますものだった。1974年のベア相場安値は「black bear market」として知られ、投資家は極端にやつれきり株価が回復するまでに20年を要した。
As noted above, it is not just price action that denotes secular bull and bear market periods.
上にも書いたが、secular bull and bear を示すのは株価ではない。
It is valuations.
それはバリュエーションなのだ。
What drives long-term secular “bull” markets is “valuation expansion.” In order to have the magnitude of “valuation expansion” needed to support a secular “bull” market, you must both start at “under-valued” levels and have the economic factors and investor enthusiasm to support a return to “over-valued” levels.
長期的な secular 「bull」相場を駆動するものは「バリュエーションの拡大」だ。secular 「bull」相場を生み出す「バリュエーション拡大」にうまく乗るためには、皆さんは2つのことが必要だ、一つは「過小評価」された状態から相場に参入すること、そして経済的環境や投資家の熱狂で「過大評価」されるれべるまで持ち続けることだ。
The ability to have a “1982-2000 affair” is highly improbable. The 1982-2000 secular bull market cycle was driven primarily by a multiple expansion process which began with valuation levels of 5-7x earnings and a dividend yield of 5%. Interest rates and inflation were at extremely high levels and were at the beginning of a 40-year decline which would increase profitability as production and borrowing costs fell.
「1982−2000の出来事」が再現するのはほとんどありえない。1982−2000のseculare bull market cycle を生み出した主要因は、当初のバリュエーションが5-7xのPERと配当率5%から何倍にもなるプロセスを経たことだ。始まりの時点で金利とインフレは極端に高く、その後40年をかけて下落した、これが生産コスト債務コスト下落で利益を増やし続けた。
The first chart shows the secular bear market of the ’60s and ’70s with an overlay of valuations, dividends, interest rates and inflation.
下の最初のチャートは60年代70年代の secular bear market を示すもので、バリュエーション、配当、金利、そしてインフレ率を同時に示している。
You will notice that at the beginning of the bear market in the 60’s valuations were high while everything else was low. By the end of the secular period, these factors were reversed.
みなさんも気づくだろうが、60年代にベア相場の始まりではバリュエーションは高く、他はどれも低かった。このサイクルの最後までに、これらのよういんはどれも反転した。
Now, let’s juxtapose that previous period with the much beloved, and hoped for, secular bull market of the 1980s and ’90s.
ここで、皆がこれまで熱狂しこれからもそうであってほしいこれまでと比べてみよう、1980,1990年代の secular bull 相場だ。
There were several contributing factors that drove that particular secular bull market:
この secular bull 相場を生み出したいくつかの要因はこういうものだ:
- Inflation and interest rates were high and falling which boosted
corporate profitability and reduced discounting factors making the
value future earnings higher.
インフレと金利は当初高くこれが下落しつづけて企業収益を押し上げ、予想PERを高くした。 - The extreme negative sentiment of the late ’70s was finally
undone by the early ’90s. (At the turn of the century roughly 80% of all
individual investors in the market began investing after 1990. 80% of
that total started after 1995 due to the investing innovations created
by the Internet. The majority of these were “boomers.”)
70年代遅くの極端にマイナスな心理が90年代初頭にはとうとう終わった。(世紀の変わり目の個人投資家の約80%は1990年以降に市場に参入した。またさらにこのうちの80%は1995年以降にインターネットの普及で参入した。これらの多くは「団塊の世代」だった。) - Large foreign net inflows to chase the “tech boom” drove prices to extreme levels.
「テックブーム」にのって海外から多額の資金が流入し、株価が極端なレベルになった。 - The mirage of consumer wealth, driven by declining inflation and
interest rates and easy access to credit, inflated consumption,
corporate profits, and economic growth.
消費者資産の蜃気楼、これを生み出したのはインフレと金利の低下そして容易な消費者ローンへのアクセスだ、これが消費、企業収益そして経済成長を膨れ上がらせた。 - Corporate profits were boosted by the deregulation of industries, wage suppression, outsourcing, and productivity increases.
規制緩和、給与抑制、アウトソース、そして生産性改善が企業収益を押し上げた。 - Pension funding requirements and accounting standards were eased which increased corporate profits.
年金基金の要求そして会計基準緩和が企業収益を増やした。 - Stock-based executive compensation was grossly expanded which led to more “accounting gimmickry” to sustain stock price levels.
役員報酬のうち株価依存部分が増え、これがより積極的な「会計操作」を生み出し株高を生み出した。
下の2枚のチャートが経済的ファンダメンタルズとS&P500を示す、そして1983年に変化が起きたことを示している。(赤線で分離している)
We can simplify this by overlaying debt versus the underlying economic variables.
この状況を債務と経済指標で重ねて示すこともできる。
Currently, there is simply an inability to create the kind of debt-driven consumption growth seen during the ’80-’90s.
現在のところ、80年代−90年代のような債務主導の消費増加を望むことはまずできない。
Despite much hope that the current breakout of the markets is the beginning of a new secular “bull” market – the economic and fundamental variables suggest otherwise. Valuations remain at very elevated levels which are the opposite of what has been seen previously. Interest rates, inflation, wages, and savings rates are all at historically low levels which are normally seen at the end of secular bull market periods, not the beginning of one.
現在の市場のブレークアウトが新たなsecular 「bull」相場の始まりであってほしいと多くの人が望むのは判るがーー経済やファンダメンタルズ変数が示唆するのはそうではない。バリュエーションはとても高いレベルにあり、以前に見られたものとは逆だ。金利、インフレ率、給与そして貯蓄率は歴史的に見て低いレベルであり、通常こういう状況はsecular bull相場の最後に見られるものだ、決して始まりではない。
The table below shows the difference between 1980 and today.
下の表は1980年と現在を比べている。
Lastly, the consumer, the main driver of the economy, will not be able to again become a significantly larger chunk of the economy. With savings low, income growth weak and debt back at record levels, the fundamental capacity to re-leverage to similar extremes is no longer available.
最後に、経済を主導する消費、これが再び経済を大きく成長させる状況にはない。貯蓄率は低く、収入の伸びは弱い、そして債務は記録的なレベルに達している、当時と同様に再びレバレッジするファンダメンタルズ的な許容度はもはやない。
Let’s also not forget the singular most important fact.
もう一つもっとも大切な要因を忘れてはいけない。
The breakout of the markets in 2013 was not one based on organic economic fundamentals but rather through massive monetary interventions by Central Banks globally. The previous secular bull markets in our history we ones which were derived from extreme undervaluations, washed out financial markets, and extreme negative sentiment.
2013年に起きた相場のブレークアウトは有機的自然な経済ファンダメンタルズに基づいたものではない、そうではなく世界の中央銀行の巨額金融介入により生み出されたものだ。我々が歴史上これまで経験してきた secular bull 相場では、その始まりは極端な過小評価状態、金融市場との関連は薄く、そして極端なマイナス心理から生まれた。
Such is clearly not the case today.
現在、明らかにそのような状況には無い。
While stock prices can certainly be lofted higher by further monetary tinkering, the larger problem remains the inability for the economic variables to “replay the tape” of the ’80s and ’90s. At some point, the markets and the economy will have to process a “reset” to rebalance the financial equation.
さらなる金融操作で株価は確かにとても高いものだが、大きな問題は、各種経済指標は80年代、90年代の「テープを再現」することはできない。どこかの時点で、市場と経済は「リセット」プロセスが必要で、これにより金融環境をリバランスする。
However, it is precisely that reversion which will create the “set up” necessary to start the next great secular bull market. Unfortunately, as was seen at the bottom of the market in 1974, there will be few individual investors left to enjoy the beginning of that ride.
しかしながら、この反転が、次に起きる secular bull market を生み出すための「仕掛け」を作り出すものとなる。残念なことに、たとえば1974年の相場の底で見たように、この新たなブル相場の始まりに乗ることができる個人投資家はほとんどいないだろう。


Lance Roberts is a Chief Portfolio Strategist/Economist for Clarity Financial. He is also the host of “The Lance Roberts Podcast” and Chief Editor of the “Real Investment Advice” website and author of “Real Investment Daily” blog and “Real Investment Report“. Follow Lance on Facebook, Twitter, Linked-In and YouTube
2019/01/07