不可抗力が不動の目標に遭遇
Authored by Lance Roberts via RealInvestmentAdvice.com,

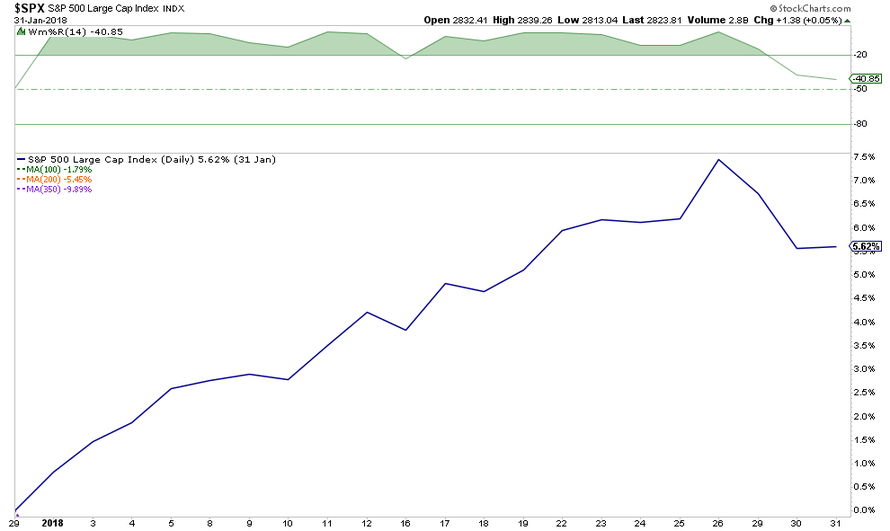
Since the day after Christmas, the markets have been in a surge very similar to what we saw in January of 2018.
クリスマス以来、市場は急騰し、2018年1月と状況は似ている。
Here is January 2018
これは2018年1月のチャートだ
And 2019
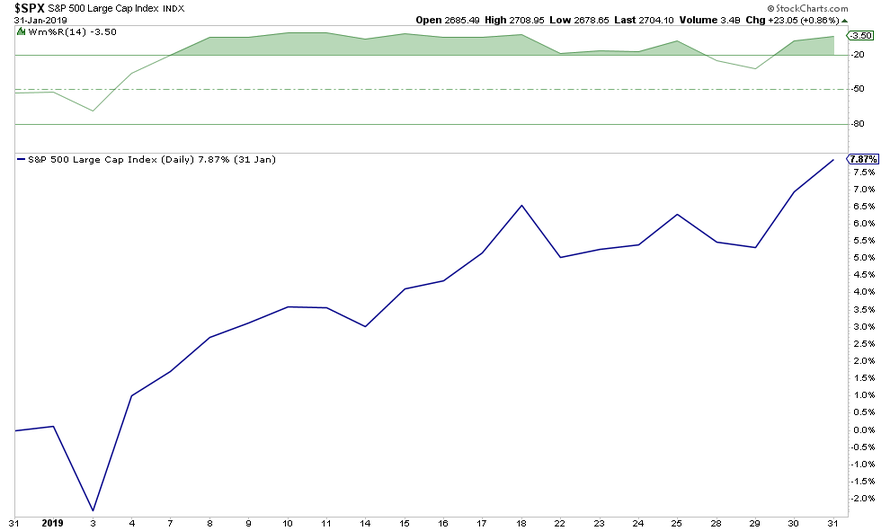
Of course, in February 2018, the rally ended.
よくご存知の通り、2018年2月にはラリーが終わった。
While I am not suggesting that the markets are about to suffer a 10% correction, I am suggesting, as I wrote this past week, is that the markets have been “Too Fast & Too Furious.”
私は相場が10%の調整になると示唆しているわけでh内、私が示唆するのは、先週書いたことだが、市場の動きが「あまりに速く&あまりに乱暴だ」ということだ。
「短期的なテクニカル指標を見ると極端な売られすぎから極端な買われ過ぎに転換した。」

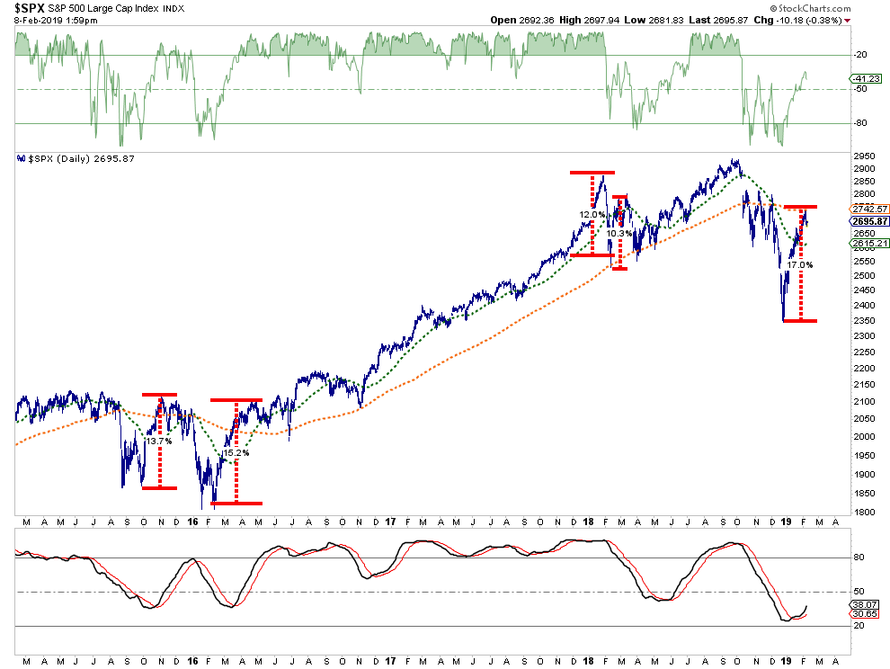
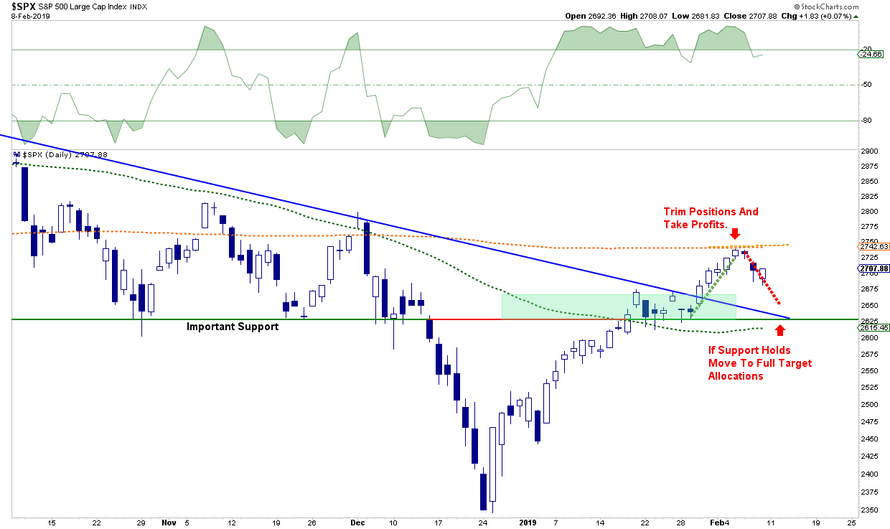
As we have discussed previously, price movements are very much confined by the “physics” of technicals. A couple of weeks ago, we drew out what we expected to be the movement over the market over the next couple of weeks.
We said then the most likely target for the rally was the 200-dma. It was essentially the level at which the “irresistible force would meet the immovable object.”
私どもが以前に議論したことだが、株価の動きはテクニカルの「原則」そのままだ。2週間前に、私どもはその後2週間に予想されることを書いた。私どもはもっともらしい株価目標は200日移動平均だと言った。これは基本的にこういうことだ「不可抗力が不動物体に遭遇」するようなものだ。
The chart below is updated through Friday afternoon:
下のチャートは金曜午後に改定したものだ:

As noted, we lifted profits at the 200-dma and added hedges to the Equity and Equity Long/Short portfolios. (If you are reading this as a non-RIA PRO subscriber you can see our 3-live portfolios at the site use code PRO30 for a 30-day free trial.)
下記示したとおり、私どもは200日移動平均で利益確定し株式ヘッジを加えた、さらに株式のLong/Short ポジションを加えた。(RIAPROを購読せずこの記事を読んでいないなら、私どもの3つのlive portfolioを無料確認できる、code PRO30を利用すると30日間無料購読できる。)
What will be critically important now is for the markets to retest and hold support at the Oct-Nov lows which will coincide with the 50-dma. A failure of that level will likely see a retest of the 2018 lows.
いまとても大切なことは、市場は10月ー11月の安値サポートを再度試していることだ、これは50日移動平均とも重なる。これに失敗すると2018年の安値を試すことになる。
A retest of those lows, by the way, is not an “outside chance.” It is actually a fairly high possibility. A look back at the 2015-2016 correction makes the case for that fairly clearly.
これらの安値を試すからといって「大きなチャンス」があるわけではない。実際その可能性は高い。2015−2016の調整を見るとよく分かる。
But even if a retest of lows doesn’t happen, you should be aware that sharp market rallies are not uncommon, but almost always have a subsequent retracement.
しかし、たとえ安値を試すことが起きなくとも、市場の急激なラリーは一般的でないことに気づくべきだ、そうではなく、殆どの場合その後の後退が起きている。
The point here is that the move off of the December lows is likely now complete, for now.
大切なことは、12月安値からの動きは終わったとみられることだ、少なくともいまのところ。
Thomas Thornton from Hedge Fund Telemetry had a great note out this past week on this point.
Hedge Fund Telemetry のThomas Thorntonが素晴らしい記事を書いた、先週の相場に関してだ。
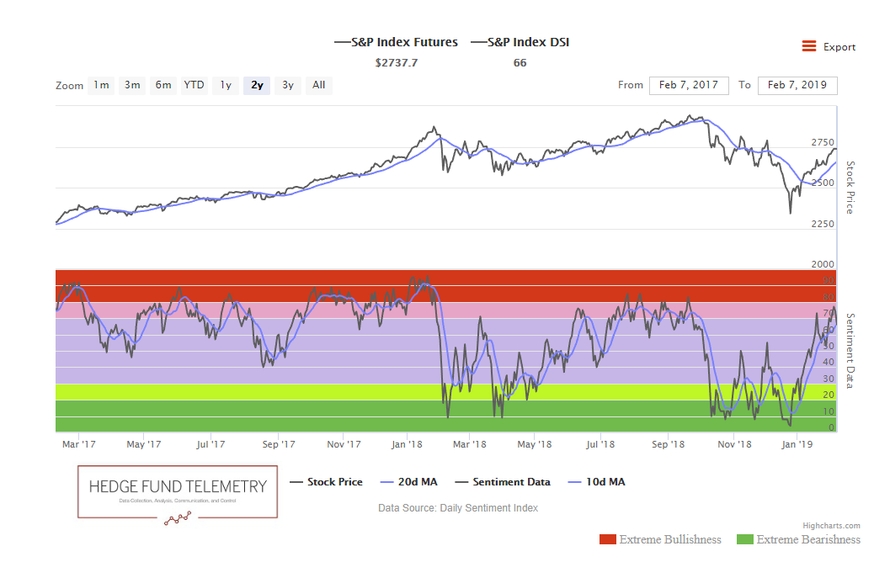
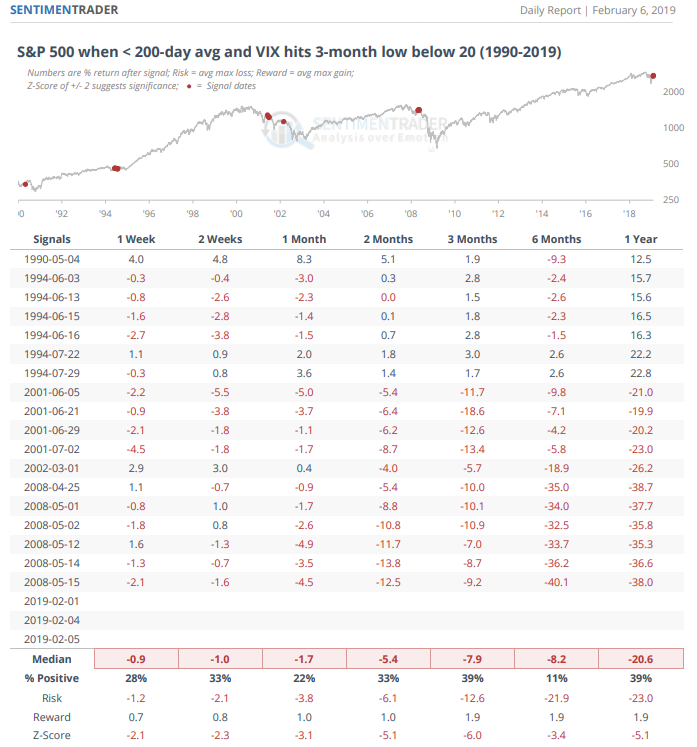
Sentimentrader also recently noted market performance when the VIX hits a 3 month low with the S&P under the 200 day. Performance is very negative going forward.
Sentimentrader は最近市場パフォーマンスに関して書いている、VIXが3ヶ月ぶりの安値でS&Pga200日移動平均より低い時だ。こういうときにはその後のパフォーマンスはとてもネガティブなものだ。
私どもが火曜に書いたとおり、注意すべきことがたくさんある。見てみよう:

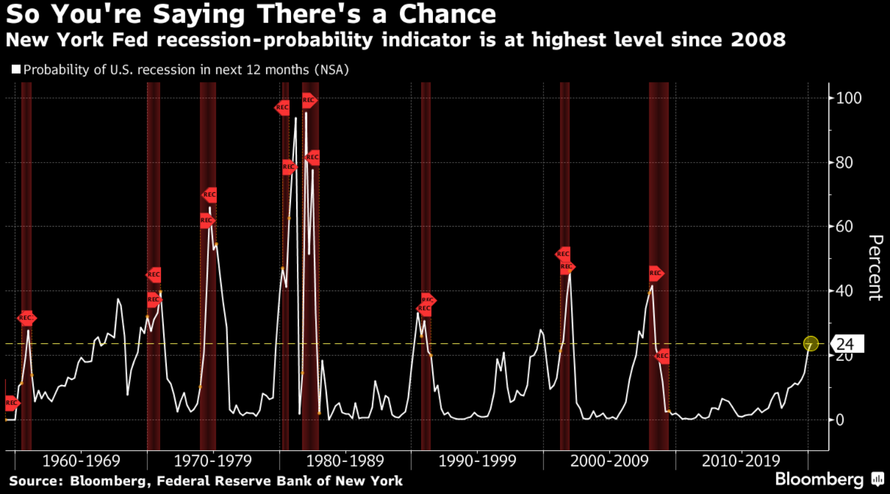
「景気後退リスク」はもはや存在しないというコメントも散見されるが、各種指標ではリスクは更に高まっていることを示唆している。New York FED景気後退指数は2008年以来で今や最高だ。

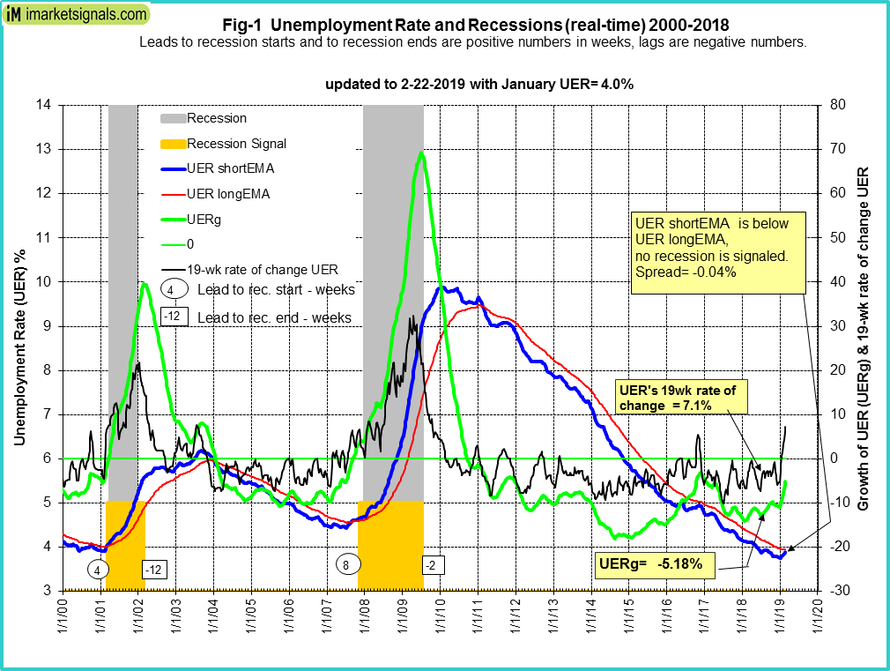
Also, as noted by George Vrba recently, the unemployment rate may also be warning of a recession as well.
Geroge Vrbaが最近記事にしたが、失業率も景気後退シグナルとなるかもしれない。
「景気の遅れ指標であるが、失業率は景気後退の始まりと終わりを示唆するとても優れた指標だ。このモデルは、1948年までさかのぼって確認することができる、信頼できる景気後退シグナルだ。
The point here is that ignoring the “risks” leaves you “exposed.” If you think its going to rain, you carry an umbrella.
現時点では「リスク」を無視して「露出」を放置している。もし雨が振りそうだと思うと、傘を手にすることになる。
This is why we recently raised cashed and added hedges to portfolios – just in case it rains. And, right now, it seems to be sprinkling a bit. As John Murphy via StockCharts.com noted on Friday:
これこそが、最近私どもはキャッシュポジションを増やした理由だそしてポートフォリオのヘッジを加えたーーちょうど雨に備えるように。そして今丁度、降り始めたように見える。金曜にStockCharts.comのJohn Murphyはこう書いた:
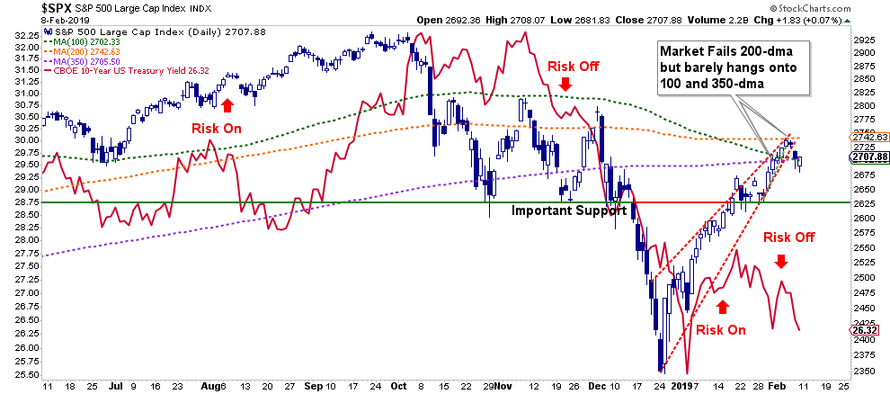
However, one of the biggest “warning flags” we are watching currently, and why we have taken a more cautious stance in portfolios, is because “bonds ain’t buyin’ it.”
しかしながら、私どもが現在注視している最大の「警告フラッグ」、そしてどうして我々がポートフォリオに慎重であるかというと、「債権を見ると買いではない」ということだ。
As shown in the chart below, the market has not only broken out of its rising wedge, but yields have been dropping sharply as “risk on” is rotating to “risk off.”
下のチャートを見てほしいが、市場は上昇三角持ち合いが壊れたところであるだけでなく、金利は急落しており、「リスクオン」から「リスクオフ」に急変している。

While the bulls clearly took charge of the market in late December, the question is whether or not they can maintain control.
ブルは明らかに12月遅くに優勢となっており、問題はそれをコントロールできるかできないかだ。
The weight of macro-evidence is going to weigh on the markets sooner than later which is why we are opting to hedge risk and hold on to higher levels of cash currently.
市場では時間と共にマクロデータが重みを増してくる、だからこそ私どもはリスクヘッジを重視しているわけで現在キャッシュポジションを増やしている。
The rally we discussed on December 25th, has hit all of our targets, and then some.
私どもが12月25日に議論したラリーはすでにすべての目標を達成しており、残っているとしても僅かだ。
Don’t be greedy.
決して強欲になってはいけない。

Since the day after Christmas, the markets have been in a surge very similar to what we saw in January of 2018.
クリスマス以来、市場は急騰し、2018年1月と状況は似ている。
Here is January 2018
これは2018年1月のチャートだ


Of course, in February 2018, the rally ended.
よくご存知の通り、2018年2月にはラリーが終わった。
While I am not suggesting that the markets are about to suffer a 10% correction, I am suggesting, as I wrote this past week, is that the markets have been “Too Fast & Too Furious.”
私は相場が10%の調整になると示唆しているわけでh内、私が示唆するのは、先週書いたことだが、市場の動きが「あまりに速く&あまりに乱暴だ」ということだ。
“Short-term technical indicators also show the violent reversion from extreme oversold conditions back to extreme overbought.”
「短期的なテクニカル指標を見ると極端な売られすぎから極端な買われ過ぎに転換した。」
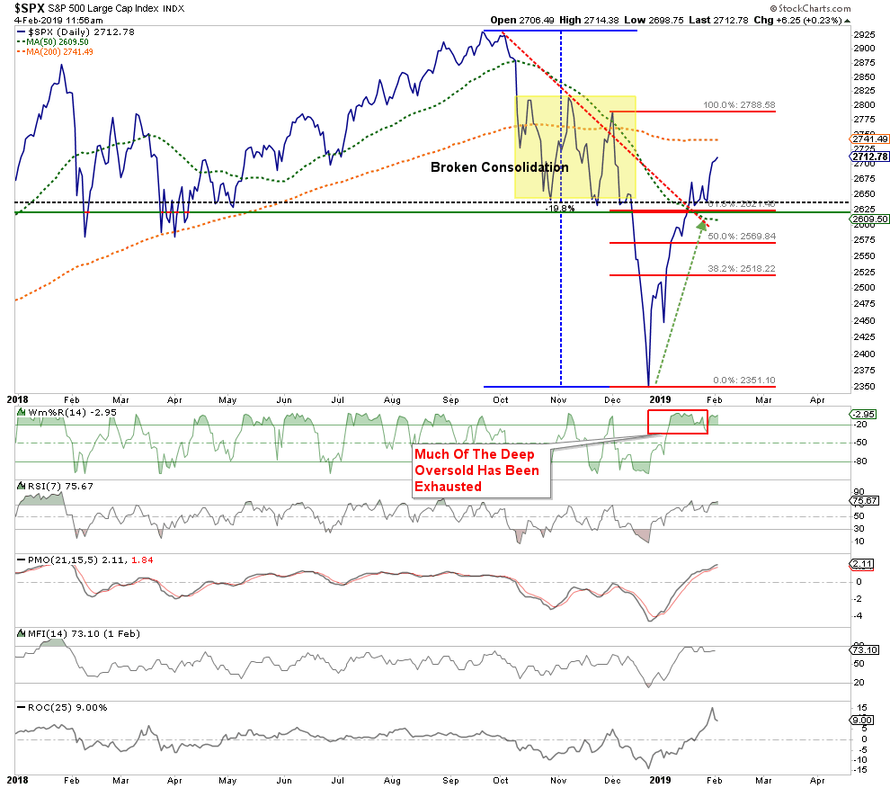
As we have discussed previously, price movements are very much confined by the “physics” of technicals. A couple of weeks ago, we drew out what we expected to be the movement over the market over the next couple of weeks.
We said then the most likely target for the rally was the 200-dma. It was essentially the level at which the “irresistible force would meet the immovable object.”
私どもが以前に議論したことだが、株価の動きはテクニカルの「原則」そのままだ。2週間前に、私どもはその後2週間に予想されることを書いた。私どもはもっともらしい株価目標は200日移動平均だと言った。これは基本的にこういうことだ「不可抗力が不動物体に遭遇」するようなものだ。
The chart below is updated through Friday afternoon:
下のチャートは金曜午後に改定したものだ:
下記示したとおり、私どもは200日移動平均で利益確定し株式ヘッジを加えた、さらに株式のLong/Short ポジションを加えた。(RIAPROを購読せずこの記事を読んでいないなら、私どもの3つのlive portfolioを無料確認できる、code PRO30を利用すると30日間無料購読できる。)
What will be critically important now is for the markets to retest and hold support at the Oct-Nov lows which will coincide with the 50-dma. A failure of that level will likely see a retest of the 2018 lows.
いまとても大切なことは、市場は10月ー11月の安値サポートを再度試していることだ、これは50日移動平均とも重なる。これに失敗すると2018年の安値を試すことになる。
A retest of those lows, by the way, is not an “outside chance.” It is actually a fairly high possibility. A look back at the 2015-2016 correction makes the case for that fairly clearly.
これらの安値を試すからといって「大きなチャンス」があるわけではない。実際その可能性は高い。2015−2016の調整を見るとよく分かる。

But even if a retest of lows doesn’t happen, you should be aware that sharp market rallies are not uncommon, but almost always have a subsequent retracement.
しかし、たとえ安値を試すことが起きなくとも、市場の急激なラリーは一般的でないことに気づくべきだ、そうではなく、殆どの場合その後の後退が起きている。
The point here is that the move off of the December lows is likely now complete, for now.
大切なことは、12月安値からの動きは終わったとみられることだ、少なくともいまのところ。
Thomas Thornton from Hedge Fund Telemetry had a great note out this past week on this point.
Hedge Fund Telemetry のThomas Thorntonが素晴らしい記事を書いた、先週の相場に関してだ。
“The strong move off the lows in December is complete. As you have seen I’ve moved from a very high exposure level of 90% net long from mid December to now net short. Various internals are overbought, sentiment is back in the elevated zone, and price targets have been achieved. There have been 45 new DeMark sell signals and only 2 buy signals so far in February. Recall in December there were 225 buy signals and 25 sell signals which had an average gain together of 11.5% since. In January there were 72 total signals with the majority 53 sells/19 buys with only a gain of 0.5% since. It’s telling me a shift is coming and that’s lower. How low? As of now, I’m not saying new lows but higher lows but that could change if some Trend Factor levels break and we see downside Countdowns start.”「12月の安値からの動きは終わった。みなさんもご存知の通り、12月半ばからの90%ネットロングはいまやネットショートになっている。 各種指標は買われ過ぎで、心理はまた過熱側に戻った、そして株価目標は達成された。2月になり、売りシグナルは45、書いシグナルはわずか2つだ。12月を思い起こしてほしい、当時225の買いシグナルと25の売りシグナルだった、結果として11.5%のゲインを得た。1月には53の売り/19の買いシグナルで上昇はわずか0.5%だった。これを見るとシフトが起きている、安値へとだ。どこまで下がるか?今の所、私は新安値ではなく highre lows と思う、しかしTrend Factorレベルが破られ下落Countdownsが始まると状況は変わるだろう。」

Sentimentrader also recently noted market performance when the VIX hits a 3 month low with the S&P under the 200 day. Performance is very negative going forward.
Sentimentrader は最近市場パフォーマンスに関して書いている、VIXが3ヶ月ぶりの安値でS&Pga200日移動平均より低い時だ。こういうときにはその後のパフォーマンスはとてもネガティブなものだ。

Signs Of Caution 注意すべき兆候
As we noted last Tuesday, there are a litany of things that are worth paying attention to. To wit:私どもが火曜に書いたとおり、注意すべきことがたくさんある。見てみよう:
“It is too early to suggest the “bear market of 2018” is officially over.「「2018年発のベア相場」は公式に終わった、と示唆するには早すぎる。しかし、このラリーは単に「早すぎ、乱暴すぎる、」 背景となるファンダメンタルズは悪化しておりこれと全く乖離している:」
But, the rally has simply been “Too Fast, Too Furious,” completely discounting the deteriorating fundamental underpinnings:”
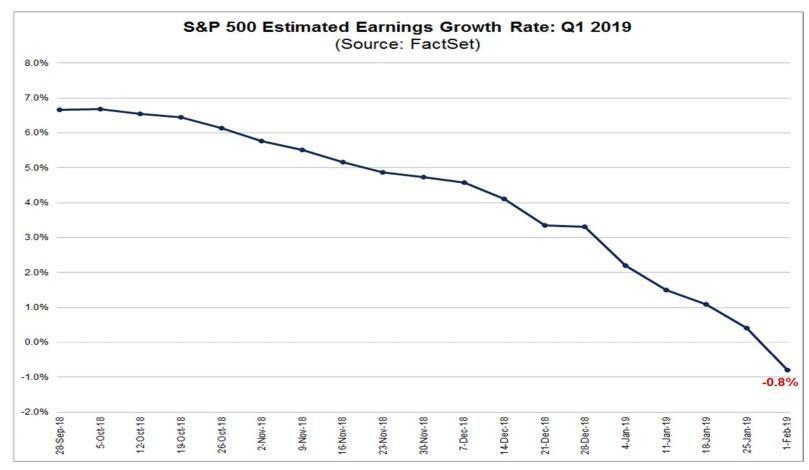
- Earnings estimates for
2019 have sharply collapsed as I previously stated they would and still
have more to go. In fact, as of now, the consensus estimates are
suggesting the first year-over-year decline since 2016.
2019年の収益予想は急速に下落しており、私が以前にも述べたが、これはさらに悪化するだろう。実際、今の所、市場コンセンサスでみて2016年以来初めてYoYで下落している。
-
Stock market targets for 2019 are way too high as well.
2019の株価目標はあまりに高すぎる。 -
Despite the Federal Reserve turning more dovish verbally, they
DID NOT say they actually WOULD pause their rate hikes or stop reducing
their balance sheet.
FEDは乱暴にハト派に転換したが、彼らは実際に金利引き上げを止めるとは言っていないしバランスシート縮小を止めるとも言っていない。
-
Larry Kudlow said the U.S. and China are still VERY far apart on trade.
Larry Kudlowによると米中貿易協議はまだ大きく乖離している。
-
Trump has postponed his meeting with President Xi which puts the market at risk of higher tariffs.
トランプは習近平との会談を延期した、これは関税引き上げのリスクを伴う。
-
There is a decent probability the U.S. Government winds up getting shut down again after next week over “border wall” funding.
少ないながらも来週まだ政府閉鎖の可能性は残る、「壁建設」資金を巡ってだ。
-
The effect of the tax cut legislation has disappeared as year-over-year comparisons are reverting back to normalized growth rates.
減税法案効果はもう無くなった、YoYでの比較は通常の成長速度に戻っている。
-
Economic growth is slowing as previously stated.
経済成長は鈍化している。
-
Chinese economic has weakened further since our previous note.
これまでの私どもの記事に書いたが、中国経済はさらに弱体化している。
-
European growth, already weak, will likely struggle as well.
欧州成長もすでに弱まった、今後も格闘が続くだろう。
-
Valuations remain expensive
バリュエーションは高いままだ
「景気後退リスク」はもはや存在しないというコメントも散見されるが、各種指標ではリスクは更に高まっていることを示唆している。New York FED景気後退指数は2008年以来で今や最高だ。
Also, as noted by George Vrba recently, the unemployment rate may also be warning of a recession as well.
Geroge Vrbaが最近記事にしたが、失業率も景気後退シグナルとなるかもしれない。
“For what is considered to be a lagging indicator of the economy, the unemployment rate provides surprisingly good signals for the beginning and end of recessions. This model, backtested to 1948, reliably provided recession signals.
「景気の遅れ指標であるが、失業率は景気後退の始まりと終わりを示唆するとても優れた指標だ。このモデルは、1948年までさかのぼって確認することができる、信頼できる景気後退シグナルだ。
The model, updated with the January 2019 rate of 4.0%, does not signal a recession. However, if the unemployment rate should rise to 4.1% in the coming months the model would then signal recession.”このモデルは、2019年1月に改定され4.0%だった、まだ景気後退を発していない。しかしながら、もし失業率が今後数ヶ月で4.1%まで上昇すると 、このモデルは景気後退シグナルとなる。」

The point here is that ignoring the “risks” leaves you “exposed.” If you think its going to rain, you carry an umbrella.
現時点では「リスク」を無視して「露出」を放置している。もし雨が振りそうだと思うと、傘を手にすることになる。
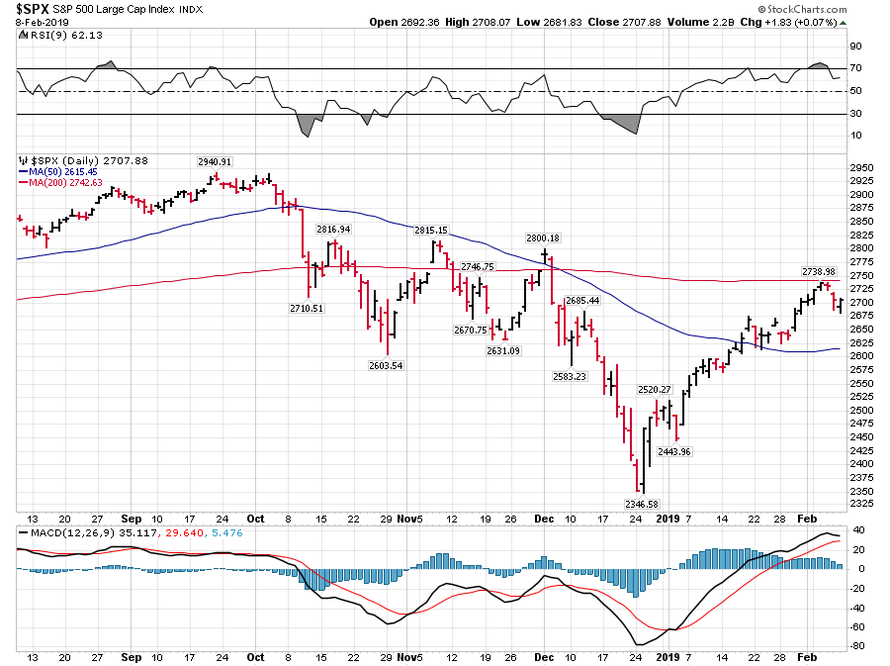
This is why we recently raised cashed and added hedges to portfolios – just in case it rains. And, right now, it seems to be sprinkling a bit. As John Murphy via StockCharts.com noted on Friday:
これこそが、最近私どもはキャッシュポジションを増やした理由だそしてポートフォリオのヘッジを加えたーーちょうど雨に備えるように。そして今丁度、降り始めたように見える。金曜にStockCharts.comのJohn Murphyはこう書いた:
“It looks like the 200-day averages that we’ve all been watching have managed to contain the 2019 rally. Chart 1 shows the S&P 500 pulling back from that red overhead resistance line. That’s not too surprising considering the steepness of the recent rally which put stock indexes in a short-term overbought condition. The upper box in Chart 1 shows the more sensitive 9-day RSI line falling to the lowest level in a month after reaching overbought territory above 70. That also shows loss of upside momentum. The lower box shows daily MACD lines in danger of turning negative for the first time in a month. All of which suggests that the early 2019 stock rally has failed its first attempt to regain its 200-day moving average.”「我々が注目していた200日移動平均は2019のラリーで守られた。チャート1に示すが、S&P500は赤線の抵抗線で引き戻した。最近のラリーは乱暴すぎて短期的には買われすぎだったのでこれは驚くことではない。チャート1の上部に示すのは9日RSIだ、これがひと月前には下落していたが、今では70を超える買われすぎ状態になっている。ということは上昇モメンタムが失われたことを示す。下部に示すのは日足MACDだ、これがこのひと月で初めてマイナスになりそうだ。これらのことを勘案すると、2019年はじめの株式ラリーは200日移動平均越えに失敗した。」

However, one of the biggest “warning flags” we are watching currently, and why we have taken a more cautious stance in portfolios, is because “bonds ain’t buyin’ it.”
しかしながら、私どもが現在注視している最大の「警告フラッグ」、そしてどうして我々がポートフォリオに慎重であるかというと、「債権を見ると買いではない」ということだ。
As shown in the chart below, the market has not only broken out of its rising wedge, but yields have been dropping sharply as “risk on” is rotating to “risk off.”
下のチャートを見てほしいが、市場は上昇三角持ち合いが壊れたところであるだけでなく、金利は急落しており、「リスクオン」から「リスクオフ」に急変している。
While the bulls clearly took charge of the market in late December, the question is whether or not they can maintain control.
ブルは明らかに12月遅くに優勢となっており、問題はそれをコントロールできるかできないかだ。
The weight of macro-evidence is going to weigh on the markets sooner than later which is why we are opting to hedge risk and hold on to higher levels of cash currently.
市場では時間と共にマクロデータが重みを増してくる、だからこそ私どもはリスクヘッジを重視しているわけで現在キャッシュポジションを増やしている。
The rally we discussed on December 25th, has hit all of our targets, and then some.
私どもが12月25日に議論したラリーはすでにすべての目標を達成しており、残っているとしても僅かだ。
Don’t be greedy.
決して強欲になってはいけない。


