収益祭りは終わる:Q1収益成長は急落、この3年で最大の下落
After
last week's earnings deluge, 46% of the companies in the S&P 500
have now reported actual results for Q4 2018. And according to Factset data,
so far earnings season is mediocre at best with the percentage of
companies reporting EPS above estimates (70%) below the 5-year average.
Companies are also reporting earnings that are 3.5% above the estimates,
which is also below the 5-year average. The silver
lining is that in terms of revenues, the percentage of companies
reporting actual revenues above estimates (62%) is above the 5-year
average, and on aggregate, companies are reporting revenues that are
0.8% above the estimates, which is also above the 5-year average.
先週は収益開示が最も多く、S&P500構成銘柄の46%が2018Q4決算を開示した。Factset dataによると、収益はあまり芳しくなかった、EPSが予想を上回る銘柄(70%)は過去5年平均を下回った。収益予想を3.5%以上上回る銘柄数は過去5年平均を下回った。売上をめぐり確実なことは、売上予想を上回る名画rの割合(62%)は5年平均をうわ待っていた、そして相対的に見て、報告された売上は予想を0.8%上回っていた、これは過去5年平均を上回る。
Separately, the blended year-over-year earnings growth rate for the fourth quarter is 12.4% today, which while is above the earnings growth rate of 10.9% last week, if well below the Q3 earnings growth, with positive earnings surprises reported by companies in multiple sectors - led by the Energy sector - responsible for the increase in the earnings growth rate during the week.
これとは別に、今の所YoYでQ4収益成長は12.4%だ、この値は先週の利益成長率10.9%を上回るが、もしQ3収益成長を下回るなら、いくつかのセクターで予想収益を上回っておりーーエネルギーセクターが先導しーー先週の収益成長率増加によるものだ。
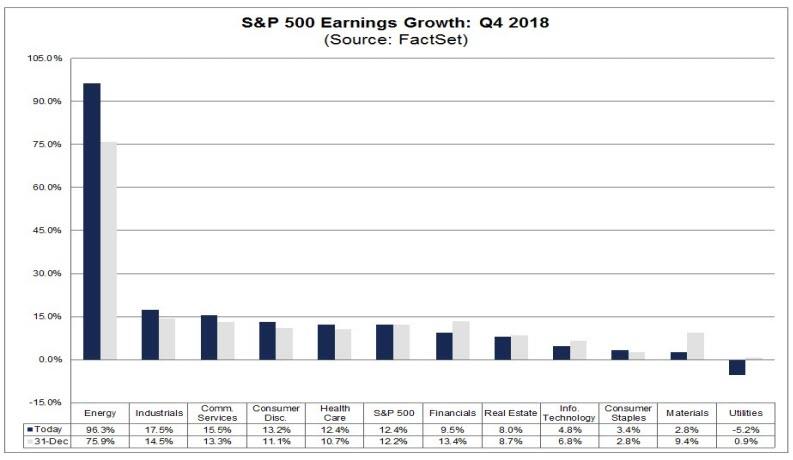
While hardly a disaster, if 12.4% is the actual growth rate for the quarter, it would mark the first time the index has not reported earnings growth above 20% since Q4 2017 according to Factset. However, it will also mark the fifth straight quarter of double-digit earnings growth for the index (although this is unlikely to persist, see below). Ten of the eleven sectors are reporting year-over-year earnings growth. As shown in the chart above, five sectors are reporting double-digit earnings growth, led by the Energy, Industrials, and Communication Services sectors.
ひどいとまでは言わないが、もしQ4成長率が実際に12.4%なら、2017Q4以来初めて成長率が20%を超えなかったことになる。しかしながら、5四半期連続で二桁の収益増加である(これがずっと続くとは思えない、下のチャート参照)。11セクターの内10セクターはYoY収益成長を報告している。上のチャートで解るが、5つのセクターは2桁の収益成長で、エネルギー、産業そして通信サービスセクターだ。
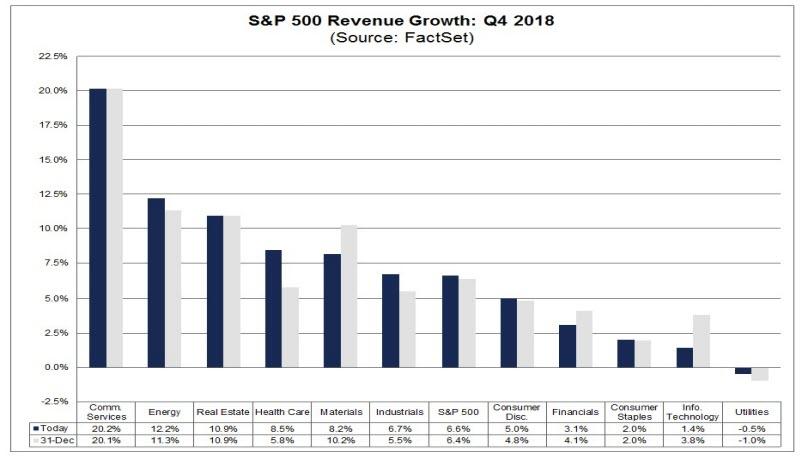
Looking at the top line, the blended, year-over-year revenue growth
rate for the fourth quarter is 6.6% today, which is above the revenue
growth rate of 6.2% last week. Positive revenue surprises reported by
companies in multiple sectors (led by the Health Care sector) were responsible for the increase in the revenue growth
rate during the week. Ten of the eleven sectors are reporting
year-over-year growth in revenues. Three sectors are reporting
double-digit growth in revenues: Communications Services, Energy, and
Real Estate.
売上を見る限りまちまちだ、Q4のYoY売上成長率はいまのところ6.6%であり、先週時点での6.2%を上回っている。予想を上回る売上となるセクターも複数あり(主要なのはヘルスケアー)今週の開示によるものだ。11セクターの内10セクターでYoY売上成長を報告している。3セクターでは二桁の売上増加となる:コミュニケーションサービス、エネルギそして不動産。
Some more key metrics on Q4 earnings season courtesy of Factset:
FactsetによるとQ4決算の特徴は以下のようなものだ:
というわけでネットで見ると、決算は一般的に予想通りだ。
これは良いニュースだ。
The bad news is that while companies are still reporting generally
strong earnings, the good days are about to end with a bang as a result
of the recent barrage in profit warnings and negative preannouncements,
first and foremost starting with Apple, which issued a shocking guidance
cut one month ago for the first time since 2001.
悪いニュースは、企業は一般的に強い収益を報告しているが、良い日々も終わろうとしている、最近の収益警告とマイナス事前警告の多発だ、第一にApple,当社はひと月前に驚きのガイダンスを出した、2001年以来のことだ。
As a result, during January, analysts lowered earnings estimates for companies in the S&P 500 for the first quarter, and the Q1 bottom-up EPS estimate dropped by 4.1% (to $38.55 from $40.21) during this period.
結果として、1月において、アナリストはS&P500のQ1収益予想を下げている、そして各社報告からの積み上げQ1予想EPSは4.1%減った($40.21から$38.55へ)、このひと月のことだ。
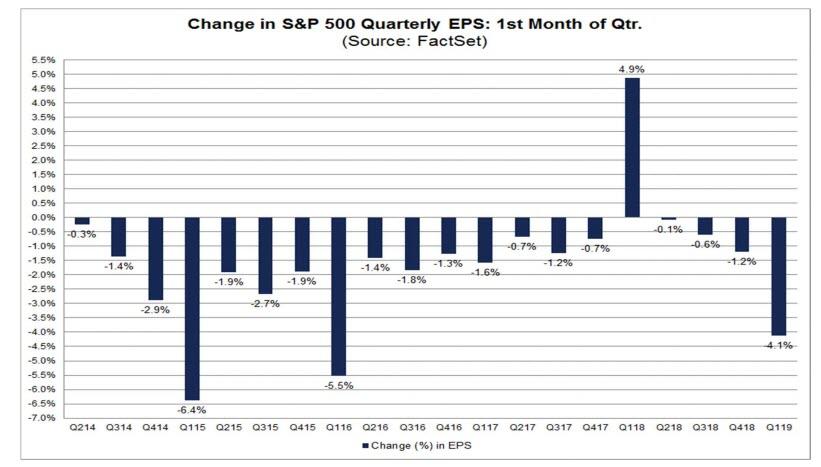
How significant is a 4.1% decline in the bottom-up EPS estimate during the first month of a quarter? How does this decrease compare to recent quarters? Here are some troubling answers from FactSet which notes that during the past five years (20 quarters), the average decline in the bottom-up EPS estimate during the first month of a quarter has been 1.6%.
四半期の始まりひと月で積み上げEPS予想が4.1%減ることがどれだけ深刻なことか。最近の四半期と較べるとこれが如何に下落していることか。ここに示すがFactSetによるとその答えが如何に困ったことかが解る、過去5年(20四半期)をみて、最初のひと月で積み上げEPS予想の平均下落は1.6%だった。
During the past ten years, (40 quarters), the average decline in the
bottom-up EPS estimate during the first month of a quarter has been
1.8%. During the past fifteen years, (60 quarters), the average decline
in the bottom-up EPS estimate during the first month of a quarter has
been 1.7%. Thus, the decline in the bottom-up EPS estimate recorded
during the first month of the first quarter was larger than the 5-year,
10-year, and 15-year averages.
過去10年(40四半期)を振り返り、四半期の最初のひと月での積み上げEPS下落予想平均は1.8%だった。過去15年(60四半期)では1.7%下落だった。しかるに、今回の最初のひと月の積み上げEPS下落予想は過去5年、10年、15年の平均よりも悪いものだ。
In fact, the first quarter marked the largest decline in the bottom-up EPS estimate during the first month of a quarter since Q1 2016 (-5.5%). At the sector level, all eleven sectors recorded a decline in their bottom-up EPS estimate during the first month of the quarter, led by the Energy (-22.5%) and Information Technology (-7.3%) sectors. Overall, seven sectors recorded a larger decrease in their bottom-up EPS estimate relative to their 5-year average and their 10-year average for the first month of a quarter.
実際、この四半期初月の積み上げEPS予想の下落は2016年Q1(−5.5%)以来のものだ。セクターレベルで見ると、11セクター全てで初月積み上げEPS予想は下落している、大きいのはエネルギ(−22.5%)そしてインフォメーションテクノロジ(−7.3)セクタだ。全体的に見て、7セクタが5年平均と10年平均よりも悪いものだった。
What is striking is just how fast Q1 earnings have been slashed lower, with the S&P expected to post a 3.3% growth as recently as Dec 31, a number which is now down to -0.8%, as consensus for the first time expects Q1 EPS to post an annual decline due to downward revisions to EPS estimates during the month.
以下に打撃を受けているかと言うとQ1収益が急速に悪化しているかで解る、12月31日時点ではS&P500の予想は3.3%の成長だった、一方で今やこの数値が−0.8%の下落となっている、初月のEPS予想下方修正で、Q1EPSは年率で下落することが市場コンセンサスとなっている。
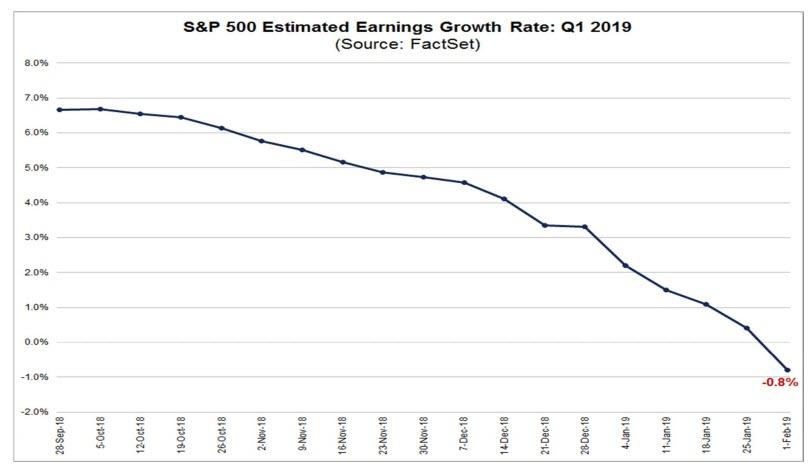
The collapse is even more pronounced if one extend the period under observation: on September 30, the estimated earnings growth rate for Q1 2019 was 6.7%. On December 31, the estimated earnings growth rate for Q1 2019 was 3.3%. Six of the eleven sectors are now predicted to report a decrease in earnings for the first quarter, curiously led by the Information Technology (-8.9%) sector which until recently had been the fastest growing sector for years.
急落はもっと目立つものだ、観測期間を延長してみれば:9月30日時点では2019Q1の予想収益は6.7%だった10月31日には2019Q1の予想収益成長は3.3%だった。11セクターの内6セクターが今やQ1の収益下落予想を開示している、奇妙なことだが、これまで長年最速の成長を誇ってきたインフォメーションテクノロジ(−8.9%)が先導を切っている。
And, as noted above, if the index reports an actual decline in earnings for the first quarter, it will mark the first year-over-year decline in earnings since Q2 2016 (-3.1%).
そして、上にも書いたが、もしこの指数が実際に収益減少となる四半期を迎えるとするなら、2016Q2(−3.1%)以来のYoY下落となる。

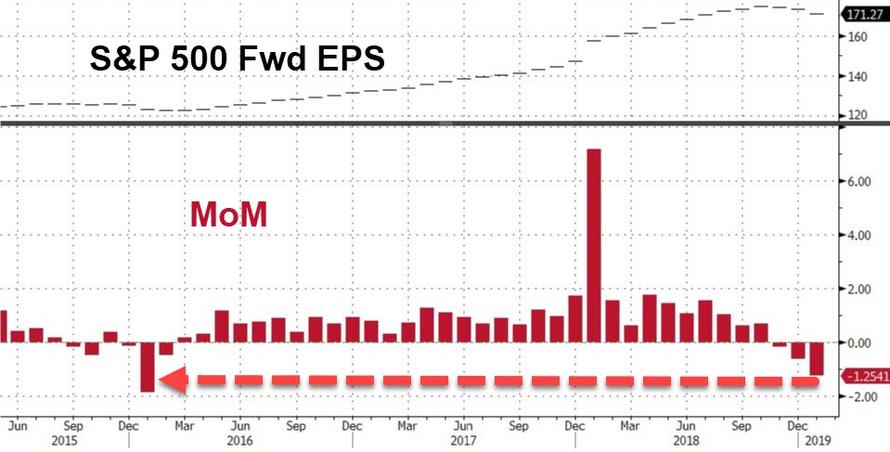
Furthermore, the after peaking in October, forward EPS for 2019 has been declining ever since and in January recorded its biggest sequential decline since January 2016.
更に言うと、10月の天井後、2019フォワードEPSはずっと下がりっぱなしで1月の値は2016年1月以来の大きな下落となる。
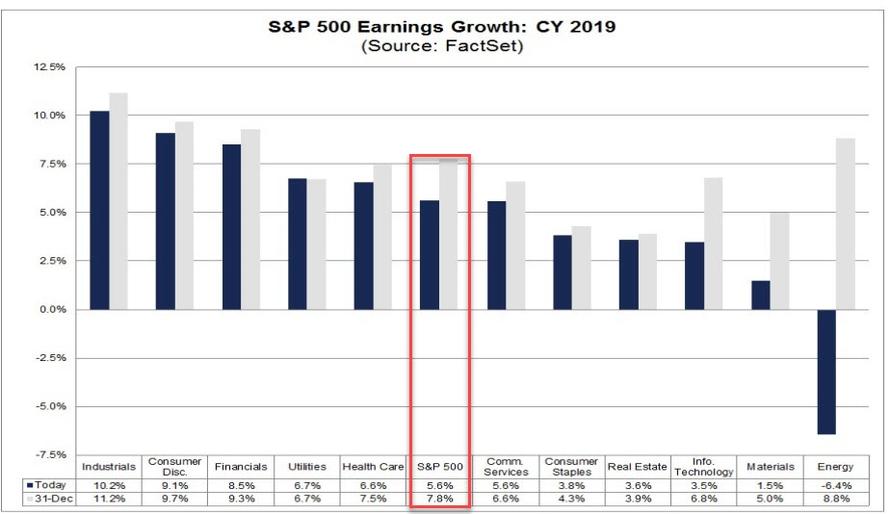
What about beyond Q1, which is now expected to be the first quarter since 2016 to post negative earnings growth? Well after the earnings decline in Q1 2019 analysts now expected - at best - low, single-digit growth in earnings in Q2 2019 and Q3 2019. For Q1 2019, analysts are projecting a decline in earnings (-0.8%) and revenue growth of 5.7%.
Q1以降はどうなるだろう?、いまのところQ1は2016年以来のマイナス収益成長が予想されているが。2019Q1の下落につづきアナリストは現在こう予想しているーー最善でーー低いものだ、2019Q2,Q3は一桁成長と見ている。2019Q1に関して、アナリストは収益下落(−0.8%)と5.7%の売上増を見ている。
ちなみに、2019通年のEPS5.6%成長はすでに12月31日のEPS7.8%を30%ヘアカットしている・・・そしてまだ年明けひと月しかたっていないのだ。
What does all of this mean for stocks?
一体全体これらの状況が株式にどう影響するか?
Well, the current consensus year-end target price for the S&P 500 is 3044.19, which is 12.6% above the closing price of 2704.10. At the sector level, the Energy (+18.8%) sector is expected to see the largest price increase, as this sector has the largest upside difference between the bottom-up target price and the closing price. On the other hand, the Utilities (+1.8%) sector is expected to see the smallest price increase, as this sector has the smallest upside difference between the bottom-up target price and the closing price.
そう、現在の年末S&P500指数目標は3044.19だ、これは現在の終値2704.10よりも12.6%高い。セクターレベルで議論すると、エネルギ(+18.8%)セクタはもっとも株価増加が期待されている、このセクターは積み上げ目標価格と終値の乖離が最も大きい。一方でユーティリティ(+1.8%)セクタは増加が最も小さいと期待される、このセクターは積み上げ目標価格と終値の差が最も小さい。
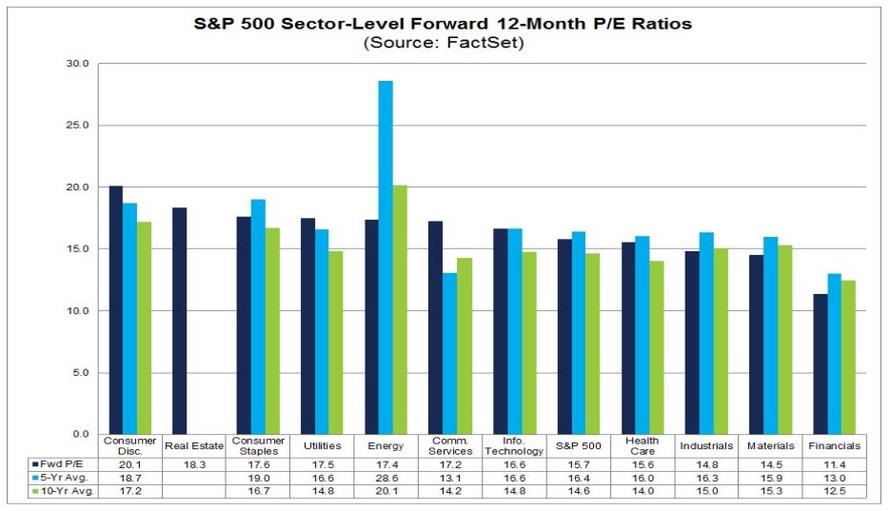
Meanwhile, from a valuation standpoint, the forward 12-month P/E ratio - assuming 2019 EPS grows 5.6% Y/Y - is 15.7x. This P/E ratio is below the 5-year average of 16.4 but above the 10-year average of 14.6. It is also above the forward 12-month P/E ratio of 14.4 recorded at the end of the fourth quarter (December 31). Since the end of the fourth quarter (December 31), the price of the index has increased by 7.9%, while the forward 12-month EPS estimate has decreased by 1.1%.
それと同時に、バリュエーションを見ると、フォワード12か月PERーー2019EPS成長がYoYで5.6%とするとーーは15.7xだ。このPERは5年平均の16.4y利も低く10年平均14.6よりも大きい。この値は12月31日の値14.4よりも大きい。12月31日以来この指数は7.9%上昇した、一方でフォワード12か月EPSは1.1%下落している。

At the sector level, the Consumer Discretionary (20.1) sector has the highest forward 12-month P/E ratio, while the Financials (11.4) sector has the lowest forward 12-month P/E ratio.
セクターレベルでは、裁量消費(20.1)セクターは最も高いフォワード12か月PERだ、一方金融(11.4)セクターは最も低い。
Finally, as clearly shown in the chart beow, the only reason stocks have surged nearly 15% from their mini bear market lows on Dec 24 is due to multiple expansion, as Forward EPS have continued to decline, however the Fed's dovish reversal has been quite successful in boosting forward PE multiples.
最後に、下のチャートを見れば明らかだが、12月24日のミニベアとも見られる安値から株価は15%も急騰した唯一の理由はPERの乗数拡大だ、フォーワードEPSは引き続き下落し続けている、しかしながらFEDのハト派反転はフォワードPE乗数拡大にうまく成功している。

As the chart above clearly shows, the Fed's dovish flip has made earnings largely irrelevant for the market's near term direction, as Powell's stated intent to pause hiking and ostensibly slow the Fed's balance sheet shrinkage has taken priority over everything else. In any case, now that Q4 earning session is over the hump, during the upcoming week, 103 S&P 500 companies (including 1 Dow 30 component) are scheduled to report results for the fourth quarter. Expect even more market upside irrelevant of what historicals companies report or what guidance they deliver.
上のチャートを見れば明らかだが、FEDのハト派反転は収益は主に市場の短期的な動向とは無関係だということを示している、Powellが述べたが、何にも増して金利引き上げ中断とFEDバランスシート縮小の鈍化を優先するという。何はともあれ、今やいまQ4決算は来週で山場を迎える、S&P500の内103銘柄がQ4決算開示予定だ。過去の決算開示やガイダンスはどうあれ、さらなる相場の上昇を期待するが良い。
先週は収益開示が最も多く、S&P500構成銘柄の46%が2018Q4決算を開示した。Factset dataによると、収益はあまり芳しくなかった、EPSが予想を上回る銘柄(70%)は過去5年平均を下回った。収益予想を3.5%以上上回る銘柄数は過去5年平均を下回った。売上をめぐり確実なことは、売上予想を上回る名画rの割合(62%)は5年平均をうわ待っていた、そして相対的に見て、報告された売上は予想を0.8%上回っていた、これは過去5年平均を上回る。
Separately, the blended year-over-year earnings growth rate for the fourth quarter is 12.4% today, which while is above the earnings growth rate of 10.9% last week, if well below the Q3 earnings growth, with positive earnings surprises reported by companies in multiple sectors - led by the Energy sector - responsible for the increase in the earnings growth rate during the week.
これとは別に、今の所YoYでQ4収益成長は12.4%だ、この値は先週の利益成長率10.9%を上回るが、もしQ3収益成長を下回るなら、いくつかのセクターで予想収益を上回っておりーーエネルギーセクターが先導しーー先週の収益成長率増加によるものだ。

While hardly a disaster, if 12.4% is the actual growth rate for the quarter, it would mark the first time the index has not reported earnings growth above 20% since Q4 2017 according to Factset. However, it will also mark the fifth straight quarter of double-digit earnings growth for the index (although this is unlikely to persist, see below). Ten of the eleven sectors are reporting year-over-year earnings growth. As shown in the chart above, five sectors are reporting double-digit earnings growth, led by the Energy, Industrials, and Communication Services sectors.
ひどいとまでは言わないが、もしQ4成長率が実際に12.4%なら、2017Q4以来初めて成長率が20%を超えなかったことになる。しかしながら、5四半期連続で二桁の収益増加である(これがずっと続くとは思えない、下のチャート参照)。11セクターの内10セクターはYoY収益成長を報告している。上のチャートで解るが、5つのセクターは2桁の収益成長で、エネルギー、産業そして通信サービスセクターだ。
売上を見る限りまちまちだ、Q4のYoY売上成長率はいまのところ6.6%であり、先週時点での6.2%を上回っている。予想を上回る売上となるセクターも複数あり(主要なのはヘルスケアー)今週の開示によるものだ。11セクターの内10セクターでYoY売上成長を報告している。3セクターでは二桁の売上増加となる:コミュニケーションサービス、エネルギそして不動産。

Some more key metrics on Q4 earnings season courtesy of Factset:
FactsetによるとQ4決算の特徴は以下のようなものだ:
- Earnings Revisions: On December 31, the
estimated earnings growth rate for Q4 2018 was 12.2%. Six sectors have
higher growth rates today (compared to December 31) due to upward
revisions to EPS estimates and positive EPS surprises.
収益改定:12月31日には、2018Q4収益成長予想は12.2%だった。現在、6セクターが12月31日にくらべてEPSの上方修正をしている、予想を上回るものだ。 - Earnings Guidance: For Q1 2019, 33 S&P 500
companies have issued negative EPS guidance and 9 S&P 500 companies
have issued positive EPS guidance.
収益予想:2019Q1に関しS&P500の33銘柄はEPS減少ガイダンスを出した、そして9銘柄がプラスEPSガイダンスを出した。 - Valuation: The forward 12-month P/E ratio for the
S&P 500 is 15.7. This P/E ratio is below the 5-year average (16.4)
but above the 10-year average (14.6).
バリュエーション:フォワード12ヶ月PERは15.7だ。このPERは5年平均を下回る(16.4)が10年平均を上回る(14.6)
というわけでネットで見ると、決算は一般的に予想通りだ。
これは良いニュースだ。
悪いニュースは、企業は一般的に強い収益を報告しているが、良い日々も終わろうとしている、最近の収益警告とマイナス事前警告の多発だ、第一にApple,当社はひと月前に驚きのガイダンスを出した、2001年以来のことだ。
As a result, during January, analysts lowered earnings estimates for companies in the S&P 500 for the first quarter, and the Q1 bottom-up EPS estimate dropped by 4.1% (to $38.55 from $40.21) during this period.
結果として、1月において、アナリストはS&P500のQ1収益予想を下げている、そして各社報告からの積み上げQ1予想EPSは4.1%減った($40.21から$38.55へ)、このひと月のことだ。

How significant is a 4.1% decline in the bottom-up EPS estimate during the first month of a quarter? How does this decrease compare to recent quarters? Here are some troubling answers from FactSet which notes that during the past five years (20 quarters), the average decline in the bottom-up EPS estimate during the first month of a quarter has been 1.6%.
四半期の始まりひと月で積み上げEPS予想が4.1%減ることがどれだけ深刻なことか。最近の四半期と較べるとこれが如何に下落していることか。ここに示すがFactSetによるとその答えが如何に困ったことかが解る、過去5年(20四半期)をみて、最初のひと月で積み上げEPS予想の平均下落は1.6%だった。
過去10年(40四半期)を振り返り、四半期の最初のひと月での積み上げEPS下落予想平均は1.8%だった。過去15年(60四半期)では1.7%下落だった。しかるに、今回の最初のひと月の積み上げEPS下落予想は過去5年、10年、15年の平均よりも悪いものだ。
In fact, the first quarter marked the largest decline in the bottom-up EPS estimate during the first month of a quarter since Q1 2016 (-5.5%). At the sector level, all eleven sectors recorded a decline in their bottom-up EPS estimate during the first month of the quarter, led by the Energy (-22.5%) and Information Technology (-7.3%) sectors. Overall, seven sectors recorded a larger decrease in their bottom-up EPS estimate relative to their 5-year average and their 10-year average for the first month of a quarter.
実際、この四半期初月の積み上げEPS予想の下落は2016年Q1(−5.5%)以来のものだ。セクターレベルで見ると、11セクター全てで初月積み上げEPS予想は下落している、大きいのはエネルギ(−22.5%)そしてインフォメーションテクノロジ(−7.3)セクタだ。全体的に見て、7セクタが5年平均と10年平均よりも悪いものだった。
What is striking is just how fast Q1 earnings have been slashed lower, with the S&P expected to post a 3.3% growth as recently as Dec 31, a number which is now down to -0.8%, as consensus for the first time expects Q1 EPS to post an annual decline due to downward revisions to EPS estimates during the month.
以下に打撃を受けているかと言うとQ1収益が急速に悪化しているかで解る、12月31日時点ではS&P500の予想は3.3%の成長だった、一方で今やこの数値が−0.8%の下落となっている、初月のEPS予想下方修正で、Q1EPSは年率で下落することが市場コンセンサスとなっている。

The collapse is even more pronounced if one extend the period under observation: on September 30, the estimated earnings growth rate for Q1 2019 was 6.7%. On December 31, the estimated earnings growth rate for Q1 2019 was 3.3%. Six of the eleven sectors are now predicted to report a decrease in earnings for the first quarter, curiously led by the Information Technology (-8.9%) sector which until recently had been the fastest growing sector for years.
急落はもっと目立つものだ、観測期間を延長してみれば:9月30日時点では2019Q1の予想収益は6.7%だった10月31日には2019Q1の予想収益成長は3.3%だった。11セクターの内6セクターが今やQ1の収益下落予想を開示している、奇妙なことだが、これまで長年最速の成長を誇ってきたインフォメーションテクノロジ(−8.9%)が先導を切っている。
And, as noted above, if the index reports an actual decline in earnings for the first quarter, it will mark the first year-over-year decline in earnings since Q2 2016 (-3.1%).
そして、上にも書いたが、もしこの指数が実際に収益減少となる四半期を迎えるとするなら、2016Q2(−3.1%)以来のYoY下落となる。

Furthermore, the after peaking in October, forward EPS for 2019 has been declining ever since and in January recorded its biggest sequential decline since January 2016.
更に言うと、10月の天井後、2019フォワードEPSはずっと下がりっぱなしで1月の値は2016年1月以来の大きな下落となる。

What about beyond Q1, which is now expected to be the first quarter since 2016 to post negative earnings growth? Well after the earnings decline in Q1 2019 analysts now expected - at best - low, single-digit growth in earnings in Q2 2019 and Q3 2019. For Q1 2019, analysts are projecting a decline in earnings (-0.8%) and revenue growth of 5.7%.
Q1以降はどうなるだろう?、いまのところQ1は2016年以来のマイナス収益成長が予想されているが。2019Q1の下落につづきアナリストは現在こう予想しているーー最善でーー低いものだ、2019Q2,Q3は一桁成長と見ている。2019Q1に関して、アナリストは収益下落(−0.8%)と5.7%の売上増を見ている。
- For Q2 2019, analysts are projecting earnings growth of 1.6% and revenue growth of 5.1%.
2019Q2に対し、アナリストは収益成長1.6%と売上成長5.1%を予想。 - For Q3 2019, analysts are projecting earnings growth of 2.7% and revenue growth of 4.9%.
2019Q3に対し、アナリストは収益成長2.7%、売上成長4.9%を予想。 - For Q4 2019, analysts are projecting earnings growth of 9.9% and revenue growth of 6.0%.
2019Q4に対し、アナリストは収益成長9.9%、売上成長6.0%を予想。 - For CY 2019, analysts are projecting earnings growth of 5.6% and revenue growth of 5.3%.
2019暦年に対し、アナリストは収益成長5.6%、売上成長5.3%を予想。
ちなみに、2019通年のEPS5.6%成長はすでに12月31日のEPS7.8%を30%ヘアカットしている・・・そしてまだ年明けひと月しかたっていないのだ。

What does all of this mean for stocks?
一体全体これらの状況が株式にどう影響するか?
Well, the current consensus year-end target price for the S&P 500 is 3044.19, which is 12.6% above the closing price of 2704.10. At the sector level, the Energy (+18.8%) sector is expected to see the largest price increase, as this sector has the largest upside difference between the bottom-up target price and the closing price. On the other hand, the Utilities (+1.8%) sector is expected to see the smallest price increase, as this sector has the smallest upside difference between the bottom-up target price and the closing price.
そう、現在の年末S&P500指数目標は3044.19だ、これは現在の終値2704.10よりも12.6%高い。セクターレベルで議論すると、エネルギ(+18.8%)セクタはもっとも株価増加が期待されている、このセクターは積み上げ目標価格と終値の乖離が最も大きい。一方でユーティリティ(+1.8%)セクタは増加が最も小さいと期待される、このセクターは積み上げ目標価格と終値の差が最も小さい。
Meanwhile, from a valuation standpoint, the forward 12-month P/E ratio - assuming 2019 EPS grows 5.6% Y/Y - is 15.7x. This P/E ratio is below the 5-year average of 16.4 but above the 10-year average of 14.6. It is also above the forward 12-month P/E ratio of 14.4 recorded at the end of the fourth quarter (December 31). Since the end of the fourth quarter (December 31), the price of the index has increased by 7.9%, while the forward 12-month EPS estimate has decreased by 1.1%.
それと同時に、バリュエーションを見ると、フォワード12か月PERーー2019EPS成長がYoYで5.6%とするとーーは15.7xだ。このPERは5年平均の16.4y利も低く10年平均14.6よりも大きい。この値は12月31日の値14.4よりも大きい。12月31日以来この指数は7.9%上昇した、一方でフォワード12か月EPSは1.1%下落している。

At the sector level, the Consumer Discretionary (20.1) sector has the highest forward 12-month P/E ratio, while the Financials (11.4) sector has the lowest forward 12-month P/E ratio.
セクターレベルでは、裁量消費(20.1)セクターは最も高いフォワード12か月PERだ、一方金融(11.4)セクターは最も低い。

Finally, as clearly shown in the chart beow, the only reason stocks have surged nearly 15% from their mini bear market lows on Dec 24 is due to multiple expansion, as Forward EPS have continued to decline, however the Fed's dovish reversal has been quite successful in boosting forward PE multiples.
最後に、下のチャートを見れば明らかだが、12月24日のミニベアとも見られる安値から株価は15%も急騰した唯一の理由はPERの乗数拡大だ、フォーワードEPSは引き続き下落し続けている、しかしながらFEDのハト派反転はフォワードPE乗数拡大にうまく成功している。

As the chart above clearly shows, the Fed's dovish flip has made earnings largely irrelevant for the market's near term direction, as Powell's stated intent to pause hiking and ostensibly slow the Fed's balance sheet shrinkage has taken priority over everything else. In any case, now that Q4 earning session is over the hump, during the upcoming week, 103 S&P 500 companies (including 1 Dow 30 component) are scheduled to report results for the fourth quarter. Expect even more market upside irrelevant of what historicals companies report or what guidance they deliver.
上のチャートを見れば明らかだが、FEDのハト派反転は収益は主に市場の短期的な動向とは無関係だということを示している、Powellが述べたが、何にも増して金利引き上げ中断とFEDバランスシート縮小の鈍化を優先するという。何はともあれ、今やいまQ4決算は来週で山場を迎える、S&P500の内103銘柄がQ4決算開示予定だ。過去の決算開示やガイダンスはどうあれ、さらなる相場の上昇を期待するが良い。


