According to Fathom Consulting,
a global independent macro research consultancy, it's proprietary China
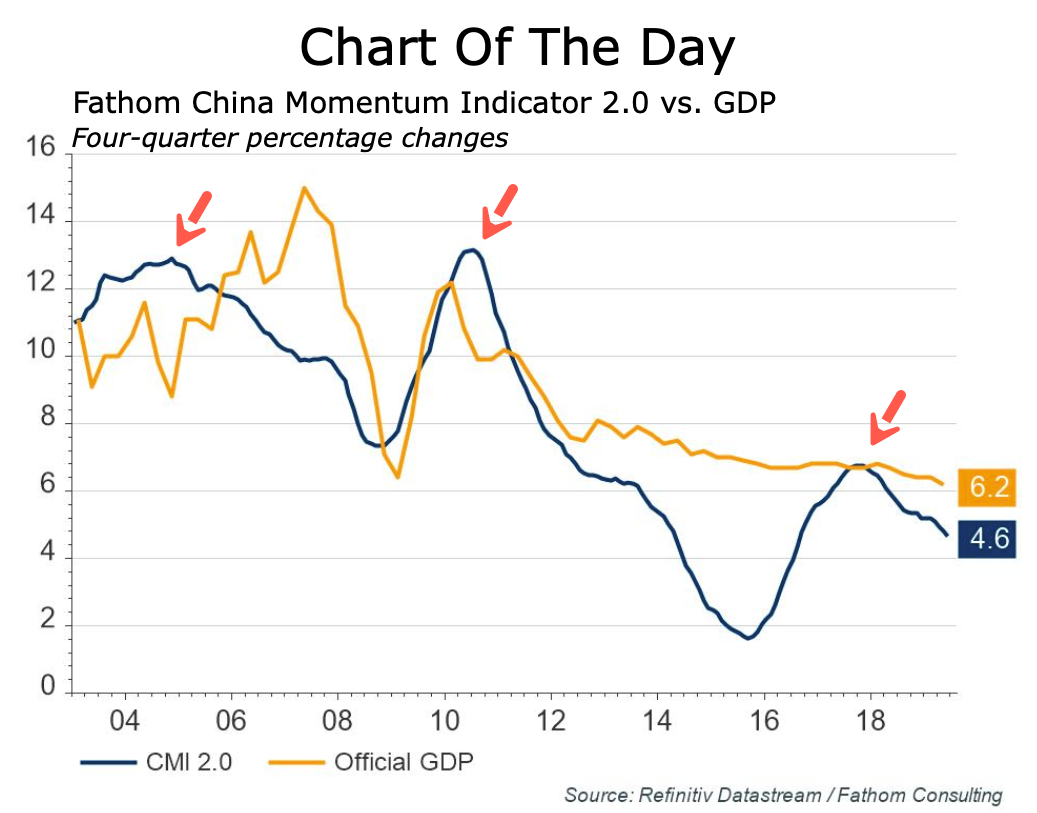
Momentum Indicator 2.0 has slowed to 4.6% in June, the lowest reading since Aug. 2016.
独立系世界マクロコンサルタント Fathom Consultingによると、彼ら独自のChina Momentum Indicator 2.0が6月に4.6%まで減速した、2015年8月以来の低位だ。
There is also a growing gap between the China Momentum Indicator 2.0 at 4.6% and official GDP data at 6.2%. Might suggest China's economy hasn't yet bottomed, could continue to decline through 2H19 into 1H20.
China Momentum Indicator 2.0の4.6%と公式GDPデータ6.2%の間には大きな乖離がある。ということは中国経済はまだ底入れしていないことを示唆している、2019H2から2020H1にかけてさらに下落の可能性がある。
Gary Cohn, the former chief economic advisor to Donald Trump, has
said the slowdown predates the trade war and reflects a strategic
decision by China to rebalance the economy.
トランプ政権の元主任経済アドバイザ Gary Cohnによると、中国経済減速は貿易戦争前から始まっており、中国の経済再構築戦略を反映している。
Fathom notes that China's economy was even slowing before the rebalancing. Fathomの報告では、中国経済は再構築前から減速していた。
The global macro research firm said, "with the consumer share of total import demand on a downward trend since 2016, we also find little evidence to suggest that China is successfully rebalancing."
To combat dangerous crosscurrents of the trade war disrupting global
supply chains in and out of China, Chinese policymakers resorted to the
same playbook as before, pump the economy with record amounts of the
stimulus earlier in the year.
Currency depreciation came into the picture when President Trump
escalated the trade war by raising tariffs to 25% from 10% on $200
billion of Chinese goods in May. Then a massive devaluation of the
renminbi followed in early August, when the president slapped 10%
tariffs on $300 billion worth of Chinese goods, effective Sept. 1.
"Trade talks are continuing, and during the talks the U.S. will
start, on Sept. 1, putting a small additional Tariff of 10% on the
remaining 300 Billion Dollars of goods and products coming from China
into our Country...We look forward to continuing our positive dialogue
with China on a comprehensive Trade Deal, and feel that the future
between our two countries will be a very bright one!" Trump said in a
tweet last month.
Since the trade war began last March, the renminbi has
weakened 13% against the U.S. dollar, neutralizing some of the tariffs
imposed by the U.S. on imports from China. 昨年3月に貿易戦争が始まって以来、人民元は対米ドルで13%弱くなっている、これが米国の関税強化をある程度緩和している。
Currency devaluation undermines hopes for a soft landing, while
further infuriating the Trump administration who has recently branded
China as a currency manipulator.
And for more bad news, China has said its rebalancing will continue
through 2020 and offered a pessimistic view of how Beijing won't sign a
trade deal until after the November 2020 election. This would almost
guarantee China is allowing its export economy to weaken while
stimulating its domestic economy, all in the attempt to trigger a
recession in the U.S. to diminish President Trump's probabilities of
getting reelected.
How Are Gold And Money Supply Related? by Tyler Durden Sun, 06/14/2020 - 13:00 Authored by Mike Shedlock via MishTalk, M2 Money Supply is surging. Will gold follow? M2マネーサプライが急増している。ゴールドはこれを追従するだろうか? Let's investigate an alleged relationship between gold and M2, a measure of money supply in the US. よく言われるM2(米国のマネーサプライ指標)とゴールドの関係について調べてみよう。 "There’s a clear correlation between the annual growth rate in M2 money supply and the price of the yellow metal. " 「M2の年率増加速度とゴールド価格の間には明らかな相関がある。」 Clear Correlation? 明らかな相関? The Tweet claims something different than my lead chart depicts. So let's investigate the above idea in other time frames. このツイートの主張は私が示す最初のチャートが示すものとは異なる。というわけでこのtweetの主張を別の時間フレームで見てみよう。 Gold vs Rate of Change in M2 Money Supply ゴールド vs M2マネーサプライの変化率 If we look at longer time frames, the rate of increase in M2 theory falls flat on its face....
Is The Stock Market As Confused As You Are About A Recession? Written by Lance Roberts | Apr, 1, 2019 Last week, Barron’s ran an article entitled “The Stock Market Is Just As Confused About A Potential Recession As You Are?” To wit: 先週バロンズにこういう記事が掲載された「株式市場は景気後退を予感させるほどに混乱しているだろうか?」見てみよう: “Investors have long used where we are in the economic cycle to decide which stocks to buy and sell. New research from Nomura’s Joseph Mezrich flips that on its head by showing how investors can use stock performance to help determine where we are in the cycle. Too bad the market is sending mixed messages right now.” 長らく投資家は現在景気サイクルのどこに居るかを見てこの株式を売るか買うかを判断してきた。野村證券のJoseph Mezrichの最近の研究では、これが逆さで、投資家は株式のパフォーマンスを見て今景気サイクルのどこにいるかを判断している。最悪なことに現在相場は悪化改善混在のメッセージを送っている。」 But let’s be clear here; no one wants the party to end. So, despite a struggling stock market over the last year, slowing economic growth, and a collapsing yield curve, there are s...