Authored by Mike Shedlock via MishTalk,
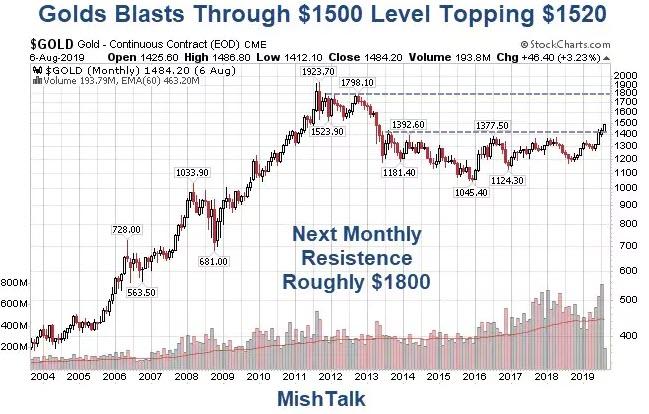
Gold blasted through the $1500 level this week. Let's analyze the message. Here's a hint: The message isn't inflation.
今週ゴールドは$1500を突き破った。このことが告げるメッセージを分析してみよう。ヒントはこれだ:そのメッセージはインフレではない。
The above chart is and end-of-day chart from yesterday. Gold closed at $1484.
At 11:30 AM Central, gold was at $1520, up $36 on the day.
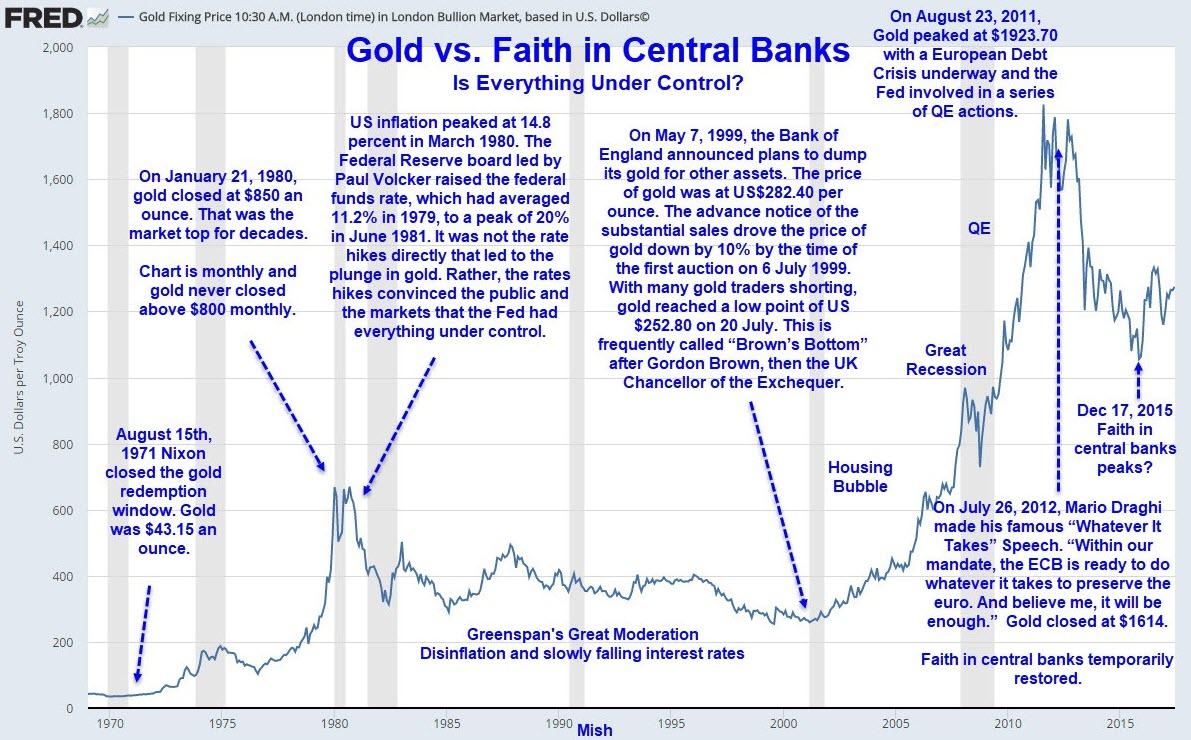
As I have pointed out numerous times, and contrary to popular belief,
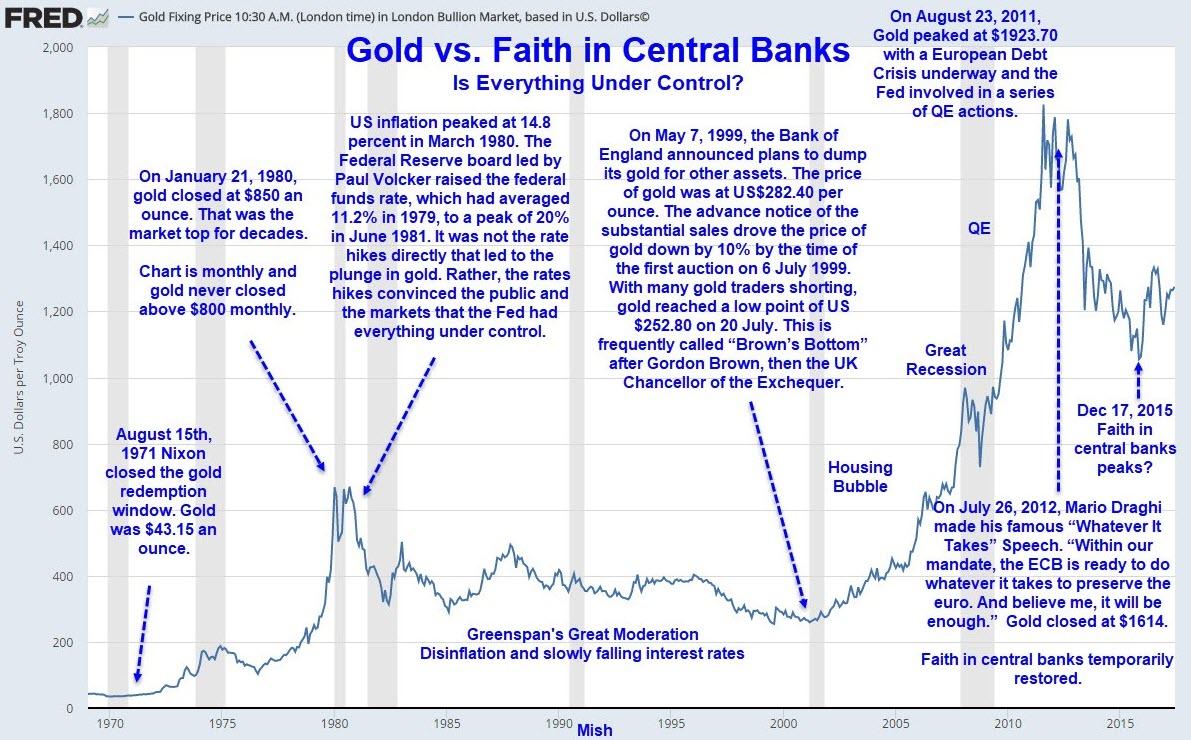
gold is not an inflation hedge. Gold fell from $800 to $250 with
inflation every step of the way.
Let me make it simple: It's the debt, stupid! 簡単に行ってしまうと:それは借金なんだ、バーカ!
The global economy is choking on debt as central banks are determined to have more of it.
世界経済は借金で首が回らなくなっている、そこへ中央銀行がさらなる借金を積み増そうとしている。
Inflation? Forget about it. The bubbles are proof we "had" inflation.
Amazonで買物をしてContrarianJを応援しよう この長文記事をRay Dalioが発表し、ゴールドは$1400から$1420へと急騰しました。GLD保持高に変化はないのでたぶん先物ポジションが進んでいます。 Ray Dalio Warns A "New Paradigm" Is Coming: "Buy Gold, Sell Stocks" by Tyler Durden Wed, 07/17/2019 - 14:44 Authored by Ray Dalio via LinkedIn, One of my investment principles is: 私の投資原則はこういうものだ: Identify the paradigm you’re in, examine if and how it is unsustainable, and visualize how the paradigm shift will transpire when that which is unsustainable stops. 現在のパラダイムを認識し、それがどの程度持続可能かどうか判断する、そしてパラダイムシフトがどのように起きるか、そしてその着地点を思い描く。 Over my roughly 50 years of being a global macro investor, I have observed there to be relatively long of periods (about 10 years) in which the markets and market relationships operate in a certain way (which I call “paradig...
Amazonで買物をしてContrarianJを応援しよう Silver Outperforming Gold 2 Adam Hamilton July 26, 2019 3232 Words Silver has blasted higher in the last couple weeks, far outperforming gold. This is certainly noteworthy, as silver has stunk up the precious-metals joint for years. This deeply-out-of-favor metal may be embarking on a sea-change sentiment shift, finally returning to amplifying gold’s upside. Silver is not only radically undervalued relative to gold, but investors are aggressively buying. Silver’s upside potential is massive. ここ2週シルバーは急騰した、ゴールドを遥かに凌ぐものだ。これは注目すべきことだ、もう何年もシルバーはひどいものだった。この極端に嫌われた金属が大きく心理を買えている、とうとうゴールド上昇を増幅するに至った。シルバーは対ゴールドで極端に過小評価されているだけでなく、投資家は積極的に買い進んでいる。シルバーの潜在上昇力は巨大なものだ。 Silver’s performance in recent years has been brutally bad, repelling all but the most fanatical contrarians. Historically silver prices have been mostly ...