Identify the paradigm you’re in, examine if and how it is
unsustainable, and visualize how the paradigm shift will transpire when
that which is unsustainable stops.
Over my roughly 50 years of being a global macro investor, I have
observed there to be relatively long of periods (about 10 years) in
which the markets and market relationships operate in a certain way
(which I call “paradigms”) that most people adapt to and eventually
extrapolate so they become overdone, which leads to shifts to new
paradigms in which the markets operate more opposite than similar to how
they operated during the prior paradigm. Identifying and tactically
navigating these paradigm shifts well (which we try to do via our Pure
Alpha moves) and/or structuring one’s portfolio so that one is largely
immune to them (which we try to do via our All Weather portfolios) is
critical to one’s success as an investor.
There are always big unsustainable forces that drive the
paradigm. They go on long enough for people to believe that they will
never end even though they obviously must end. A classic one of those is
an unsustainable rate of debt growth that supports the buying of
investment assets; it drives asset prices up, which leads people to
believe that borrowing and buying those investment assets is a good
thing to do. But it can’t go on forever because the entities borrowing
and buying those assets will run out of borrowing capacity while the
debt service costs rise relative to their incomes by amounts that
squeeze their cash flows. When these things happen, there is a paradigm
shift. Debtors get squeezed and credit problems emerge, so there is a
retrenchment of lending and spending on goods, services, and investment
assets so they go down in a self-reinforcing dynamic that looks more
opposite than similar to the prior paradigm. This continues until it’s
also overdone, which reverses in a certain way that I won’t digress into
but is explained in my book Principles for Navigating Big Debt Crises, which you can get for free here.
Another classic example that comes to mind is that extended periods
of low volatility tend to lead to high volatility because people adapt
to that low volatility, which leads them to do things (like borrow more
money than they would borrow if volatility was greater) that expose them
to more volatility, which prompts a self-reinforcing pickup in
volatility. There are many classic examples like this that repeat over
time that I won’t get into now. Still, I want to emphasize that
understanding which types of paradigms exist and how they might shift is
required to consistently invest well. That is because any single
approach to investing—e.g., investing in any asset class, investing via
any investment style (such as value, growth, distressed), investing in
anything—will experience a time when it performs so terribly that it can
ruin you. That includes investing in “cash” (i.e., short-term debt) of
the sovereign that can’t default, which most everyone thinks is riskless
but is not because the cash returns provided to the owner are
denominated in currencies that the central bank can “print” so they can
be depreciated in value when enough money is printed to hold interest
rates significantly below inflation rates.
In paradigm shifts, most people get caught overextended doing something overly popular and get really hurt. On
the other hand, if you’re astute enough to understand these shifts, you
can navigate them well or at least protect yourself against them. The
2008-09 financial crisis, which was the last major paradigm shift, was
one such period. It happened because debt growth rates were
unsustainable in the same way they were when the 1929-32 paradigm shift
happened. Because we studied such periods, we saw that we were headed
for another “one of those” because what was happening was unsustainable,
so we navigated the crisis well when most investors struggled.
I think now is a good time 1) to look at past paradigms and paradigm
shifts and 2) to focus on the paradigm that we are in and how it might
shift because we are late in the current one and likely approaching a
shift. To do that, I wrote this report with two parts: 1) “Paradigms and
Paradigm Shifts over the Last 100 Years” and 2) “The Coming Paradigm
Shift.” They are attached. If you have the time to read them both, I
suggest that you start with “Paradigms and Paradigm Shifts over the Last
100 Years” because it will give you a good understanding of them and it
will give you the evolving story that got us to where we are, which
will help put where we are into context. There is also an appendix with longer descriptions of each of the decades from the 1920s to the present for those who want to explore them in more depth.
Part I: Paradigms and Paradigm Shifts over the Last 100 Years
過去100年のパラダイムとそのシフト
History has taught us that there are always paradigms and paradigm
shifts and that understanding and positioning oneself for them is
essential for one’s well-being as an investor and beyond. The purpose of
this piece is to show you market and economic paradigms and their
shifts over the past 100 years to convey how they work. In the
accompanying piece, “The Coming Paradigm Shift,” I explain my thinking
about the one that might be ahead.
Due to limitations in time and space, I will only focus on those in
the United States because they will suffice for giving you the
perspective I’d like to convey. However, at some point I will show you
them in all significant countries in the same way I did for big debt
crises in Principles for Navigating Big Debt Crises because I
believe that understanding them all is essential for having a timeless
and universal understanding of how markets and economies work.
As you know, market pricing reflects expectations of the future; as
such, it paints quite detailed pictures of what the consensus
expectation of the future is. Then, the markets move as a function of
how events transpire relative to those expectations. As a result,
navigating markets well requires one to be more accurate about what is
going to happen than the consensus view that is built into the
price. That’s the game. That’s why understanding these paradigms and
paradigm shifts is so important.
I have found that the consensus view is typically more heavily
influenced by what has happened relatively recently (i.e., over the past
few years) than it is by what is most likely. It tends to assume that
the paradigms that have existed will persist and it fails to anticipate
the paradigm shifts, which is why we have such big market and economic
shifts. These shifts, more often than not, lead to markets and economies
behaving more opposite than similar to how they behaved in the prior
paradigm.
What follows is my description of the paradigms and paradigm shifts
in the US over the last 100 years. It includes a mix of facts and
subjective interpretations, because when faced with the choice of
sharing these subjective thoughts or leaving them out, I felt it was
better to include them along with this warning label. Naturally, my
degree of closeness to these experiences affects the quality of my
descriptions. Since my direct experiences began in the early 1960s, my
observations of the years since then are most vivid. While less vivid,
my understanding of markets and economies going back to the 1920s is
still pretty good both because of my intense studying of it and because
of my talking with the people of my parents’ generation who experienced
it. As for times before the 1920s, my understanding comes purely from
studying just the big market and economic moves, so it’s less good
though not nonexistent. Over the last year, I have been studying
economic and market moves in major countries going back to about the
year 1500, which has given me a superficial understanding of them. With
that perspective, I can say with confidence that throughout the times I
have studied the same big things happen over and over again for
essentially the same reasons. I’m not saying they’re exactly the same or
that important changes haven’t occurred, because they certainly have
(e.g., how central banks have come and gone and changed). What I am
saying is that big paradigm shifts have always happened and they
happened for roughly the same reasons.
To show them, I have divided history into decades, beginning with the
1920s, because they align well enough with paradigm shifts in order for
me to convey the picture. Though not always perfectly aligned, paradigm
shifts have coincidently tended to happen around decade shifts—e.g.,
the 1920s were “roaring,” the 1930s were in “depression,” the 1970s were
inflationary, the 1980s were disinflationary, etc. Also, I believe that
looking at
10-year time horizons helps one put things in perspective. It’s also a
nice coincidence that we are in the last months of this decade, so it’s
an interesting exercise to start imagining what the new ‘20s decade
will be like, which is my objective, rather than to focus in on what
exactly will happen in any one quarter or year.
Every decade had its own distinctive characteristics, though within
all decades there were long-lasting periods (e.g., 1 to 3 years) that
had almost the exact opposite characteristics of what typified the
decade. To successfully deal with these changes, one would have had to
successfully time the ins and outs, or faded the moves (i.e., bought
more when prices fell and sold more when prices rose), or had a balanced
portfolio that would have held relatively steady through the moves. The
worst thing would have been to go with the moves (sell after price
declines and buy after price increases).
The big economic and market movements undulated in big swings that
were due to a sequence of actions and reactions by policy makers,
investors, business owners, and workers. In the process of economic
conditions and market valuations growing overdone, the seeds of the
reversals germinated. For example, the same debt that financed excesses
in economic activity and market prices created the obligations that
could not be met, which contributed to the declines. Similarly, the more
extreme economic conditions became, the more forceful policy makers’
responses to reverse them became. For these reasons, throughout these 10
decades we see big economic and market swings around “equilibrium”
levels. The equilibriums I’m referring to are the three that I provided
in my template, which are:
1) Debt growth that is in line with the income growth that is required to service debt;
収入増加に伴って債務が増える、このとき収入増加で債務費用をまかなえる;
2) The economy’s operating rate is neither too high (because that
will produce unacceptable inflation and inefficiencies) nor too low
(because economically depressed levels of activity will produce
unacceptable pain and political changes); and
3) The projected returns of cash are below the projected returns of
bonds, which are below the projected returns of equities and the
projected returns of other “risky assets” (because the failure of these
spreads to exist will impede the effective growth of credit and other
forms of capital, which will cause the economy to slow down or go in
reverse, while wide spreads will cause it to accelerate).
At the end of each decade, most investors expected the next decade
to be similar to the prior decade, but because of the previously
described process of excesses leading to excesses and undulations, the
subsequent decades were more opposite than similar to the ones that
preceded them. As a result, market movements due to these paradigm
shifts typically were very large and unexpected and caused great shifts
in wealth.
Every major asset class had great and terrible decades, so much so
that any investor who had most of their wealth concentrated in any one
investment would have lost almost all of it at one time or another.
Theories about how to invest changed frequently, usually to explain
how the past few years made sense even when it didn’t make sense. These
backward-looking theories typically were strongest at the end of the
paradigm period and proved to be terrible guides for investing in the
next decade, so they were very damaging. That is why it is so important
to see the full range of past paradigms and paradigm shifts and to
structure one’s investment approach so that it would have worked well
through them all. The worst thing one can do, especially late in a
paradigm, is to build one’s portfolio based on what would have worked
well over the prior 10 years, yet that’s typical.
It is for these reasons that we invest the way we do—i.e., it’s
why we built a balanced All Weather portfolio designed to hold
relatively stable though the big undulations by being well-diversified
and built a Pure Alpha portfolio to make tactical timing moves.
Below, I have summarized the picture of the dynamics for each decade
with a very brief description and with a few tables that show asset
class returns, interest rates, and economic activity for each decade
over the last nine. Through these tables, you can get a feel of the
dynamics for each decade, which I then address in more detail and show
the market movements in the appendix to this report.
1920s = “Roaring”: From Boom to Bursting Bubble. It
started with a recession and the markets discounting negative growth as
stock yields were significantly above bond yields, yet there was fast
positive growth funded by an acceleration in debt during the decade, so
stocks did extremely well. By the end of the decade, the markets
discounted fast growth and ended with a classic bubble (i.e., with
debt-financed purchases of stocks and other assets at high prices) that
burst in 1929, the last year of the decade.
1930s = Depression. This decade was for the
most part the opposite of the 1920s. It started with the bursting
reactions to high levels of indebtedness and the markets discounting
relatively high growth rates. This debt crisis and plunge in economic
activity led to economic depression, which led to aggressive easing by
the Fed that consisted of breaking the link to gold, interest rates
hitting 0%, the printing of a lot of money, and the devaluing of the
dollar, which was accompanied by rises in gold prices, stock prices, and
commodity prices from 1932 to 1937. Because the monetary policy caused
asset prices to rise and because compensation didn’t keep up, the wealth
gap widened, a conflict between socialists and capitalists emerged, and
there was the rise of populism and nationalism globally. In 1937, the
Fed and fiscal policies were tightened a bit and the stock market and
economy plunged. Simultaneously, the geopolitical conflicts between the
emerging Axis countries of Germany, Italy, and Japan and the established
Allied countries of the UK, France, and China intensified, which
eventually led to all-out war in Europe in 1939 and the US beginning a
war in Asia in 1941. For the decade as a whole, stocks performed badly,
and a debt crisis occurred early, which was largely handled via
defaults, guarantees, and monetization of debts along with a lot of
fiscal stimulation. For a detailed account of this period, see pages
49-95 in Part Two of Principles for Navigating Big Debt Crises.
1930年代=「恐慌」。この10年はその前の10年とは全く逆だった。高レベルの債務崩壊から始まり、市場は高成長とは乖離した。この債務危機と経済活動下落で恐慌を引き起こした、この結果FEDは極端な緩和策を講じ、ドルとゴールドの関係を壊した、金利はゼロになり多量の紙幣印刷が行われた、ドルの減価が実行され、ゴールドは相対的に高くなった、株式やコモディティも同様だ、これが1932から1937の間に起きた。金融政策のために株価は上昇したが給与は増えなかったために資産格差が広がった、こうして社会主義と資本主義の間の対立が生じた、こうして世界中で大衆迎合と国家主義が広がった。1937年には、FEDは引き締め政策に転じ、株式と経済は低迷した。これと時を同じ駆使してドイツを中心とする枢軸国イタリア・日本と英国、フランス中国連合国の間での地政学的な対立が生じた、やがて1939年には欧州全面戦争となり、米国はアジアで1941年に参戦した。この10年全体で見ると、株式パフォーマンスは悪かった、そして初期に債務危機が生じた、おもに倒産と債務保証、そして債権買取で対応した、これに加えて多額の財政刺激策が取られた。この時期の詳細については「多額債務危機を乗り越える原則 Part Twoの49−95ページを見てほしい。
1940s = War and Post-War. The economy and
markets were classically war-driven. Governments around the world both
borrowed heavily and printed significant amounts of money, stimulating
both private-sector employment in support of the war effort and military
employment. While production was strong, much of what was produced was
used and destroyed in the war, so classic measures of growth and
unemployment are misleading. Still, this war-effort production pulled
the US out of the post-Great Depression slump. Monetary policy was kept
very easy to accommodate the borrowing and the paying back of debts in
the post-war period. Specifically, monetary policy remained stimulative,
with interest rates held down and fiscal policy liberally producing
large budget deficits during the war and then after the war to promote
reconstruction abroad (the Marshall Plan). As a result, stocks, bonds,
and commodities all rallied over the period, with commodities rallying
the most early in the war, and stocks rallying the most later in the war
(when an Allied victory looked to be more likely) and then at the
conclusion of the war. The pictures of what happened in other countries,
especially those that lost the war, were radically different and are
worthy of description at another time. After the war, the United States
was the preeminent power and the dollar was the world’s reserve currency
linked to gold, with other currencies linked to the dollar. This period
is an excellent period for exemplifying 1) the power and mechanics of
central banks to hold interest rates down with large fiscal deficits and
2) market action during war periods.
1950s = Post-War Recovery. In the 1950s,
after two decades of depression and war, most individuals were
financially conservative, favoring security over risk-taking. The
markets reflected this by de facto pricing in negative levels of
earnings growth with very high risk premia (e.g., S&P 500 dividend
yields in 1950 were 6.8%, more than 3 times the 10-year bond yield of
1.9%, and earning yields were nearly 14%). What happened in the ‘50s was
exactly the opposite of what was discounted. The post-war recovery was
strong (averaging 4% real growth over the decade), in part through
continued stimulative policy/low rates. As a result, stocks did
great. Since the government wasn’t running large deficits, government
debt burdens (government debt as a percent of incomes) fell, while
private debt levels were in line with income growth, so debt growth was
in line with income growth. The decade ended in a financially healthy
position, with prices discounting relatively modest growth and low
inflation. The 1950s and the 1960s were also a period in which
middle-class workers were in high demand and prospered.
1960s = From Boom to Monetary Bust. The first
half of the decade was an increasingly debt-financed boom that led to
balance of payments problems in the second half, which led to the big
paradigm shift of ending the Bretton Woods monetary system. In the first
half, the markets started off discounting slow growth, but there was
fast growth so stocks did well until 1966. Then most everyone looked
back on the past 15 years of great stock market returns and was very
bullish. However, because debt and economic growth were too fast and
inflation was rising, the Fed’s monetary policy was tightened (e.g., the
yield curve inverted for the first time since 1929). That produced the
real (i.e., inflation-adjusted) peak in the stock market that wasn’t
broken for 20 years. In the second half of the 1960s, debt grew faster
than incomes and inflation started to rise with a “growth recession,”
and then a real recession came at the end of the decade. Near the end of
the ‘60s, the US balance of payments problem became more clearly
manifest in gold reserves being drawn down, so it became clear that the
Fed would have to choose between two bad alternatives—i.e., a) too tight
a monetary policy that would lead to too weak an economy or b) too much
domestic stimulation to keep the dollar up and inflation down. That led
to the big paradigm shift of abandoning the monetary system and
ushering in the 1970s decade of stagflation, which was more opposite
than similar to the 1960s decade.
1970s = Low Growth and High Inflation (i.e., Stagflation). At
the beginning of the decade, there was a high level of indebtedness, a
balance of payments problem, and a strained gold standard that was
abandoned in 1971. As a result, the promise to convert money for gold
was broken, money was “printed” to ease debt burdens, the dollar was
devalued to reduce the external deficits, growth was slow and inflation
accelerated, and inflation-hedge assets did great while stocks and bonds
did badly during the decade. There were two big waves up in inflation,
inflation expectations, and interest rates, with the first from 1970 to
1973 and the second and bigger one from 1977 to 1980-81. At the end of
the decade, the markets discounted very high inflation and low growth,
which was just about the opposite of what was discounted at the end of
the prior decade. Paul Volcker was appointed in August 1979. That set
the stage for the coming 1980s decade, which was pretty much the
opposite of the 1970s decade.
1980s = High Growth and Falling Inflation (i.e., Disinflation). The
decade started with the markets discounting high inflation and slow
growth, yet the decade was characterized by falling inflation and fast
growth, so inflation-hedge assets did terribly and stocks and bonds did
great. The paradigm shift occurred at the beginning of the decade when
the tight money conditions that Paul Volcker imposed triggered a
deflationary pressure, a big economic contraction, and a debt crisis in
which emerging markets were unable to service their debt obligations to
American banks. This was managed well, so banks were provided with
adequate liquidity and debts weren’t written down in a way that
unacceptably damaged bank capital. However, it created a shortage of
dollars and capital flows that led the dollar to rise, and it created
disinflationary pressures that allowed interest rates to decline while
growth was strong, which was great for stock and bond prices. As a
result, this was a great period for disinflationary growth and high
investment returns for stocks and bonds.
1990s = “Roaring”: From Bust to Bursting Bubble. This
decade started off with a recession, the first Gulf War, and the easing
of monetary policy and relatively fast debt-financed growth and rising
stock prices; it ended with a “tech/dot-com” bubble (i.e., debt-financed
purchases of “tech” stocks and other financial assets at high prices)
that looked quite like the Nifty Fifty bubble of the late 1960s. That
dot-com bubble burst just after the end of the decade, at the same time
there were the 9/11 attacks, which were followed by very costly wars in
Iraq and Afghanistan.
2000-10 = “Roaring”: From Boom to Bursting Bubble. This
decade was the most like the 1920s, with a big debt bubble leading up
to the 2008-09 debt/economic bust that was analogous to the 1929-32 debt
bust. In both cases, these drove interest rates to 0% and led to
central banks printing a lot of money and buying financial assets. The
paradigm shift happened in 2008-09, when quantitative easing began as
interest rates were held at or near 0%. The decade started with very
high discounted growth (e.g., expensive stocks) during the dot-com
bubble and was followed by the lowest real growth rate of any of these
nine decades (1.8%), which was close to that of the 1930s. As a result,
stocks had the worst return of any other decade since the 1930s. In this
decade, as in the 1930s, interest rates went to 0%, the Fed printed a
lot of money as a way of easing with interest rates at 0%, the dollar
declined, and gold and T-bonds were the best investments. At the end of
the decade, a very high level of indebtedness remained, but the markets
were discounting slow growth.
2010-Now = Reflation. The shift to the new
paradigm, which was also the bottom in the markets and the economy, came
in late 2008/early 2009 when risk premiums were extremely high,
interest rates hit 0%, and central banks began aggressive quantitative
easings (“printing money” and buying financial assets). Investors took
the money they got from selling their financial assets to central banks
and bought other financial assets, which pushed up financial asset
prices and pushed down risk premiums and all asset classes’ expected
returns. As in the 1932-37 period, that caused financial asset prices to
rise a lot, which benefited those with financial assets relative to
those without them, which widened the wealth gap. At the same time,
technological automation and businesses globalizing production to
lower-cost countries shifted wages, particularly for those in the
middle- and lower-income groups, while more of the income gains over the
decade went to companies and high-income earners. Growth was slow, and
inflation remained low. Equities rallied consistently, driven by
continued falling discount rates (e.g., from central bank stimulus),
high profit margins (in part from automation keeping wage growth down),
and, more recently, from tax cuts. Meanwhile, the growing wealth and
income gaps helped drive a global increase in populism. Now, asset
prices are relatively high, growth is priced to remain moderately
strong, and inflation is priced to remain low.
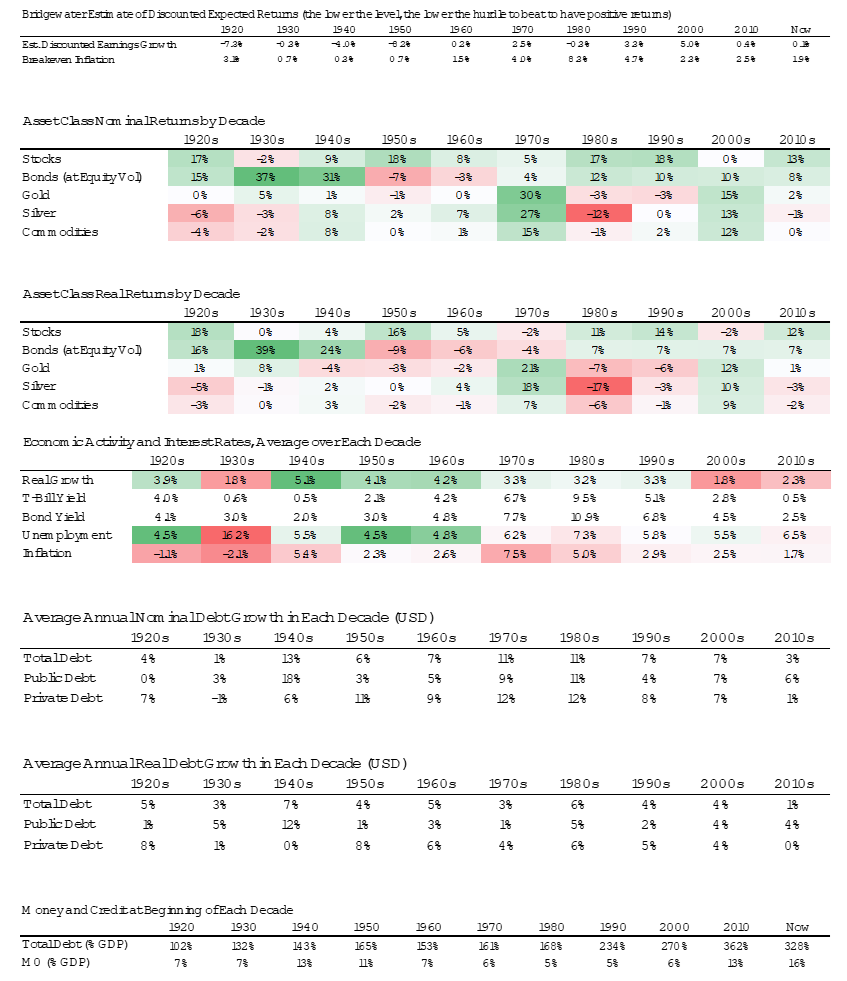
The tables that follow show a) the growth and inflation rates that
were discounted at the beginning of each decade, b) growth, inflation,
and other stats for each decade, c) asset class returns in both nominal
and real terms, and d) money and credit ratios and growth rates of debt
for each decade.
For the appendix with more detail on each decade, you can access the full report here.
各10年のもっと詳細なデータを付録に示している、皆さんも全文にアクセスできる。
Part 2: The Coming Paradigm Shift
これから来るパラダイムシフト
The main forces behind the paradigm that we have been in since 2009 have been:
2009年以来のパラダイムの背後にある主要因はこういうものだ:
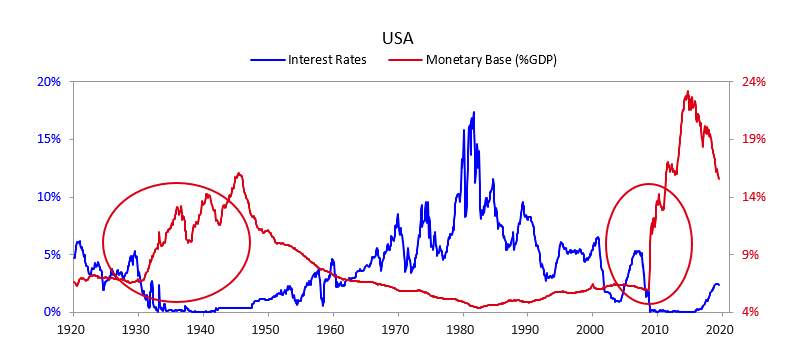
1. Central banks have been lowering interest rates and doing
quantitative easing (i.e., printing money and buying financial assets)
in ways that are unsustainable.
中郷銀行は金利を下げ、量的緩和を継続してきた(紙幣印刷と資産買取)、これは持続不可能だ。
Easing in these ways has been a strong stimulative force since 2009,
with just minor tightenings that caused “taper tantrums.” That
bolstered asset prices both directly (from the actual buying of the
assets) and indirectly (because the lowering of interest rates both
raised P/Es and led to debt-financed stock buybacks and acquisitions,
and levered up the buying of private equity and real estate). That form
of easing is approaching its limits because interest rates can’t be
lowered much more and quantitative easing is having diminishing effects
on the economy and the markets as the money that is being pumped in is
increasingly being stuck in the hands of investors who buy other
investments with it, which drives up asset prices and drives down their
future nominal and real returns and their returns relative to cash
(i.e., their risk premiums). Expected returns and risk premiums of
non-cash assets are being driven down toward the cash return, so there
is less incentive to buy them, so it will become progressively more
difficult to push their prices up. At the same time, central banks doing
more of this printing and buying of assets will produce more negative
real and nominal returns that will lead investors to increasingly prefer
alternative forms of money (e.g., gold) or other storeholds of wealth.
As these forms of easing (i.e., interest rate cuts and QE) cease to
work well and the problem of there being too much debt and non-debt
liabilities (e.g., pension and healthcare liabilities) remains, the
other forms of easing (most obviously, currency depreciations and fiscal
deficits that are monetized) will become increasingly likely. Think of
it this way: one person’s debts are another’s assets. Monetary policy
shifts back and forth between a) helping debtors at the expense of
creditors (by keeping real interest rates down, which creates bad
returns for creditors and good relief for debtors) and b) helping
creditors at the expense of debtors (by keeping real interest rates up,
which creates good returns for creditors and painful costs for
debtors). By looking at who has what assets and liabilities, asking
yourself who the central bank needs to help most, and figuring out what
they are most likely to do given the tools they have at their disposal,
you can get at the most likely monetary policy shifts, which are the
main drivers of paradigm shifts.
To me, it seems obvious that they have to help the debtors relative
to the creditors. At the same time, it appears to me that the forces of
easing behind this paradigm (i.e., interest rate cuts and quantitative
easing) will have diminishing effects. For these reasons, I believe that
monetizations of debt and currency depreciations will eventually pick
up, which will reduce the value of money and real returns for creditors
and test how far creditors will let central banks go in providing
negative real returns before moving into other assets.
To be clear, I am not saying that this shift will happen
immediately. I am saying that I think it is approaching and will have a
big effect on what the next paradigm will look like.
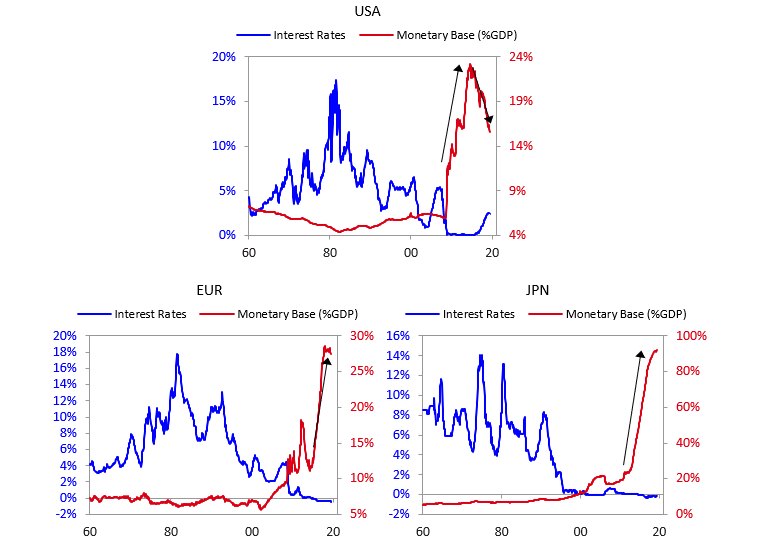
The next three charts show the US dollar, the euro, and the yen since
1960. As you can see, when interest rates hit 0%, the money printing
began in all of these economies. The ECB ended its QE program at the end
of 2018, while the BoJ is still increasing the money supply. Now, all
three central banks are turning to these forms of easing again, as
growth is slowing and inflation remains below target levels.
2. There has been a wave of stock buybacks, mergers, acquisitions,
and private equity and venture capital investing that has been funded by
both cheap money and credit and the enormous amount of cash that was
pushed into the system.
That pushed up equities and other asset prices and drove down future
returns. It has also made cash nearly worthless. (I will explain more
about why that is and why it is unsustainable in a moment.) The gains in
investment asset prices benefited those who have investment assets much
more than those who don’t, which increased the wealth gap, which is
creating political anti-capitalist sentiment and increasing pressure to
shift more of the money printing into the hands of those who are not
investors/capitalists.
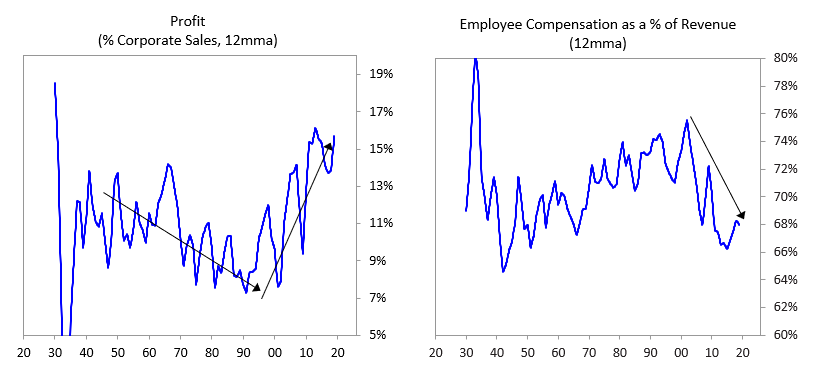
3. Profit margins grew rapidly due to advances in automation and globalization that reduced the costs of labor.
利益率は急速に向上している、その原因は自動化と労働コストを下げるグローバライゼーションだ。
The chart below on the left shows that growth. It is unlikely that
this rate of profit margin growth will be sustained, and there is a good
possibility that margins will shrink in the environment ahead. Because
this increased share of the pie going to capitalists was accomplished by
a decreased share of the pie going to workers, it widened the wealth
gap and is leading to increased talk of anti-corporate, pro-worker
actions.
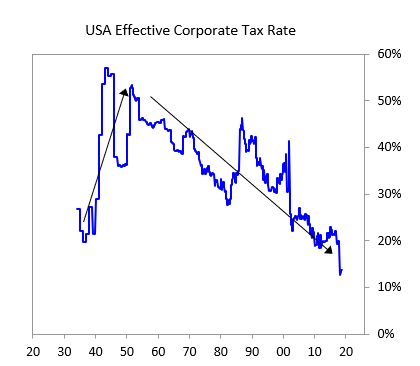
4. Corporate tax cuts made stocks worth more because they give more returns.
法人減税は利益を増やし株価を上昇させる
The most recent cut was a one-off boost to stock prices. Such cuts
won’t be sustained and there is a good chance they will be reversed,
especially if the Democrats gain more power.
直近の法人減税の株価への影響は一度だけのものだ。このような減税は持続可能ではなく、今後反転する可能性が高い、特に民主党が力をもったときにはそうなるだろう。
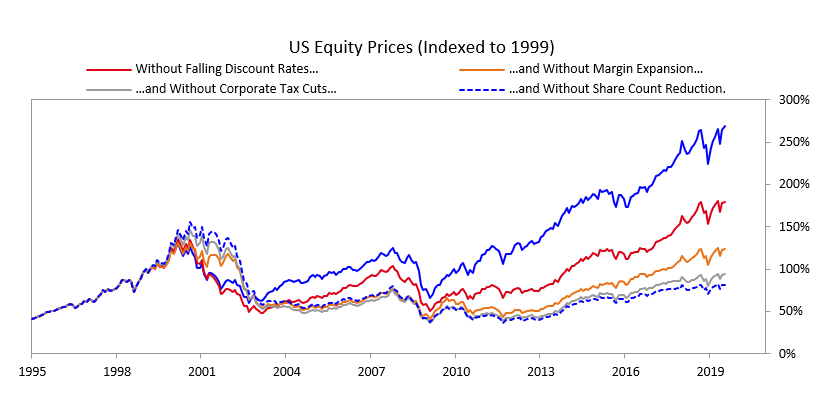
These were big tailwinds that have supported stock prices. The chart
below shows our estimates of what would have happened to the S&P 500
if each of these unsustainable things didn’t happen.
There’s a saying in the markets that “he who lives by the crystal
ball is destined to eat ground glass.” While I’m not sure exactly when
or how the paradigm shift will occur, I will share my thoughts about
it. I think that it is highly likely that sometime in the next few
years, 1) central banks will run out of stimulant to boost the markets
and the economy when the economy is weak, and 2) there will be an
enormous amount of debt and non-debt liabilities (e.g., pension and
healthcare) that will increasingly be coming due and won’t be able to be
funded with assets. Said differently, I think that the paradigm that we
are in will most likely end when a) real interest rate returns are
pushed so low that investors holding the debt won’t want to hold it and
will start to move to something they think is better and b)
simultaneously, the large need for money to fund liabilities will
contribute to the “big squeeze.” At that point, there won’t be enough
money to meet the needs for it, so there will have to be some
combination of large deficits that are monetized, currency
depreciations, and large tax increases, and these circumstances will
likely increase the conflicts between the capitalist haves and the
socialist have-nots. Most likely, during this time, holders of debt will
receive very low or negative nominal and real returns in currencies
that are weakening, which will de facto be a wealth tax.
市場にはこういう諺がある、「水晶玉に頼る人はやがて野の草を食むことになる」。私はいつどのようにパラダイムシフトが起きるかを正確に予想はできないが、しかし私の考えを皆さんと共有しよう。私は今後数年のうちのどこかでおきると思っている、1)中央銀行は市場や経済の刺激策に尽きるだろう、経済は弱いものだ、そして 2)そうなったときに巨額の債務と非債務負担が残される(年金や医療)、この時が近づいており現在の資産で賄うことはできないだろう。言い換えるならば、現在のパラダイムはもうすぐ終わると見ている、というのも a)実リターンはとても低く押し込まれ債務を抱える投資家はもっと別の好ましい資産に乗り換え始めるだろう、そして b) それと同時に、大きな負担に必要なマネーを必要としこれが「big squeeze」を引き起こすだろう。この時点で、負担に対応する十分なマネーは無く、大きな財政赤字(これはマネタイズで対応)と通貨減価をせざるを得ないだろう、さらに大幅増税、そしてこういう状況になると持てる資本主義者と持たざる社会主義者の混乱を引き起こす。こういうときにもっともらしいのは、債務を持つ物のリターンはとても少なく、減価された通貨では実質も名目もマイナスとなる、こうなると資産課税がデファクトとなるだろう。
Right now, approximately 13 trillion dollars’ worth of
investors’ money is held in zero or below-zero interest-rate-earning
debt. That means that these investments are worthless for producing
income (unless they are funded by liabilities that have even
more negative interest rates). So these investments can at best be
considered safe places to hold principal until they’re not safe because
they offer terrible real returns (which is probable) or because rates
rise and their prices go down (which we doubt central bankers will
allow).
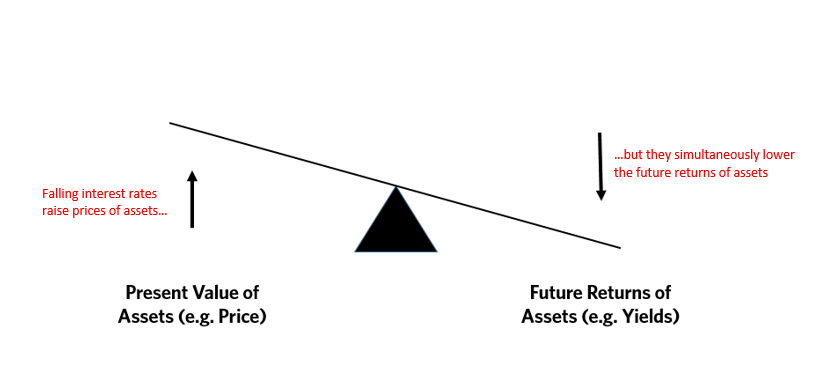
Thus far, investors have been happy about the rate/return decline
because investors pay more attention to the price gains that result from
falling interest rates than the falling future rates of return. The
diagram below helps demonstrate that. When interest rates go down (right
side of the diagram), that causes the present value of assets to rise
(left side of the diagram), which gives the illusion that investments
are providing good returns, when in reality the returns are just future
returns being pulled forward by the “present value effect.” As a result
future returns will be lower.
これまでのところ、金利が下がっても投資家はハッピィだった、というのも金利低下で株価上昇に注目していたからだ。この状況を下の図で示している。金利が下がると(この絵の右側)、現在の資産価値が上昇する(この絵の左側)、投資家が良いリターンを得るというのは幻想に過ぎない、実際にはリターンは将来のものであり、「現在価値」で割り引かれている。結果として将来リターンは低くなるだろう。
That will end when interest rates reach their lower limits (slightly
below 0%), when the prospective returns for risky assets are pushed down
to near the expected return for cash, and when the demand for money to
pay for debt, pension, and healthcare liabilities increases. While there
is still a little room left for stimulation to produce a bit more of
this present value effect and a bit more of shrinking risk premiums,
there’s not much.
At the same time, the liabilities will be coming due, so it’s
unlikely that there will be enough money pushed into the system to meet
those obligations. Then it is likely that there will be a battle over 1)
how much of those promises won’t be kept (which will make those who are
owed them angry), 2) how much they will be met with higher taxes (which
will make the rich poorer, which will make them angry), and 3) how much
they will be met via much bigger deficits that will be monetized (which
will depreciate the value of money and depreciate the real returns of
investments, which will hurt those with investments, especially those
holding debt).
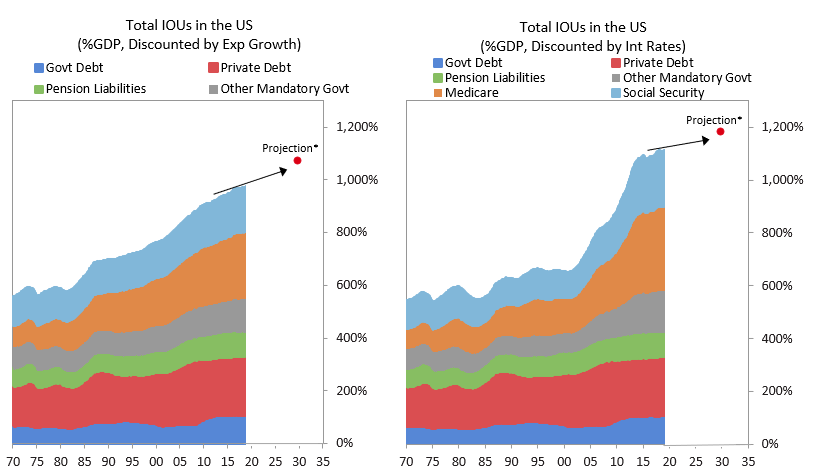
The charts below show the wave of liabilities that is coming at us in the US.
下のチャートは米国で今後我々が負うべき負担(IOU)だ。
*Note: Medicare, Social Security, and other government programs
represent the present value of estimates of future outlays from the
Congressional Budget Office. Of course, some of the IOUs have assets or
cash flows partially backing them (like tax revenue covering some Social
Security outlays). 10-year forward projections are based on government
projections of public debt and social welfare payments. *Note: Medicare, Social Security, and other government programs
represent the present value of estimates of future outlays from the
Congressional Budget Office. Of course, some of the IOUs have assets or
cash flows partially backing them (like tax revenue covering some Social
Security outlays). 10-year forward projections are based on government
projections of public debt and social welfare payments.
History has shown us and logic tells us that there is no limit to the
ability of central banks to hold nominal and real interest rates down
via their purchases by flooding the world with more money, and that it
is the creditor who suffers from the low return.
The enormous amounts of money in no- and low-returning
investments won’t be nearly enough to fund the liabilities, even though
the pile looks like a lot. That is because they don’t provide
adequate income. In fact, most of them won’t provide any income, so they
are worthless for that purpose. They just provide a “safe” place to
store principal. As a result, to finance their expenditures, owners of
them will have to sell off principal, which will diminish the amount of
principal that they have left, so that they a) will need progressively
higher and higher returns on the dwindling amounts (which they have no
prospect of getting) or b) they will have to accelerate their eating
away at principal until the money runs out.
That will happen at the same time that there will be greater internal
conflicts (mostly between socialists and capitalists) about how to
divide the pie and greater external conflicts (mostly between countries
about how to divide both the global economic pie and global influence). In such a world, storing one’s money in cash and bonds will no longer be safe. Bonds
are a claim on money and governments are likely to continue printing
money to pay their debts with devalued money. That’s the easiest and
least controversial way to reduce the debt burdens and without raising
taxes. My guess is that bonds will provide bad real and nominal returns
for those who hold them, but not lead to significant price declines and
higher interest rates because I think that it is most likely that
central banks will buy more of them to hold interest rates down and keep
prices up. In other words, I suspect that the new paradigm will
be characterized by large debt monetizations that will be most similar
to those that occurred in the 1940s war years. これと同時に内部抗争がより激化するだろう(多くは社会主義と共産主義の対立だ)如何にパイを分け合うかで、そして対外構想も増すだろう(多くは世界経済でのパイの奪い合いとなる)。こういう世界では、個人資産を現金や国債で持つのはもはや安全ではない。国債というのはお金の請求権であり政府は紙幣印刷で債務返済を行うだろう、通貨の減価となるわけだ。これがもっとも安易で係争を引き起こさずに債務負荷を減らせる、また増税の必要もない。私の見立てでは、国債は名目でも実質でも悪いリターンとなるだろう、しかし大きく価格を下げたり金利が上がったりはしないだろう、というのも私はもっともらしいのは、中央銀行がその多くを買い取り金利を抑え価格を維持すると見ている。言い換えると、私の考える新パラダイムは多額の国債買取だろう、これは1940年代の戦時に実行された。
So, the big question worth pondering at this time is which
investments will perform well in a reflationary environment accompanied
by large liabilities coming due and with significant internal conflict
between capitalists and socialists, as well as external conflicts. It is
also a good time to ask what will be the next-best currency or
storehold of wealth to have when most reserve currency central bankers
want to devalue their currencies in a fiat currency system.
Most people now believe the best “risky investments” will continue to
be equity and equity-like investments, such as leveraged private
equity, leveraged real estate, and venture capital, and this is
especially true when central banks are reflating. As a result,
the world is leveraged long, holding assets that have low real and
nominal expected returns that are also providing historically low
returns relative to cash returns(because of the enormous
amount of money that has been pumped into the hands of investors by
central banks and because of other economic forces that are making
companies flush with cash).
I think these are unlikely to be good real returning
investments and that those that will most likely do best will be those
that do well when the value of money is being depreciated and domestic
and international conflicts are significant, such as gold. Additionally,
for reasons I will explain in the near future, most investors are
underweighted in such assets, meaning that if they just wanted to have a
better balanced portfolio to reduce risk, they would have more of this
sort of asset. For this reason, I believe that it would be both
risk-reducing and return-enhancing to consider adding gold to one’s
portfolio. I will soon send out an explanation of why I believe that
gold is an effective portfolio diversifier. 私の見立てでは、これらは良いリターンを引き起こす投資とは思えない、通貨が減価されるときに最良のものではなかろう、そして国内的、国際的に係争が深刻化している、降雨時にはゴールドだ。加えて言うなら、近い将来にその理由を説明するが、多くの投資家はこの資産への投資比率が過小だ、ということはリスクを低減するために彼らがほんの少し望むだけで、この種の資産をさらに持つことになる。この理由で、私はこう信じている、ポートフォリオにゴールドを加えることでリスクを低減しリターンを増強できる。どうして私がゴールドがポートフォリオ分散にゴールドが有効かという解説をすぐに皆さんに伝えることになるだろう。
How Are Gold And Money Supply Related? by Tyler Durden Sun, 06/14/2020 - 13:00 Authored by Mike Shedlock via MishTalk, M2 Money Supply is surging. Will gold follow? M2マネーサプライが急増している。ゴールドはこれを追従するだろうか? Let's investigate an alleged relationship between gold and M2, a measure of money supply in the US. よく言われるM2(米国のマネーサプライ指標)とゴールドの関係について調べてみよう。 "There’s a clear correlation between the annual growth rate in M2 money supply and the price of the yellow metal. " 「M2の年率増加速度とゴールド価格の間には明らかな相関がある。」 Clear Correlation? 明らかな相関? The Tweet claims something different than my lead chart depicts. So let's investigate the above idea in other time frames. このツイートの主張は私が示す最初のチャートが示すものとは異なる。というわけでこのtweetの主張を別の時間フレームで見てみよう。 Gold vs Rate of Change in M2 Money Supply ゴールド vs M2マネーサプライの変化率 If we look at longer time frames, the rate of increase in M2 theory falls flat on its face....