The wild ride in job reports continues, this time to the upside with the unemployment unchanged but employment down. 雇用統計は大きく変化し、今回は表向き失業率は変わらずだが、しかしemployment 就業は減った。
Initial Reaction 当初の反応
In January, the BLS reported the population supposedly shrunk by
649,000. Last month the jobs only rose by 20,000. This month the BLS
says job gains were 196,0000. But the BLS also says employment fell by
201,000. The wild fluctuations continue.
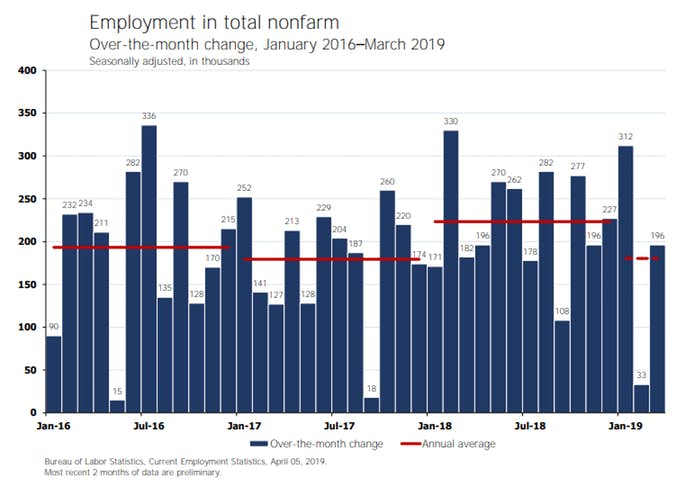
The change in total nonfarm payroll employment for January was
revised up from +311,000 to +312,000, and the change for February was
revised up from +20,000 to +33,000. With these revisions, employment
gains in January and February combined were 14,000 more than previously
reported. After revisions, job gains have averaged 180,000 per month
over the last 3 months.
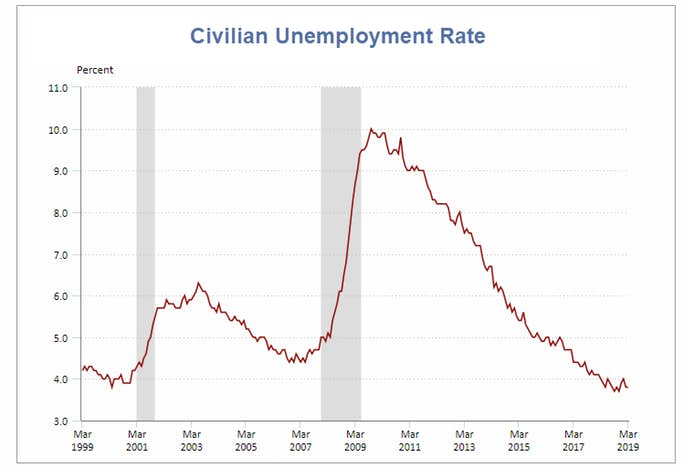
Baseline Unemployment Rate: Unchanged at 3.8% – Household Survey
U-6 unemployment: Unchanged at 7.3% – Household Survey
Civilian Non-institutional Population: +145,000
Civilian Labor Force: -224,000 – Household Survey
Not in Labor Force: +369,000 – Household Survey
Participation Rate: -0.2 to 63.0– Household Survey
Employment Report Statement 雇用統計報告
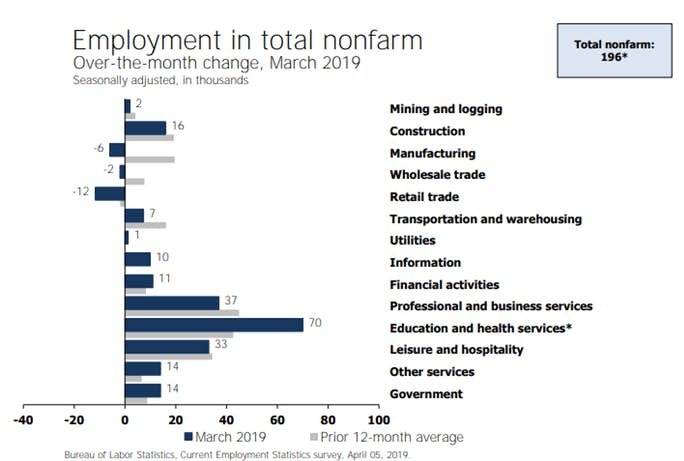
Total nonfarm payroll employment increased by 196,000 in March, and
the unemployment rate was unchanged at 3.8 percent, the U.S. Bureau of
Labor Statistics reported today. Notable job gains occurred in health
care and in professional and technical services.
The above Unemployment Rate Chart is from the BLS. Click on the link for an interactive chart.
上に示した失業率チャートはBLS発表のものだ。リンクをクリックするとインタラクティブ操作ができる。
Nonfarm Employment Change from Previous Month
非農業雇用の前月比較変化
Hours and Wages
就労時間と給与
Average weekly hours
of all private employees was flat at 34.4 hours. Average weekly hours
of all private service-providing employees was flat at 33.3 hours.
Average weekly hours of manufacturers was flat at 40.7 hours.
Average Hourly Earnings of All Nonfarm Workers
rose $0.4 to $27.70. That a 0.14% gain. Average hourly earnings of
private service-providing employees rose $0.05 to $27.47, a gain of
0.18%. Average hourly earnings of manufacturers fell $0.05 to $27.38, a
loss of 0.18%.
Average hourly earnings of Production and Supervisory Workers
rose $0.06 to $23.24. That’s a 0.26% gain. Average hourly earnings of
private service-providing employees rose $0.06 to $22.98, a gain of
0.26%. Average hourly earnings of manufacturers rose $0.02 to $21.93, a
gain of 0.09%
Birth Death Model 出生死亡モデル
Starting January 2014, I dropped the Birth/Death Model
charts from this report. For those who follow the numbers, I retain
this caution: Do not subtract the reported Birth-Death number from the
reported headline number. That approach is statistically invalid. Should
anything interesting arise in the Birth/Death numbers, I will comment
further.
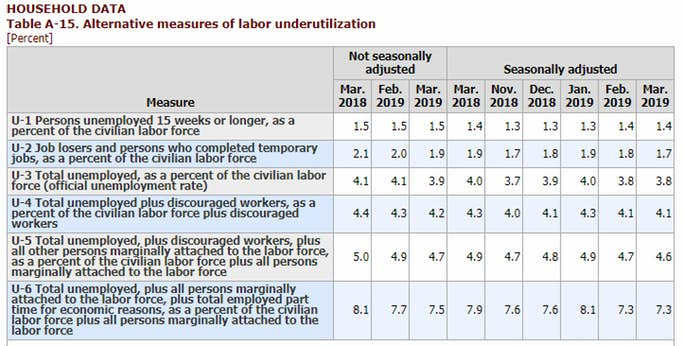
Table 15 BLS Alternative Measures of Unemployment 図15 BLSによる他の失業率指標
Table A-15 is where one can find a better approximation of what the unemployment rate really is.
図A-15を見ることで本当の失業率に対するより「better」な数値を見つけることができる。
Notice I said “better” approximation not to be confused with “good” approximation.
注意してほしいが私は「better」というわけで「good」と混同しないように
The official unemployment rate is 3.8%. However, if you start
counting all the people who want a job but gave up, all the people with
part-time jobs that want a full-time job, all the people who dropped off
the unemployment rolls because their unemployment benefits ran out,
etc., you get a closer picture of what the unemployment rate is. That
number is in the last row labeled U-6.
Some of those dropping out of the labor force retired because they
wanted to retire. The rest is disability fraud, forced retirement,
discouraged workers, and kids moving back home because they cannot find a
job.
In
the payroll survey, three part-time jobs count as three jobs. The BLS
attempts to factor this in, but they do not weed out duplicate Social
Security numbers. The potential for double-counting jobs in the payroll
survey is large.
Household Survey vs. Payroll Survey 家計調査 vs. 雇用調査
The payroll survey (sometimes called the establishment survey) is the
headline jobs number, generally released the first Friday of every
month. It is based on employer reporting.
The household survey is a phone survey conducted by the BLS. It measures unemployment and many other factors.
家計調査はBLSによる電話聞き取り調査だ。これで失業とか他の多くのことを調べる。
If you work one hour, you are employed. If you don’t have a job and
fail to look for one, you are not considered unemployed, rather, you
drop out of the labor force.
These distortions artificially lower the unemployment rate,
artificially boost full-time employment, and artificially increase the
payroll jobs report every month.
Final Thoughts 最終的に思うところ
The past several jobs reports have had wild fluctuations. This month
repeated the story but in different ways. Last month I commented: “The
three month average of jobs is now +186,000 per month but the three
month average in employment is only +47,000 per month.”
過去の雇用統計は大きく変動している。今月も同様だがその原因は大きく異なる。先月私がコメントしたが:「3ヶ月平均で雇用 jobs は+186,000/月だが、しかし三ヶ月平均の就業数 employment はわずか+47,000/月だ。」
That discrepancy continues. For the last three months, jobs
are up an average of 180,000 per month. Employment is up 54,000 per
month.
Year-over-year employment went from 155,160 to 156,748. That’s an average of 132,000 per month and slowing, if the trend holds.
Is The Stock Market As Confused As You Are About A Recession? Written by Lance Roberts | Apr, 1, 2019 Last week, Barron’s ran an article entitled “The Stock Market Is Just As Confused About A Potential Recession As You Are?” To wit: 先週バロンズにこういう記事が掲載された「株式市場は景気後退を予感させるほどに混乱しているだろうか?」見てみよう: “Investors have long used where we are in the economic cycle to decide which stocks to buy and sell. New research from Nomura’s Joseph Mezrich flips that on its head by showing how investors can use stock performance to help determine where we are in the cycle. Too bad the market is sending mixed messages right now.” 長らく投資家は現在景気サイクルのどこに居るかを見てこの株式を売るか買うかを判断してきた。野村證券のJoseph Mezrichの最近の研究では、これが逆さで、投資家は株式のパフォーマンスを見て今景気サイクルのどこにいるかを判断している。最悪なことに現在相場は悪化改善混在のメッセージを送っている。」 But let’s be clear here; no one wants the party to end. So, despite a struggling stock market over the last year, slowing economic growth, and a collapsing yield curve, there are s...
How Are Gold And Money Supply Related? by Tyler Durden Sun, 06/14/2020 - 13:00 Authored by Mike Shedlock via MishTalk, M2 Money Supply is surging. Will gold follow? M2マネーサプライが急増している。ゴールドはこれを追従するだろうか? Let's investigate an alleged relationship between gold and M2, a measure of money supply in the US. よく言われるM2(米国のマネーサプライ指標)とゴールドの関係について調べてみよう。 "There’s a clear correlation between the annual growth rate in M2 money supply and the price of the yellow metal. " 「M2の年率増加速度とゴールド価格の間には明らかな相関がある。」 Clear Correlation? 明らかな相関? The Tweet claims something different than my lead chart depicts. So let's investigate the above idea in other time frames. このツイートの主張は私が示す最初のチャートが示すものとは異なる。というわけでこのtweetの主張を別の時間フレームで見てみよう。 Gold vs Rate of Change in M2 Money Supply ゴールド vs M2マネーサプライの変化率 If we look at longer time frames, the rate of increase in M2 theory falls flat on its face....
China Injects Gargantuan 1.1 Trillion In Liquidity This Week by Tyler Durden Wed, 01/16/2019 - 22:19 Following what Bloomberg calculated was a record net reverse repo liquidity injection on Wednesday, when the PBOC injected a whopping 560 billion yuan of liquidity into the financial system via open market operations, the Chinese central bank has done it again and in Thursday's open market operation, it sold 250BN yuan in 7 Day repos (slightly below yesterday's record 350BN), and 150BN in 28 Day repos, which net of maturities resulted in a whopping net 380BN yuan ($56.2BN) liquidity injection. ブルームバーグの算出によると水曜に記録的なリバースレポ流動性注入が行われた、PBOCがなんと公開市場操作で金融システムになんと560B人民元を注入した、中国中央銀行は再び木曜に公開市場操作を行った、250B人民元の7日決済レポを売却した(昨日の350B人民元よりも少し少ない)、そして28日決済のレポを150B人民元注入した、結果としてなんと380B人民元($56.2B)の流動性注入となる。 (訳注:なんか足し算すると辻褄が合いません、ブルーム...