イールドカーブなど無視しろというが・・・
100年に一度と言われる出来事が過去20年で二回も起き、今度が三度目になるかどうか?
Ignore The Yield Curve, They Said… 03-30-19
Written by Lance Roberts | Mar, 30, 2019
A Run For The Highs
高値に向かう
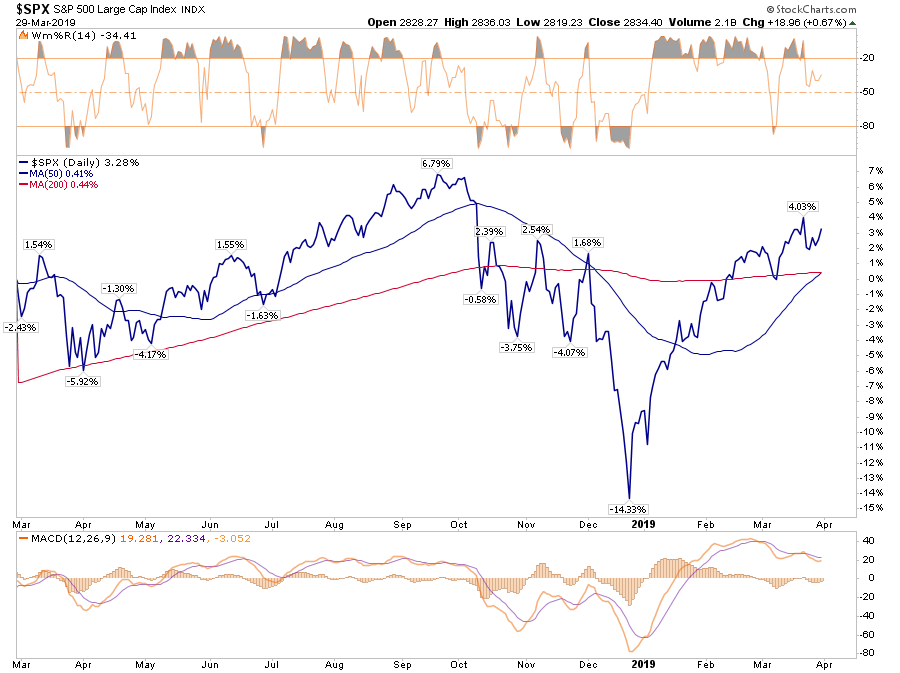
2019Q1も金曜に終わり、2009年以来最良の四半期だった。下のチャートに示すが、もしみなさんが底値でかっていたなら、「息を呑まんばかりだ」ったろう。

However, you didn’t.
しかしながら、そうはしなかったでしょう。
Despite all of the media “hoopla” about the rally, the reality is that for most, they are simply getting back to even over the last year.
どのメディアもこのラリーで「大騒ぎ」だが、現実を思い起こすと、これは単に昨年のレベルに戻っただけのことだ。
That is, assuming you didn’t “sell the bottom” in December, which by looking at allocation changes, certainly appears to be the case for many.
ということで、みなさんは12月の「底値で売る」ようなことをしなかったろう、それは多くの人も同じことだ。
If we deconstruct the ratio we can see the rotation a bit better
この比率を分析すると資金移動をもう少しよく理解できる
Not surprisingly, historically speaking, investors had their peak stock exposure before the market cycle peak. As the market had its first stumble, investors sold. When the market bounces, investors are initially reluctant to chase it. However, as the rally continues, the “fear of missing out or F.O.M.O” eventually forces them back into the market. This is how bear market rallies work; they inflict the most pain possible on investors both on the bounce and then on the way back down.
驚くことではないが、歴史を振り返ると、相場が天井を迎える少し前に投資家は株式露出を最高にする。相場が最初によろめくと、投資家は売りに出る。相場が跳ね返るとき、投資家は最初は迷いながらもいやいやそれを追いかける。しかしながら、ラリーが続くと「相場に乗り遅れるのではないかという恐怖」でやがて市場に戻らざるを得なくなる。これがベアラリーの仕組みだ;こうして投資家は二度痛い目に合う、跳ね返りが起きた時とその後の下落再開だ。
However, for the moment, we are still in the midst of a bear market rally. This will be the case until the market breaks out to new highs. Only then can we confirm the previous consolidation is complete and the bull market has been re-established.
しかしながら、今の所、我々はまだベア相場ラリーの真っ最中だ。この状態は相場が新高値をつけるまで続くことだろう。こうなって初めて我々はこれまでの根固めが終わったことに気づき、ブル相場が再度確立する。
The good news is on a very short-term basis, the market IS INDEED bullishly biased and coming off an extremely strong first quarter rally. The current momentum of the market is strong as bullish optimism has regained a foothold.
良いニュースはとても短期的なもので、相場は確かに強気で極端に強いQ1を終えた。現在の相場のモメンタムは強く、強気楽観が市場を席巻している。
But, as we noted for our RIA PRO Subscribers last week, (Free 30-Day Trial with Code: PRO30) complacency has moved back to extremes which suggests that a further rally isn’t “risk free.”
しかし、RIA PRO 読者には先週伝えたが、(PRO30コードを利用すれば30日無料トライアルできる)極端な安心感が生まれているが決してさらに「リスクフリー」なラリーを示唆しているわけではない。」
“The graph below is constructed by normalizing VIX (equity volatility), MOVE (bond volatility) and CVIX (US dollar volatility) and then aggregating the results into an equal-weighted index. The y-axis denotes the percentage of time that the same or lower levels of aggregated volatility occurred since 2010. For instance, the current level is 1.91%, meaning that only 1.91% of readings registered at a lower level.
「下のグラフは以下のような指数から合成舌チャートだ、VIX(株式変動)、MOVE(債権変動)そしてCVIX(米ドル変動)これを対等に組み込んだ指数だ。このグラフの縦軸は2010年以来のこの総合的ボラティリティをパーセントで示している。今の所そのレベルは1.91%であり、とても低い。
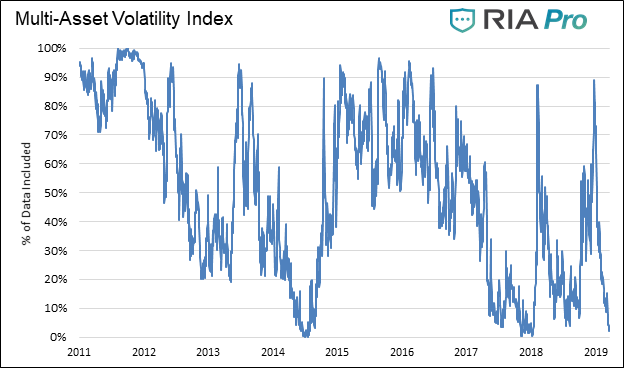
“Beyond the very low level of volatility across the three major asset classes, there are two other takeaways worth pondering.
The peak -to- trough -to- peak cycle over the last year was measured in months not years as was the case before 2018.
Secondly, when the index reached current low levels in the past, a surge in volatility occurred soon after that. This does not mean the index will bounce higher immediately, but it does mean we should expect a much higher level of volatility over the next few months.”
「いまのところ3つの主要資産クラスにおいてボラティリティはとても低いが、注目すべきことが2つある。山ー谷ー山のサイクルを見ると昨年は月単位で起きていた、しかし2018年以前を見るとこのサイクルは年単位のものだった。
第二に、これまでこの指数が今のように低くなると、すぐその後にボラティリティは急増している。このことは決して直ちにこの指数が急増するということではない、しかし今後数カ月はもっと高いレベルになるだろうと見るべきだ。」
Nonetheless, the markets are close to registering a “golden cross.” This is some of that technical “voodoo” where the 50-day moving average (dma) crosses above the longer-term 200-dma. This “cross” provides substantial support for stocks at that level and limits downside risk to some degree in the short-term.
他でもなく、市場は「ゴールデンクロス」に近づいている。これはチャートテクニカル的には「おまじない」のたぐいであり、50日移動平均が200日移動平均をよぎるということだ。この「クロス」は株式のサポートとみなされ短期的には下落リスクは限られている。
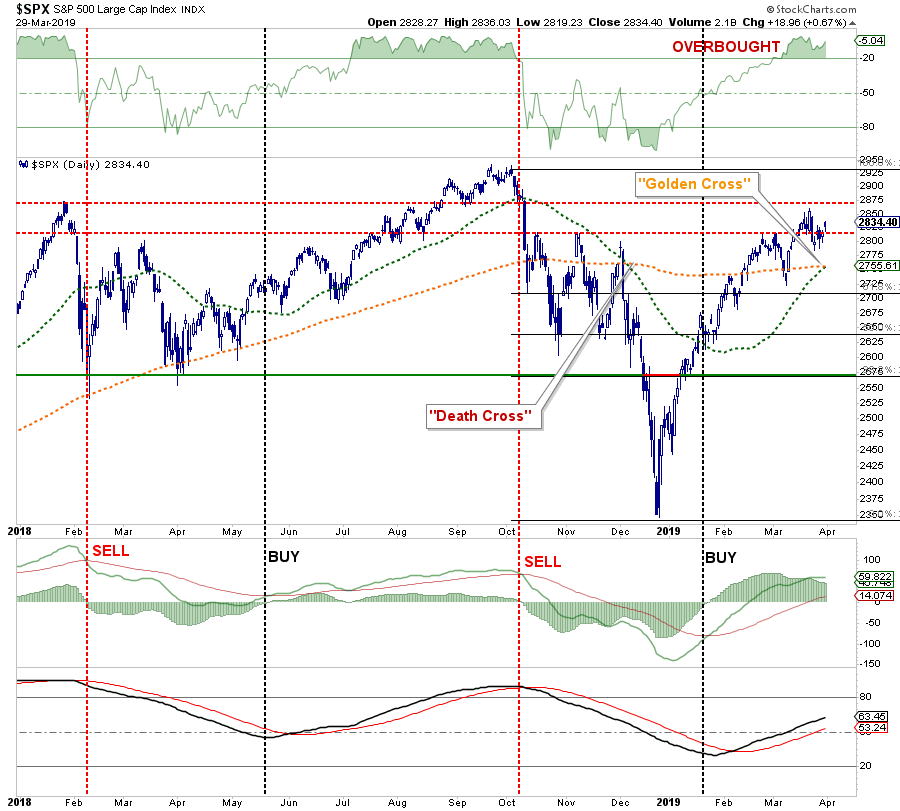
Over the next couple of weeks, you are going to see a LOT of commentary about “the Golden Cross” buy signal and why this means the “bull market” is officially back in action. While “golden crosses” are indeed bullish for the markets, they are not an infallible signal. The chart below shows the 2015-2016 market where investors were whipsawed over a 6-month period before massive Central Bank interventions got the markets back on track.
今後数週間皆さんはこういう記事を目にするだろう、「ゴールデンクロス」は買シグナルであり、この現象が起きたことは公式に「ブル相場」が戻ってきたことを意味する、と。相場にとって「ゴールデンクロス」というのは強気なシグナルに違いないが、絶対的なシグナルではない。下に示すのは2015−2016のチャートだが、6ヶ月の間に中央銀行の介入で投資家は二度損をしている。
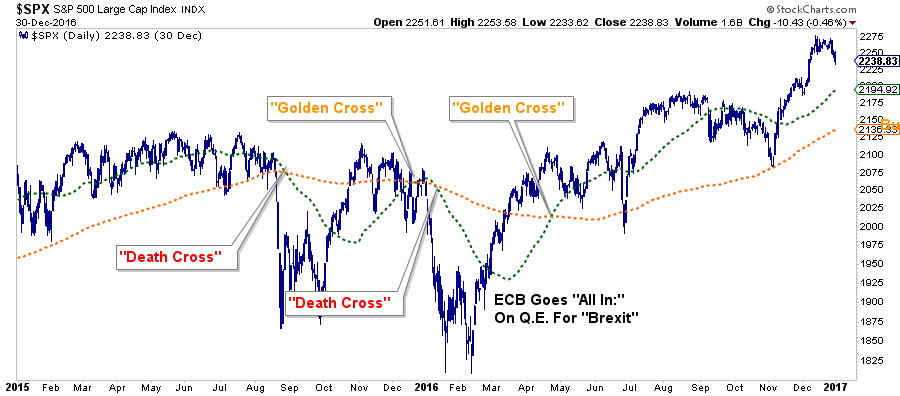
The next chart shows the longer-term version of the chart above using WEEKLY data. The parameters are set for a slightly longer time frame to reduce the number of “false” indications. I have accentuated the moving averages to have them more clearly show the crosses.
次のチャートは長期的なデータを週足で示している。「偽シグナル」を除外するためにパラメータは長めに設定している。クロスを目立たせるために移動平均を強調している。
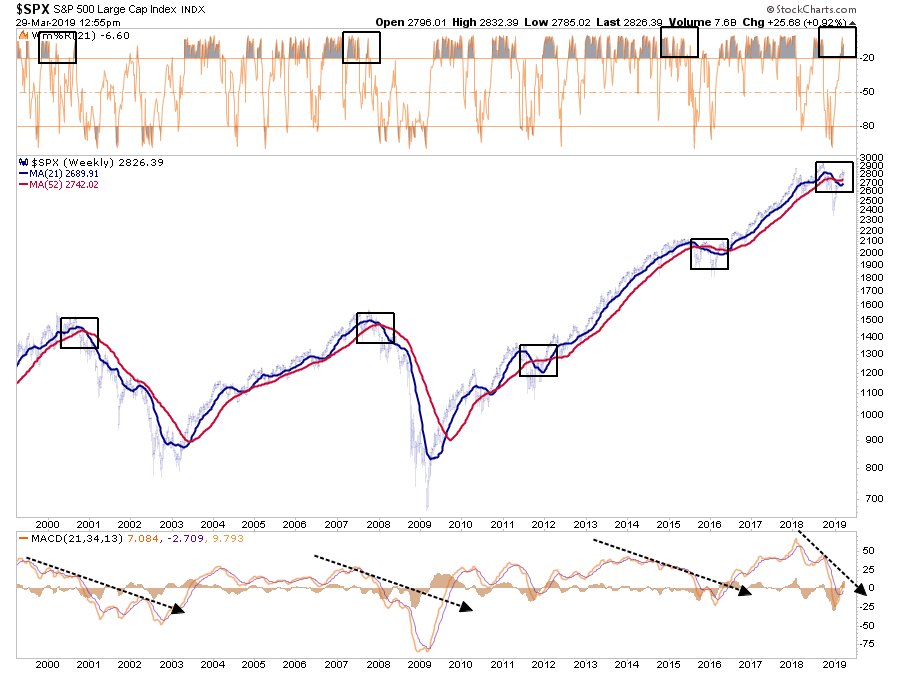
The one thing that you should notice is the negative “cross over” is still intact AND it is doing so in conjunction with an extreme overbought weekly condition and a “negatively diverging” moving average divergence/convergence (MACD) indicator. This combined set of “signals” has only been seen in conjunction with the previous market peaks. (As noted, the corrections of 2012 and 2015-16 were offset by massive amounts of Central Bank interventions which are not present currently.)
ここで注目すべきは、「マイナスの交差」はまだ有効で、且つ、週足で見て極端な買われすぎ状態だ、そしてMACDでみて「マイナス乖離」が起きている。このような組み合わせ「シグナル」が生じたのは過去の相場天井のときだけだ。(2012と2015−16の調整は中央銀行の巨額介入で相殺された、今はそういう状況にはない。)
From a portfolio management standpoint, what should you do?
ポートフォリオ管理の立場からみて、皆さんはどう行動すべきだろうか?
In the short-term the market remains bullishly biased and suggests, with a couple of months to go in the “seasonally strong” period of the year, that downside risk is somewhat limited.
短期的には、相場は強気バイアスのままであり、今後2か月程度は「季節的に強い期間」であることを考慮すると、下落リスクは限定的だということを示唆している。
Therefore, our portfolio allocations:
しかるに、私どものポートフォリオ配分は:
- Remain long-biased towards equity risk
株式リスクに対してはロング側のバイアスを保ったままだ。 - Have a balance between offensive and defensive sector positioning
セクター配分に関しては攻撃的セクターと防御的セクターのバランスを取る。 - Are tactically positioned for a trade resolution (which we will sell into the occurrence of.)
売買判断に関しては戦術的なポジションとする(なにか起きればすぐに売却する)。
しかしながら、長期的な視点を尊重して分析を続ける。最近のイールドカーブ反転、経済データの悪化、そして今後の収益見通しは弱く、リスク管理と資金保全に注意する。こういう視点で見ると:
- Continuing to carry slightly higher levels of cash
引き続き現金ポジションを高める - Overweight bonds
債権重視 - Have some historically defensive positioning in portfolios.
ポートフォリオには歴史的に見て防御的なポジションを増やす。 - Continue to tighten-up stop-loss levels to protect gains, and;
引き続きストップロスを厳しく設定し、そして: - Have outright hedges ready to implement when needed.
必要なときには断固としてヘッジを行う。
Ignore The Yield Curve…They Said
イールドカーブなど無視しろ・・・と言われるが
第二次大戦を想定したリアルタイム戦略ゲーム、Company of Heroes,が2006年9月12日に発表された、この工兵部隊がこういうことを口にすることがある:
“Join the army they said. It’ll be fun they said.”Since then, the statement has become a common meme on the internet to espouse the disappointment derived from various actions from doing the laundry to getting a job.
それ以来、この文がインターネットで良く転用される、自ら取った行動で予想外の結末を迎えたときに揶揄するのだ、それは洗濯から就職までいろいろだ。
Well, the latest suggested action, which will ultimately lead to investor disappointment, is:
そう、最近の投資家の行動で言えば、投資家は残念な結果を迎えるだろう、こういう具合だ:
“Ignore the yield curve they said. It’ll be fun they said.”
「イールドカーブを無視しろ、そうすれば良い結果が得られるぞ、と奴らは言う。」
先週のことだ、J.P.MorganのMark Kolanovicはこういった:
“Historically, equity markets tended to produce some of the strongest returns in the months and quarters following an inversion. Only after [around] 30 months does the S&P 500 return drop below average,”
「歴史的に見ると、イールドカーブ反転が起きたあとの数ヶ月から数四半期は株式市場は強くなる傾向にある。30か月を過ぎたあたりからS&P500のリターンは下がり始める、」
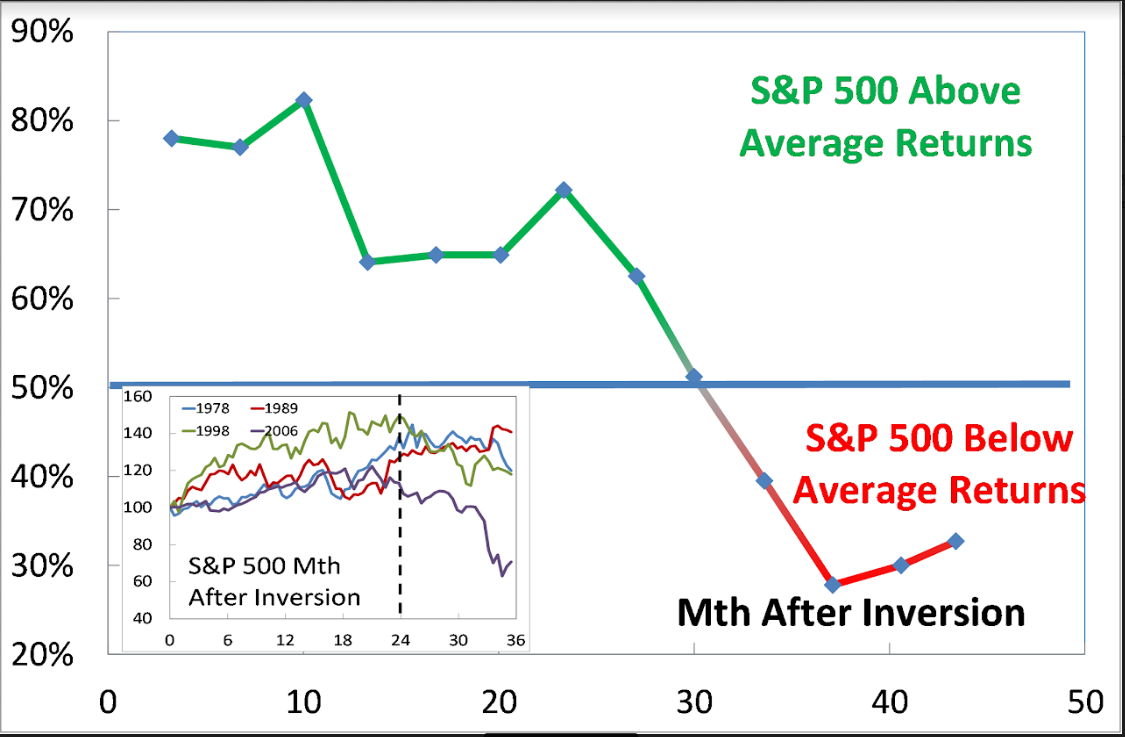
While the statement is not incorrect, it is advice that will ultimately lead to disappointment.
この主張は間違っているわけではないが、この助言は絶対がっかりした結末を迎えるだろう。
In 1998, for example, as the bull market was running hot. There was “no recession in sight,” and investors were repeatedly advised to ignore the yield curve because “this time was different.”
たとえば1998年には、ブル相場は加熱した。当時は「景気後退は眼中になかった、」そして投資家はイールドカーブ反転を無視するように何度も強気アドバイスを受けた「今回は違う」と。
After all, at that moment in history, it was perceived to be a “new paradigm.” The internet was changing the world and making old metrics, like earnings, relics of the past. It was even suggested at the time that “investing like Warren Buffett was like driving Dad’s old Pontiac.”
歴史を振り返ると、そういうときは「ニューパラダイム」が受け入れられるものだ。インターネットが世界を変え、PER収益のような古い指標はもう過去の遺物だ。当時例えられたのは「ウォーレンバフェットのような投資手法は親父の古いポンティアックに乗るようなものだ」と。
Over the next two years, that advice held true as bullish optimism seemed well founded. It was in early 2000 that Jim Cramer issued his Top 10-Stock Picks for the next decade.
その後二年の間、このアドバイスは本当で強い楽観主義が支配した。2000年始めにあのJim Cramerが、今後数十年を見据えた10銘柄、を発表したものだ。
The problem is that no one ever said “sell.”
問題はだれも「売る」なんてことを口にしなかったことだ。
While it was great that gains were made during the period between the initial yield curve inversion and the peak of the market, all of those gains, plus much more, were wiped out in the ensuing decline. Values in portfolios were returned to where they were roughly a decade earlier by the time the decline was officially over.
Since the majority of mainstream financial advice never suggest selling, investors had no clue that if they had gone to cash in 1998, they saved themselves both a lot of grief and years of losses needing to be recovered.
最初にイールドカーブ反転が起きてから相場の天井までは素晴らしいものだったが、この上昇の全ては次の下落で帳消しとなった。下落が公式に終了認定された時点ではポートフォリオ価値は10年前のレベルに戻っていた。主要金融アドバイザの多くは決して売りを口にしない、彼らが1998年にはすでに現金化していても投資家はそのことを知らなかった、彼らは多くの悲しみを受け入れ損失回復を何年も待ったのだ。
It was just an anomaly.
これは単なるアノマリにすぎなかった。
That was the belief at the time. Following the “Dot.com” crash, the entire tragic event was considered an anomaly; a once-in-a-100-year event which would not be replicated anytime again soon.
当時はこう信じられていた。「ドットコム」暴落につづくこの悲劇はアノマリと考えられた;100年に一度の出来事でありこれがすぐに繰り返すことはすぐには無いだろうと。
But just 4-years later, in 2006, investors were once again told to ignore the yield curve inversion as it was a “Goldilocks economy” and “sub-prime mortgages were contained.” While many of the individuals who had told you to stay invested leading up to 2000 peak were mostly gone from the industry, a whole new crop of media gurus and advisors once again told investors to “ignore the yield curve.”
しかしわずか4年後の2006年に、投資家はまたもやイールドカーブ反転を無視するように告げられた、これは「Godilocks economy 適温相場」であり「サブプライム住宅問題はすでに収まった」と。あなた達個人投資家にそのまま2000ピークまで持ち続けるよう推奨した人たちはもうこの業界からいなくなってしまっており、新たなアドバイザたちがまたもや投資家に「イールドカーブを無視するよう」投資家に推奨した。
For a second time, had investors just sold when the yield curve inverted, the amount of damage that would have avoided more than paid off for the small amount of gains missed as the market cycle peaked.
流石に二度目になり、投資家はイールドカーブ反転で売却し、さらなる損失を回避できた、ただしその変わりに相場天井までの多少の上昇を逃した。
この4枚のチャートは過去4回のイールドカーブ反転時の状況を示している、10項目のイールドカーブに対して50%反転したときに注目したものだ。10−イールドカーブの50%が反転した時を縦赤点線で示している。ここを売却タイミングとしてその後の安値も示している。
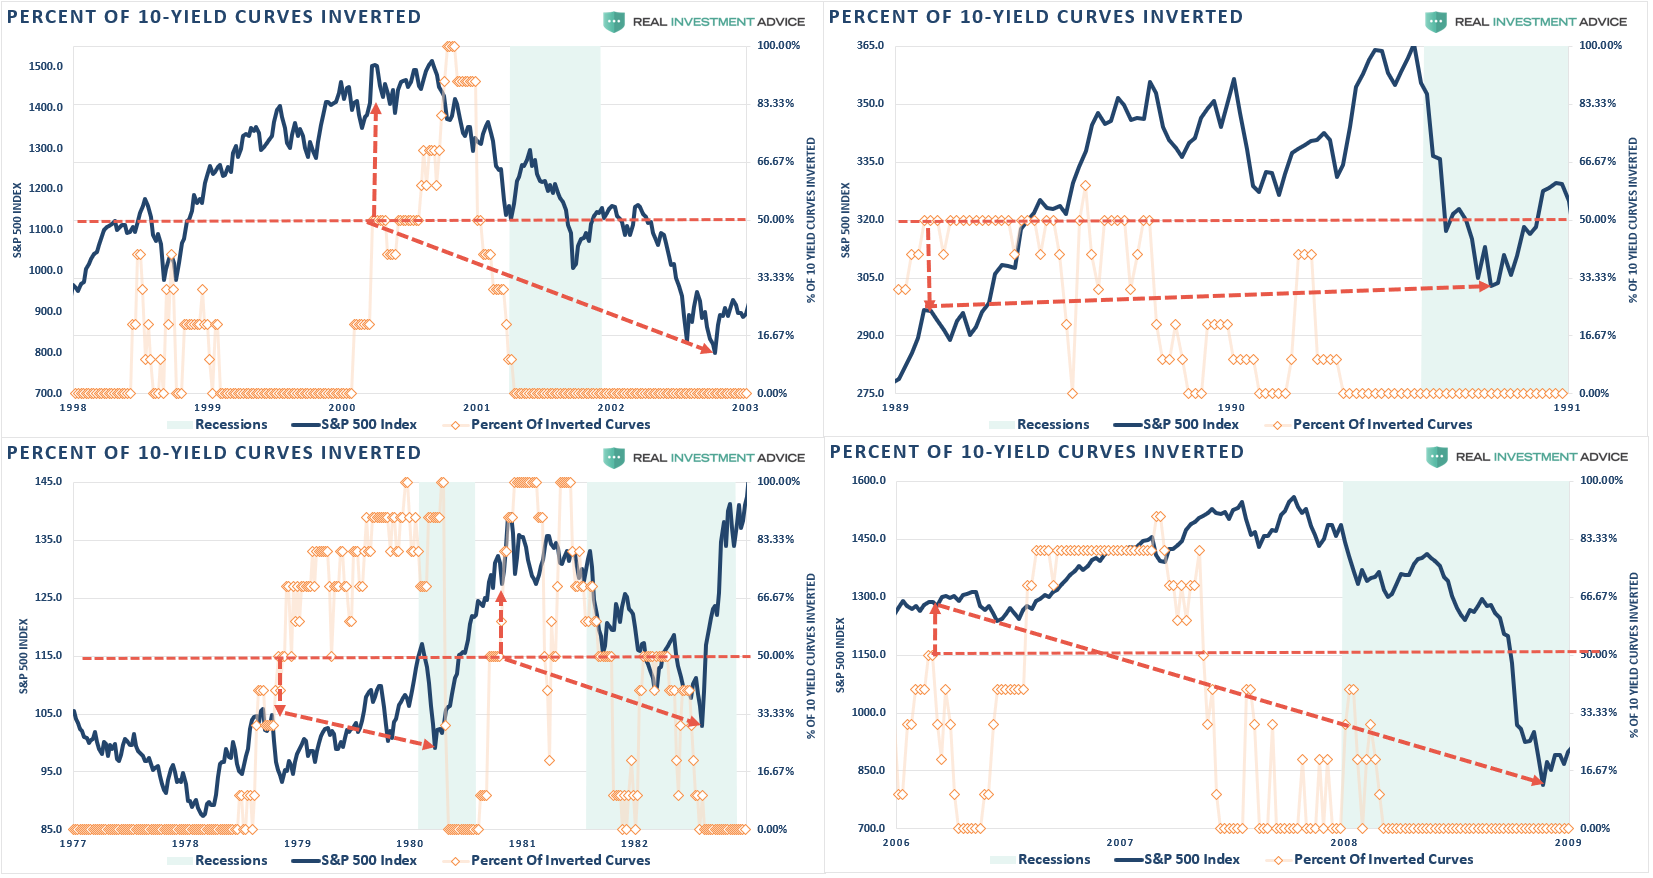 As
you can see, in every case, the market did rally a bit after the
initial reversion. However, had you reduced your equity-related risk,
not only did you bypass a lot of market volatility (which would have led to investor mistakes anyway) but ended up better off than those trying to just ride it out.
As
you can see, in every case, the market did rally a bit after the
initial reversion. However, had you reduced your equity-related risk,
not only did you bypass a lot of market volatility (which would have led to investor mistakes anyway) but ended up better off than those trying to just ride it out.見ての通りどの場合も、最初の反転後に少しラリーが起きている。しかしながら、株式関連リスクを減らせば、市場のボラティリティを回避しただけでなく(ボラティリティが投資判断を見誤まさせる)、それに乗らないことでうまくやり過ごした。
That’s just history
この4枚のチャートはどれももう過ぎたことだ
Oh, as we noted last week, we just hit the 50% mark of inversions on the 10-spreads we track.
では、私どもが先週書いたが、今丁度私どもが追跡している10スプレッドの内50%が反転した。
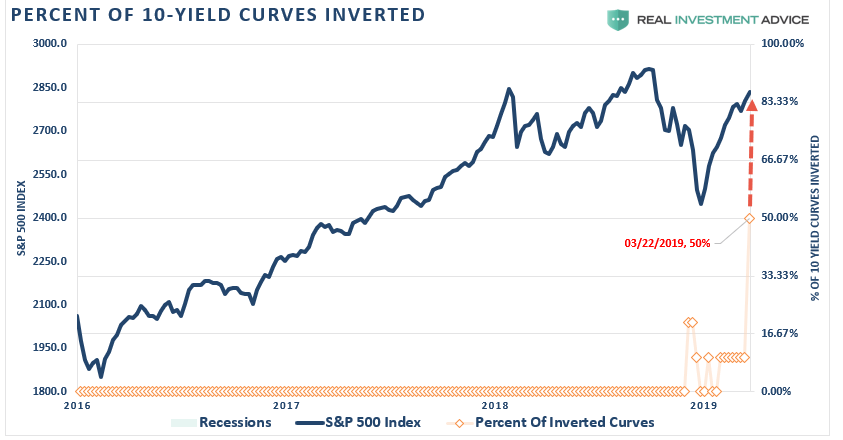
This time is unlikely to be different.
今回も違いそうには無い。
More importantly, with economic growth running at less than 1/2 the rate of the previous two periods, it will take less than half the amount of time for the economy to slip into recession.
もっと大切なことは、過去二回のときよりも経済成長速度は1/2以下であり、景気後退に滑り落ちるまでの時間は半分以下となるだろう。
While I am not suggesting you sell everything and go to cash today, history is pretty clear that you will likely not miss much if you did.
私は今すぐ全てを売って現金化しろと入っていないが、しかしながら歴史を見ると明らかだが、現金化することで多くを失うことはなさそうだ。
What Can You Do?
みなさんのできることは?
ここからさらに相場が上昇することを否定はしない、特に短期的にはそれを否定しない。この疑問には先週こう答えた:
“Are we going to hit new highs you think, or is this a setup for the real correction?”「これから新高値となるだろうか、それとも本当の調整が待ち構えているだろうか?」
The answer is “yes” to both parts.
答えはどちらも「イエス」だ。
The mainstream media’s advice is simply:
主要メディアのアドバイスはシンプルなものだ:
“Since you don’t know when a bear market will start, you just have to ride it out.”「いつベア相場が始まるかわからないのだから、それに乗るしか無い。」
This is the problem with the mainstream media and the majority of the financial advice in the world today.
これこそ主要メディアの問題だ、そして現在の世界中の金融アドバイザの多数はこういう姿勢だ。
It is not required that you know precisely when one market cycle ends and another begins.
正確に市場のサイクルの終わりと始まりを知る必要はない。
Investing isn’t a competition. It is simply a game of survival over the long-term. While it is critically important we grow wealth while markets are rising, it is NOT a requirement to obtain every last incremental bit of gain there is. Staying too long at the poker table is how you leave broke.
投資は競争ではない。それは単に長期的な生き残りゲームに過ぎない。相場が上昇するときに資産を増やすのは大切なことだが、上昇の最後の最後まで追跡する必要はない。賭場のテーブルに長居をすると身の破滅を招く。
We wrote in early 2018 the bull market had come to its conclusion for a while. That correction process is still intact as shown in the chart below.
2018年始めに私どもが書いたが、やがてブル相場にも終りが来る。下のチャートを見ればわかるがその調整プロセスはまだ生きている。
There are three important things worth pointing out:
このチャートで大切なことが3つある:
- The top panel is GAAP earnings (what companies REALLY earn) and nominal GDP.
上部のGAAP会計収益(企業の本当の収益)と名目GDPだ。 - The black vertical line is when the markets begin to “sniff out” something is not quite right.
黒の縦線は市場がなにか普通でないことを「嗅ぎ取った時」を示す。 - The red bars are when “expectations” are disappointed.
赤い帯は「期待」が失望に変わる時期だ。
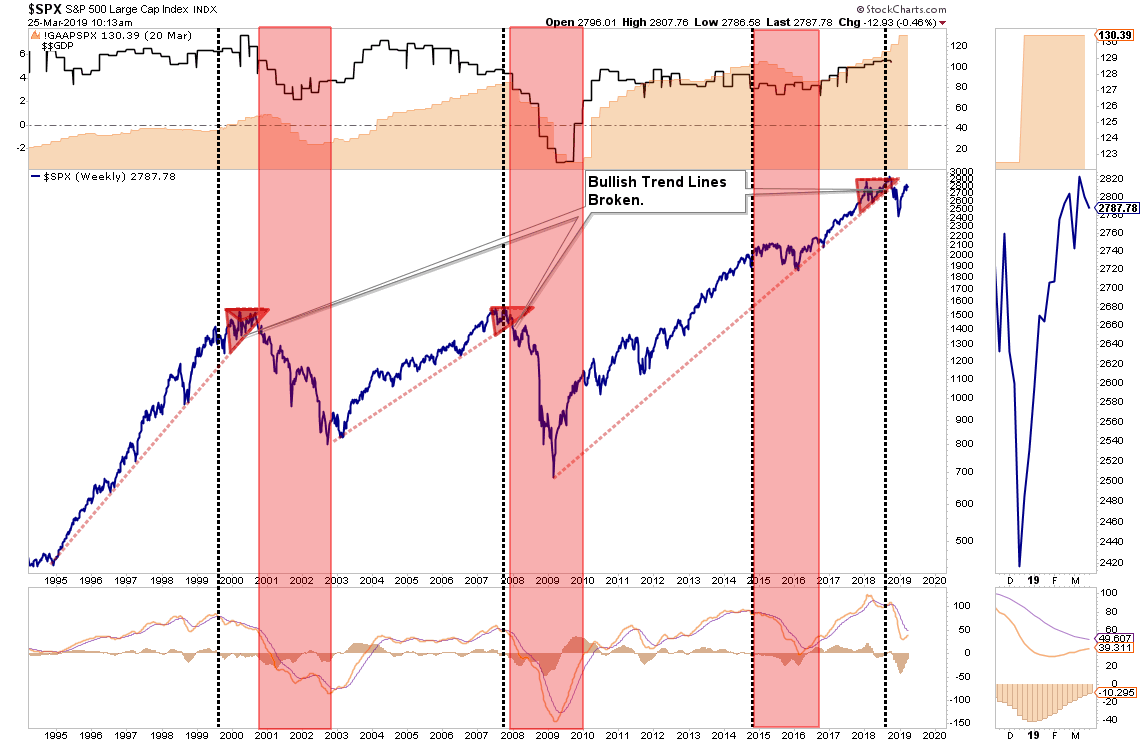
Pay attention to these longer-term trend changes as historically they signify bigger issues with the market.
歴史的に見た相場の大きなできごとで、長期トレンドの変化が起きる時に注意してほしい。
It is unlikely this time is different. There are too many indicators already suggesting higher rates are impacting interest rate sensitive, and economically important, areas of the economy. The only issue is when investors recognize the obvious and sell in the anticipation of a market decline.
どれも、今回は違う、というものでなさそうだ(二重否定表現です)。すでにあまりの多くの示唆があり、金利上昇が多くの経済分野に影響を与えている。問題は、いつ投資家がこの影響を明確に認識し相場下落を懸念して売り始めるかということだ。
The yield curve is clearly sending a message which shouldn’t be ignored and it is a good bet that “risk-based” investors will likely act sooner rather than later. Of course, it is simply the in liquidity that causes the decline which will eventually exacerbates the economic contraction. Importantly, since recessions are only identified in hindsight when current data is negatively revised in the future, it won’t become “obvious” the yield curve was sending the correct message until far too late to be useful.
イールドカーブは明確なメッセージを発しておりこれを無視すべきではない、そして「リスク管理」をする投資家は遅かれ早かれこれに応じるものだ。当然のことながら、流動性低下が株価下落を引込し、やがて経済収斂を引き起こすだろう。大切なことは、景気後退の認識は後知恵であり、のちほど経済データをみて判定するのだ、もう役に立たなくなるほど時間が立ってからイールドカーブが教えてくれるものはもう「明らか」なんて言えなくなる。
While it is unwise to use the “yield curve” as a “market timing” tool, it is just as unwise to completely dismiss the message it is currently sending.
「イールドカーブ」を「相場のタイミング指標」として使うのは賢い方法ではない、しかしながら、現在発しているメッセージを全く無視するのも賢明ではない。
See you next week.
また来週。