“The phenomenon of extreme differences is also increasingly appearing in financial numbers, which are the life blood of markets. Andrew Smithers conducted research on the usefulness of accounting numbers and his work was summarized by Jonathan Ford. ‘Corporate data now provide worse information than before.’ The ironic consequence of all this is that investors
increasingly rely on non-Gaap numbers for valuation. These are not only
idiosyncratic, and thus not always capable of comparison, they are also
devised by bosses whose views may well be richly coloured by their own
outsize incentives.’
Henny Sender highlights some prominent examples of “unusual measures of corporate performance.” Specifically, she mentions “gross merchandise value” as a metric commonly used by e-commerce firms and “community adjusted” earnings which is a controversial metric recently introduced by WeWork.
Henny Senderはいくつかの特異的に目立つ点を例としてあげる、「企業業績の異常な評価手法」。特に彼女が取り上げるのが「gross merchandise value 総取引額」だ、eコマース企業でよく取り上げられ、WeWorkが最近導入して論争のもととなる「community adjusted」収益だ。
The entire article is a great read. However,
what struck a cord with me was it brought up the memories of the late
1998-2000 bull market run when start up-IPO internet companies were
being valued with “eyeballs per page” since most traditional measures of profitability, such as cash flows, earnings, and revenue were non-existent.
この記事全文を読むことを勧める。しかしながら、私が共感したことだが、1998−2000のブル相場でIPO企業の評価において「eyeballs per page 驚くような」バリュエーションをしているのを思い起こした、多くの伝統的バリュエーション指標は、会計利益、営業利益、売上だが、こういうものが全く用いられなかった。
I know…most of you reading this article probably weren’t investing in
the late 90’s, however, the few of you who were in the trenches with me
will remember it all to well. Names like Enron, Worldcom, Global Crossing, Lucent Technologies, and a vast graveyard of others have long been forgotten and are now ancient artifacts of an age gone by.
Much like then, today we see companies going public like Lyft,
Uber, Instagram, and others who have massive cash burn rates, little to
no prospect for profitability in the near future, and astronomical
valuations. Companies that are public, like Facebook (FB), are valued on “Monthly Average Users” or “MAU’s” which is highly suspect given that studies have suggested that as much as 50% of Facebook, Twitter, and YouTube’s users may be “fake.” Further,
there is no verification process for what constitutes a valid account
and as such, the stats are mostly just taken at the companies word.
Importantly, the point is that creative use of new “metrics” are being used to justify valuations to satiate investor appetites.
当時と同様に現在IPOする企業の多く、Lyft, Uber , Instagram等々、は巨額の赤字を垂れ流している、短期間の黒字化はほとんど見込めない、バリュエーションは天文学的なものだ。Fecebookのようにすでに上場した企業では「Monthly Average Users 月次利用者数」「MAU」で評価される、ところがFacebook、Twitter そしてYouTube利用者の半数は「フェイク」でると見られている。更に言うと、有効なアカウントとはなにかの定義も不明確で、利用者数自身も運用会社の発表だ。大切なことは、投資家を引きつけるように新たな「バリュエーション指標が」作り出されていることだ。
Much like the late 1990’s, no one “really” wants to know the real answer, they just want to buy high and sell higher.
“The potential to create a very misleading impression of
financial condition with alternative metrics was the subject of a report
on the cloud software industry in the FT’s Alphaville. The article highlights the fact that the average free cash flow margin for the cloud companies is 8.6% which is impressive. However, that margin falls to a far less impressive -0.6% when the real expenses of stock compensation are included.
At the end of the day, alternative metrics like these are better designed to tell stories than to provide information content. Sender
notes, rightly, that such alternative measures “are no substitutes for
profits or a path to them.” As the Alphaville report also points out,
however, ‘Investors don’t seem to care that much.’”
I just recently reviewed the latest completed earnings season (Q4).
As has become the norm, companies once again beat drastically lowered
earnings estimates with a variety of measures. To wit:
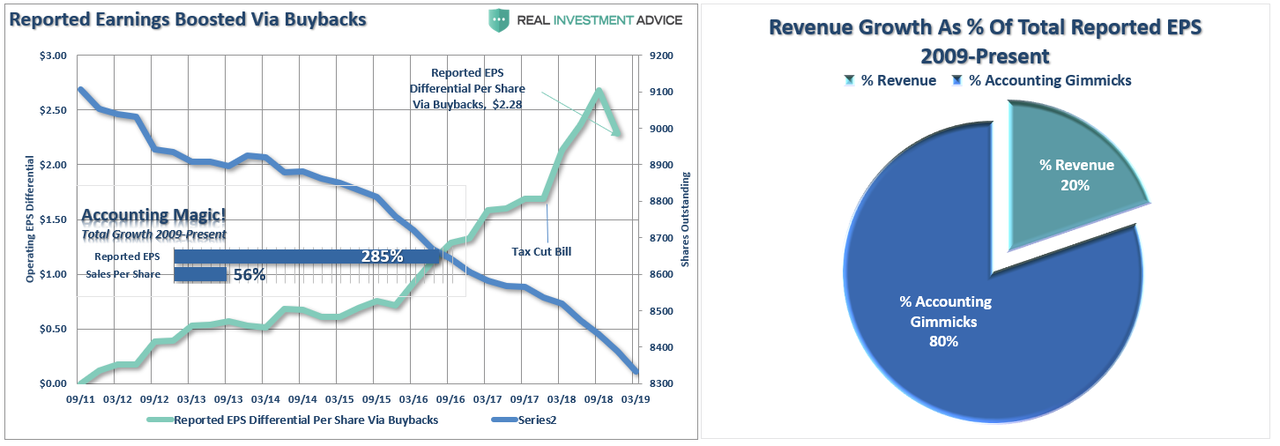
“Since the recessionary lows, much of the rise in “profitability” have come from a variety of cost-cutting measures and
accounting gimmicks rather than actual increases in top-line revenue.
While tax cuts certainly provided the capital for a surge in buybacks,
revenue growth, which is directly connected to a consumption-based
economy, has remained muted.
Since 2009, the reported earnings per share of corporations has decreased from 353% in Q2-2018 to just 285% in Q4. However, even with the recent decline, this is still the sharpest post-recession rise in reported EPS in history.
Moreover, the increase in earnings did not come from a
commensurate increase in revenue which has only grown by a marginal 56%
during the same period. (Again, note the sharp drop in EPS despite both tax cuts and massive share buybacks. This is not a good sign for 2019.)”
The reality is that stock buybacks create an illusion of profitability. Such
activities do not spur economic growth or generate real wealth for
shareholders, but it does provide the basis for with which to keep Wall
Street satisfied and stock option compensated executives happy.
However, the recent downturn in corporate profitability may be more than just due to an economic “soft patch” as currently suggested by the majority of Wall Street analysts. The
problem with cost cutting, wage suppression, labor hoarding and stock
buybacks, along with a myriad of accounting gimmicks, is that there is a
finite limit to their effectiveness and a long term cost that must
eventually be paid.
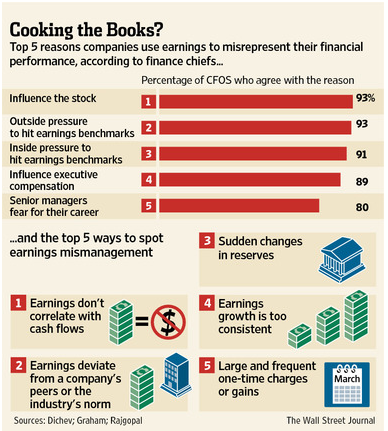
Wall Street is well aware that “missing earnings,” even by
the slightest margin, can have an extremely negative impact on their
current share price. As such, it should come as no surprise that
companies manipulate bottom line earnings to win the quarterly “beat the estimate” game. By utilizing “cookie-jar” reserves, heavy use of accruals, and other accounting instruments they can mold earnings to expectations. たとえほんの少しでも「収益不足」となると現愛の株価にマイナス影響があることをWall Streetはよく理解している。そのために、企業が決算書最下段の収益を操作して毎四半期「予想超えゲーム」をするのももっともだ。「cookie-jar お菓子箱」準備金を利用して、大きく利益を増やしたりその他会計手法で収益が予想を上回ることができる。
“The tricks are well-known: A difficult quarter can be made
easier by releasing reserves set aside for a rainy day or recognizing
revenues before sales are made, while a good quarter is often the time
to hide a big ‘restructuring charge’ that would otherwise stand out like
a sore thumb.
What is more surprising though is CFOs’ belief that these
practices leave a significant mark on companies’ reported profits and
losses. When asked about the magnitude of the earnings misrepresentation, the study’s respondents said it was around 10% of earnings per share.“
It should not be surprising that more than 90% of the companies surveyed pointed to “influence on stock price” and “outside pressure” as reasons for manipulating earnings.
“Those record profits that companies are reporting may not be all they’re cracked up to be. As the stock market climbs ever higher, professional investors
are warning that companies are presenting misleading versions of their
results that ignore a wide variety of normal costs of running a business
to make it seem like they’re doing better than they really are. What’s worse, the financial analysts who are supposed to fight corporate spin are often playing along. Instead
of challenging the companies, they’re largely passing along the rosy
numbers in reports recommending stocks to investors.“
Seventy-two percent of the companies reviewed by AP had adjusted profits that were higher than net income in
the first quarter of this year. That’s about the same as in the
comparable period five years earlier, but the gap between the adjusted
and net income figures has widened considerably: adjusted earnings were
typically 16 percent higher than net income in the most recent period
versus 9 percent five years ago. APが確認した企業の72%で収益を調整しており今年Q1の実際の収入よりも大きかった。5年前の調査と同様だった、しかしネット収入と調整後の数字の乖離はかなり大きくなっている:5年前には乖離が9%程度だったのに今回の調査では16%も乖離している。
For a smaller group of the companies reviewed, 21 percent of the total, adjusted profits soared 50 percent or more over net income. This was true of just 13 percent of the group in the same period five years ago. 全体の21%の企業では調整後の収益はネット収益の50%も大きいものだった。5年前にはこういう企業の割愛は13%しかなかった。
Quarter after quarter, the differences between the adjusted and bottom-line figures are adding up. From 2010 through 2014, adjusted profits for the S&P 500 came in $583 billion higher than net income. It’s as if each company in the S&P 500 got a check in the mail for an extra eight months of earnings. 何四半期にもわたり、調整され決算書最下段の収益が積み増されていた。2010年から2014年までで、S&P500全体の調整利益は実際よりも$583Bも大きかった。S&P500各社がさらに8か月の収益を積み上げたようなものだ。
Fifteen companies with adjusted profits actually had bottom-line losses over the five years. Investors have poured money into their stocks just the same. 調整ご利益を上げていた会社のうち15社では実際には5年に渡り決算書最下段の収益は損失だった。投資家はこういう企業にお金を注ぎ込んでいた。
Stocks are getting more expensive, meaning there could be a
greater risk of stocks falling if the earnings figures being used to
justify buying them are questionable. One measure of how richly priced
stocks are suggests trouble. Three years ago, investors paid
$13.50 for every dollar of adjusted profits for companies in the S&P
500 index, according to S&P Capital IQ. Now, they’re paying nearly
$18. 株価がさらに上昇し、買いを正当化していた収益に疑念が持たれると大きな下落リスクがある。株価が高く評価されていたことが問題を示唆している。3年前に、投資家はS&P500指数を構成する銘柄の収益1ドルあたり$13.50を支払っていた、S&P Capital IQによるデータだ。今や投資家は$18ドルを支払っている。
The obvious problem, when it comes to investing in individual companies, is that playing “leapfrog with a unicorn,”pun
intended, ultimately has very negative outcomes. While valuations may
not matter currently, in hindsight it will become clear that such
valuation levels were clearly unsustainable. However, by the time the
financial media reports such revelations it will be long after it
matters to anyone.
As David noted in his article, it is important to be aware of the difference, and ultimately what constitutes, “Fantasy”and “Reality.”Most portfolio managers are using valuation measures today based on recent 5- or 10-year averages, or worse, forward “operating earnings.” They will be unpleasantly surprised by the depth of the reversion when it eventually comes.
Distorted Expenses:If a $10 million
manufacturing plant is expected to last 10 years, then the depreciation
expense should be $1 million per year. If for some reason the Chief
Financial Officer (CFO) suddenly decided the building would last 40
years rather than 10 years, then the expense would only be $250,000 per
year. Voila, an instant $750,000 annual gain was created out of thin air
due to management’s change in estimates.
Magical Revenues:Some companies have been
known to do what’s called ‘stuffing the channel.’ Or in other words,
companies sometimes will ship product to a distributor or customer even
if there is no immediate demand for that product. (Think Autos) This
practice can potentially increase the revenue of the reporting company,
while providing the customer with more inventory on-hand. The major
problem with the strategy is cash collection, which can be pushed way
off in the future or become uncollectible. 魔法のような収益:企業によっては「stuffing the channel 押し込み販売」という方法で売上を水増しすることがある。言い換えると、直ぐに注文がないにもかかわらず、販売業者や顧客に製品を発送するのだ。(自動車会社が良い例だ)こうすることで売上を増やすことができる、一方で顧客は在庫を手元に積み上げる。この方法の問題は現金回収だ、回収が先延ばしになるか回収不能になることもある。
Accounting Shifts:Under certain circumstances,
specific expenses can be converted to an asset on the balance sheet,
leading to inflated EPS numbers. A common example of this phenomenon
occurs in the software industry, where software engineering expenses on
the income statement get converted to capitalized software assets on the
balance sheet. Again, like other schemes, this practice delays the
negative expense effects on reported earnings. 会計回避:特定の環境では特定の費用をバランスシートの資産に移し替えることができる、これがEPSを膨れ上がらせる。ソフトウエア産業ではこういうことがよく起きる、ソフトウエア開発費用は本来収入項目にあるものだが、これがバランスシートの資産項目に計上される。繰り返すが、他の手法と同様にこういうほうほうで収益報告でのマイナス項目発生を遅らせることができる。
Artificial Income:Not only did many of the
troubled banks make imprudent loans to borrowers that were unlikely to
repay, but the loans were made based on assumptions that asset prices
would go up indefinitely and credit costs would remain freakishly low.
Based on the overly optimistic repayment and loss assumptions, banks
recognized massive amounts of gains which propelled even more imprudent
loans. That said, relaxation of mark-to-market accounting makes it even
more difficult to estimate the true values of assets on the bank’s
balance sheets. 人工的な収益創生:問題を抱えた銀行だけではないが、回収できそうもない不良債権を作る、しかしこのローンは資産評価が永遠に上がり続けるという仮定で作られ与信コストはほんの僅かなままにしておく。過剰に楽観的な返済計画と損失評価で、銀行は巨額の利益を見込みさらなる不良債権を作り出す。言わば、時価評価基準を大幅に緩和してバランスシート内の本当の価格評価を更に難しくする。
These points are more valid today than they were then. The
abuses to financial statements to meet earnings estimates have continued
to grow. However, most investors don’t look beyond the media headlines
before click the “buy” button on the latest “bull call de jour” on CNBC.
However, for longer term investors who are depending on their “hard earned” savings to generate a “living income” through retirement, understanding the “real” value
of a stock will mean a great deal. Unfortunately, there are no easy
solutions, on-line tips or media advice will not supplant rolling up
your sleeves and doing your homework.
Investors would do well to remember the words of the then-chairman of
the Securities and Exchange Commission Arthur Levitt in a 1998 speech
entitled “The Numbers Game:”
投資家は当時のSEC議長 Arthur Levittが1998年の講演「数当てゲーム」で言った言葉をよく覚えておくことだ:」
‘While the temptations are great, and the pressures
strong, illusions in numbers are only that—ephemeral, and ultimately
self-destructive.’”
「誘惑は大きく、圧力は強いが、数字の幻想はーー刹那的なもので必然的に身の破滅を招く。」
The reality is that this “time is NOT different.” The
eventual outcome will be the same as every previous
speculative/liquidity driven bubble throughout history. The only
difference will be the catalyst that eventually sends investors running
for cover.
現実はこうだ、「this time is NOT different」。やがてくる結末というものは、これまでのどの投機的/流動性バブルとも同じものだ、それは過去の歴史を振り返れば解ることだ。唯一の違いはそのキッカケだけだろう、これが起きると投資家はもう取り戻しがつかない。
Amazonで買物をしてContrarianJを応援しよう Silver Outperforming Gold 2 Adam Hamilton July 26, 2019 3232 Words Silver has blasted higher in the last couple weeks, far outperforming gold. This is certainly noteworthy, as silver has stunk up the precious-metals joint for years. This deeply-out-of-favor metal may be embarking on a sea-change sentiment shift, finally returning to amplifying gold’s upside. Silver is not only radically undervalued relative to gold, but investors are aggressively buying. Silver’s upside potential is massive. ここ2週シルバーは急騰した、ゴールドを遥かに凌ぐものだ。これは注目すべきことだ、もう何年もシルバーはひどいものだった。この極端に嫌われた金属が大きく心理を買えている、とうとうゴールド上昇を増幅するに至った。シルバーは対ゴールドで極端に過小評価されているだけでなく、投資家は積極的に買い進んでいる。シルバーの潜在上昇力は巨大なものだ。 Silver’s performance in recent years has been brutally bad, repelling all but the most fanatical contrarians. Historically silver prices have been mostly ...
結局、中国は隣国日本で20年前に起きたことを学んでいなかったということでしょう、というかどの国もどの政府も十分成熟するまでは「わかっちゃいるけどやめられない」ということでしょうね、きっと。 Spooked By Apple? Wait ‘Til China’s Bubble Bursts Written by Jesse Colombo | Jan, 3, 2019 Apple stock plunged nearly 10% on Thursday after the company cut its revenue forecast due to slowing iPhone sales in China. Apple’s woes dragged U.S. stock indices lower by more than 2% as fears of a more extensive China-driven slowdown spread. アップルの株価は火曜に約10%下落した、同社が中国でのiPhone売上原則を予想したためだ。アップルの弱さが米国株式指数を2%以上押し下げた、中国主導でさらなる原則が広がるのではという懸念からだ。 From the New York Times : ニューヨークタイムスによると: For years, no matter what was happening elsewhere, global companies bet billions upon billions of dollars that China’s consumers would keep spending money. 長年、他国で何が起きようとも多国籍企業は中国消費は巨額を維持することに賭けてきた。 Now, just when the world economy could use their financial firepower, they are no longer so quick to open their wallets. 今や、世界経済が金融弾薬を用いてももはや彼らの財布を緩めることはできない。 The latest sign of a slowdown in...
多量のオピオイドを米国に送り込み、米国で深刻な麻薬中毒問題を引き起こしています。現代版「阿片戦争」です。あのトヨタ初の女性取締役もオピオイド中毒で逮捕解任されましたよね。 US Is Dependent On China For Almost 80% Of Its Medicine by Tyler Durden Fri, 05/31/2019 - 12:55 Experts are warning that the U.S. has become way too reliant on China for all our medicine , our pain killers, antibiotics, vitamins, aspirin and many cancer treatment medicine. 専門家はこう警告する、米国はすべての医薬品、痛み止め、抗生物質、ビタミン、アスピリン、各種抗がん剤で、中国依存度が高すぎる。 Fox Business reports that according to FDA estimates at least 80 percent of active ingredients found in all of America’s medicine come from abroad, primarily from China . And it’s not just the ingredients, China wants to become the world’s dominant generic drug maker. So far Chinese companies are making generic for everything from high blood pressure to chemotherapy drugs. 90 percent of America’s prescriptions a...
Barrick’s average quarterly production since Q4’16 plunged an astounding 8.6% YoY. The reason Barrick’s management blew $6.5b in stock buying Randgold is they desperately needed more production to mask the precipitous drop in their own. Barrick’s total 2018 production of 4525k ounces was 18.0% below the 5516k it mined only a couple years earlier in 2016. At best adding Randgold just regains those losses. Barrickの平均四半期生産は2016Q4以来なんとYoYで8.6%下落している。Barrickの取締役が$6.5Bも投じてRandgoldの株式を購入した理由は、彼らはなんとしても急落する自らの生産量を隠すために生産量増加としたかったからだ。Barrickの2018全生産量は4525Kオンスで、わずか2年前の5516kオンスから18.0%も少ない。Randgoldを買収したところでこの下落を補うに過ぎない。 And GOLD has been suffering the same production struggles as ABX. Over its past 4 reported quarters, Randgold’s gold mined has fallen an average of 7.4% YoY. Can bringing two rapidly-depleting major gold miners together magically make a stronger one? I doubt it. Barrick’s reported production will enjoy a big temporary boost...
S&P Surges To Key Technical Level - Now What? by Tyler Durden Tue, 02/12/2019 - 12:03 Having failed twice last week, the S&P 500 is once again testing its 200DMA as hopes of a border/shutdown deal, a lack of collusion, China trade dreams, and an easy Fed are prompting stocks to new post-Xmas dip highs... 先週二回失敗し、S&P500がまたもや200日移動平均に挑戦している、国境の壁/政府閉鎖問題解決、ロシア疑惑解消、中国貿易改善そしてFEDのハト派姿勢、これらがクリスマス下落後の高値を推進している・・・ The S&P 500 is at its highest since Dec 4th... S&P500は12月4日以来の高値だ・・・ What happens next? では次はどうなる? Earnings recession? Meh, don't worry about it... 収益による景気後退? 別に心配することではない・・・・ Oh and don't worry - Fed Chair Powell just told everyone that he "doe...