The year-to-date rally in global risk assets after the Fed flip appears to us to be a last gasp of speculative mania for the current economic cycle.
FEDが姿勢反転して以来の年初来の世界的リスク資産のラリーは驚くほどの投機的行為であり、現在の景気サイクルで最後のものだ。
In our view, three flawed narratives are driving late-cycle euphoria in financial markets today:
“Central banks can always prevent a downturn in financial markets and the business cycle”;
「中央銀行がいつでも金融市場やビジネスサイクルの下落を阻止できる」;
“US stocks valuations remain attractive”; and
「米国株式のバリュエーションはまだ魅力的だ」;そして
“Chinese stimulus and a US-China trade deal will reignite growth in the second half of 2019.”
「中国の経済刺激政策と米中貿易交渉の結果2019年後半に成長を促進する。」
We believe that the first two storylines are simply wrong. We show why herein.
私どもは最初の2項目は全く間違っていると信じている。その理由をこの記事で明らかにしよう。
Regarding the third, in our view, China is much more likely to tank the world economy over the next several quarters than rescue it given the historic credit imbalances there, which we also explain below.
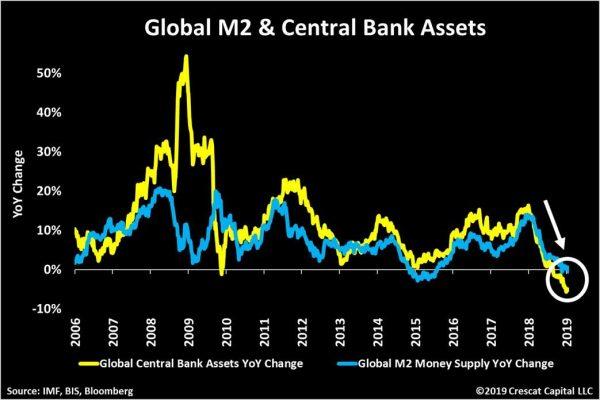
There has been a huge misconception that global central bank
liquidity is what is driving stock prices up today. Our work shows that
both global M2 money supply and central bank assets have been
contracting on a year-over-year basis so far in 2019. That tells us
liquidity has not been the driver of the current market-top-retest
rally; hope has been.
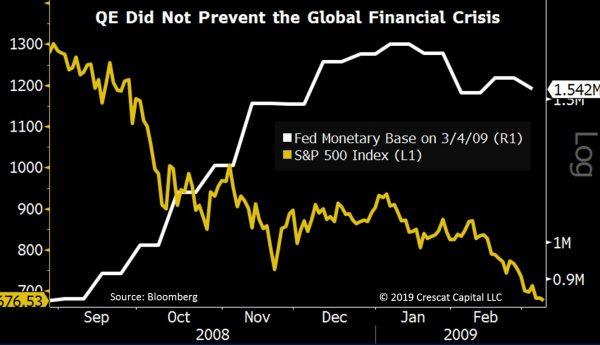
But even when global QE returns, it is likely to be no saving grace.
As shown above, starting in September 2006 led by China, global central
banks increased their balance sheets by $3.9 trillion or more than 50%
through March of 2009. This unprecedented level of money printing did
not prevent the Global Financial Crisis. Rather it preceded and
accompanied it.
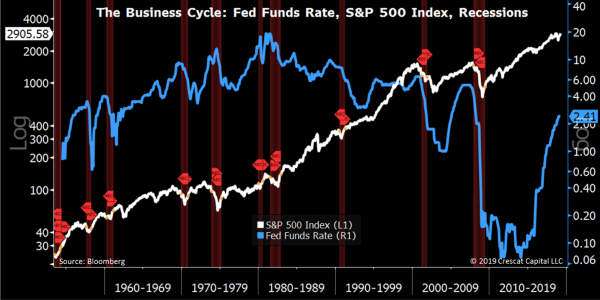
The same goes for the Fed’s past changes in interest rate regimes
from hiking to easing which are much more often bearish than bullish for
stocks. As we show in the chart below, there were twelve times since
1954 (the history of the Fed Funds) that the US central bank paused its
interest rate hiking cycle and then reversed it. Only three of those
reversals ended in soft landings (1966, 1984, and 1995). In contrast,
nine were associated with stock market downturns that led to recessions.
We believe the three soft landings were possible because they occurred
early in the business cycle, an average of only three years into the
expansion. The Fed’s December 2018 hike followed by a pause, on the
other hand, occurred a record 9 1/2 years into the economic expansion,
exceeding the last hike at the peak of the tech bubble by one quarter!
Of the nine pauses associated with market downturns and recessions, the
economic contraction began an average of just five months from the date
of the last rate hike. That would be next month if this is the average
delay! But we likely won’t know officially when the next recession
begins, as typical, until months after it has started when
prior-reported economic data gets revised downward.
It is also important to note that the stock market peak associated with the nine recessions occurred an average of two months before the
last Fed rate hike. The September 2018 market peak, therefore which we
are re-testing though still shy of, could still be relevant; it was
three months before the Fed’s last hike. Even if the market pushes
marginally higher here, it will still be very likely that we are near a
top based on Crescat’s work.
It is also important to note that none of the historical corrections
and bear markets that surrounded late-cycle Fed rate reversals bottomed
until after the economy entered the recession. It seems highly prudent
therefore to wait until the next inevitable recession which may be right
around the corner before buying stocks today.
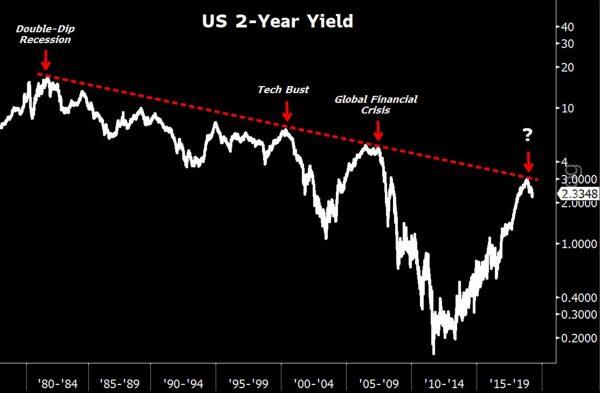
Another good macro timing signal for the peak of the stock market and
business cycle is when the credit markets start pricing in Fed
rate-cuts late in the expansion. That has never been a bullish sign. As
shown in the chart below, every prior time the 2-year yield started to
fall after re-testing a multi-decade resistance line going back to 1980,
a major bear market and recession followed. Will this time be any
different?
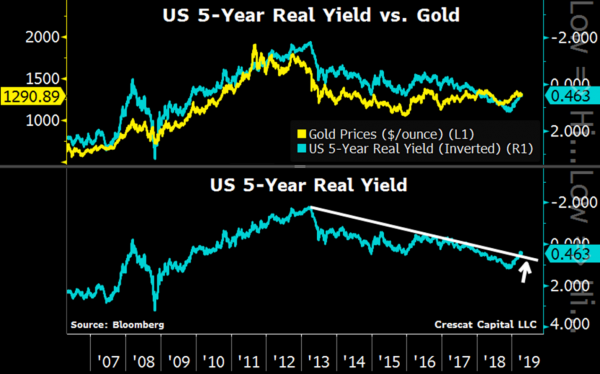
The recent drop in nominal rates is also causing a drop in real
yields. Below we show a multi-year breakout of the 5-year TIPS,
inverted, which reflects the real interest rate. Real rates have
followed gold prices remarkably closely for years. If this pattern
holds, even if inflation expectations remain muted, the decline in
nominal rates should be positive for gold, especially at today’s
historically low valuation relative to the global fiat monetary base.
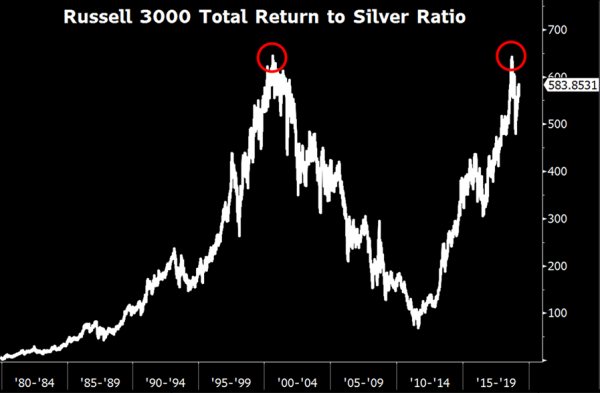
It’s stunning to us to see the historically depressed valuation of
silver – gold’s safe-haven cousin – this late in the cycle. An
interesting way to see silver’s valuation imbalance is to compare it to a
broad US stock index. Below, we show the Russell 3000-to-silver ratio
near record levels. It formed what appears to be a double top after
retesting tech-bubble-peak levels last year.
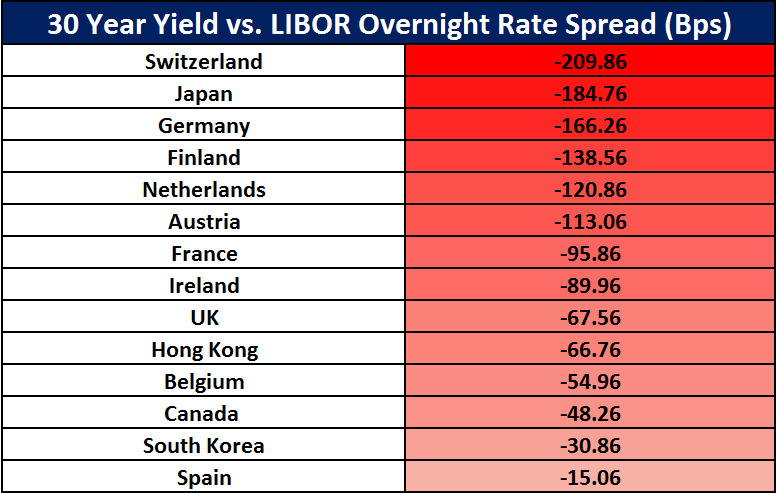
As we noted before, today we have an unprecedented amount of
economies with 30-year yields lower than LIBOR overnight rates. Spain
just joined the pack recently and we now have fourteen economies showing
this negative spread. For us, it reiterates Crescat’s global yield
curve inversion thesis, which is negative for global stocks and positive
for future inflows into US dollars, and US Treasuries by extension, as
haven assets in a global financial crisis. The fact is, US yields across
the entire curve today are attractively high compared to many global
developed market alternatives.
When financial crises have unfolded in the past, US rates have tended
to converge with global rates. Therefore, we expect many of these yield
spreads to narrow significantly as the global economic cycle turns
down.
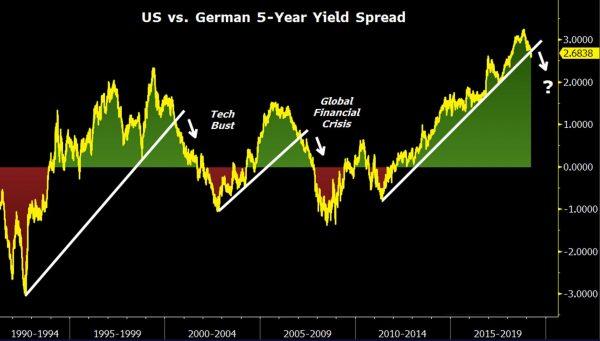
US vs. German 5-year yield spread just broke down from a multi-year
support line! Previous breakdowns timed the market top in 2000 &
2007. It’s another critical macro timing indicator.
米国 vs. ドイツ 5年物国債金利スプレッドは数年に渡るサポート線をちょうど超えたところだ!前回このブレークダウンが起きた時市場は天井を打った、2000と2007年のことだ。これは重要なマクロタイミング指標だ。
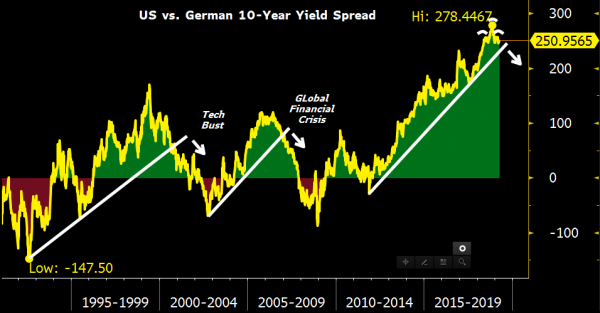
The US-German 5-year yield spread breakdown is possibly leading a big
move that is likely to happen on 10-year spread. In our global macro
hedge fund, we are long US 10-year Treasuries and short 10-year German
Bunds to play the likely breakdown and narrowing of that spread as shown
in the chart below. The legendary former bond king, Bill Gross, was too
early in this trade. It got away from him, but it was still a good
idea. The trade is now lining up with so many of our other macro timing
indicators that we believe the spread is finally getting ready to
converge. A classic head-and-shoulders pattern meanwhile appears to have
formed over the last year, a bearish technical set up.
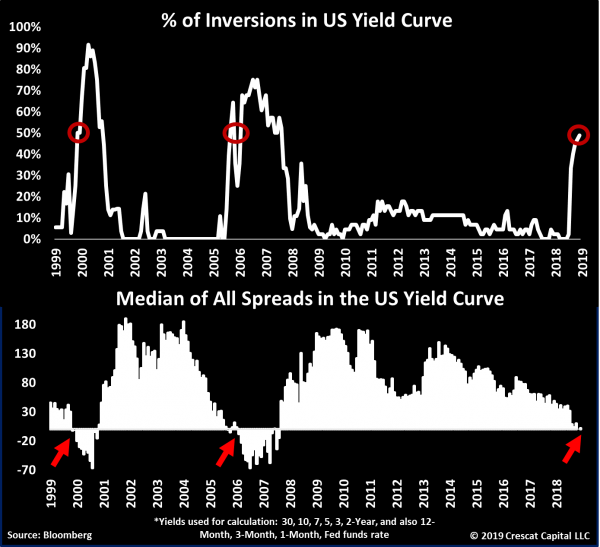
Below is our comprehensive way of measuring inversions in the US
yield curve. This model calculates all possible 44 spreads across US
rates, and the percentage is now close to 50%, just as high as it was at
the peak of the tech and housing bubbles. Historically, these elevated
levels of inversions tend to be great times to own precious metals and
sell US stocks.
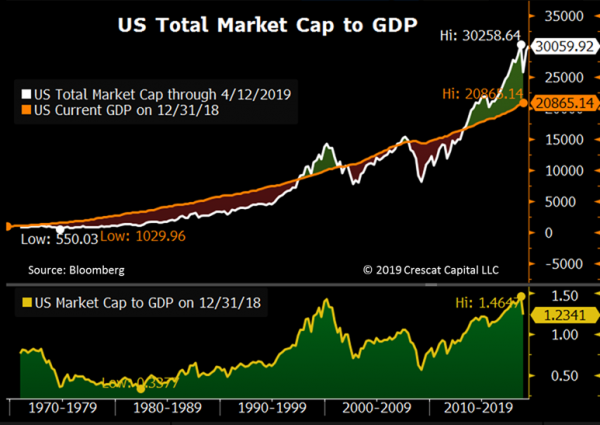
The recent surge in stocks has pushed valuations back near all-time
highs. Below, we show that the total US market cap-to-GDP ratio reached
its highest ever last September at 1.46 prior to the 4th quarter market
meltdown as measured by the Wilshire 5000 Index. This measure is close
to re-testing its highs again today! The first panel of the chart below
illustrates how the total US equity market capitalization tends to
fluctuate above and below GDP across economic cycles. In the second
panel, we can clearly see that valuations in this cycle went even higher
than in the tech bubble. A multiple of 1.00 relative to GDP tends to be
the median valuation over time. But valuations rarely stop at the
median during bull and bear market cycles as the chart clearly shows.
The truth is, the total US stock market’s estimation of its underlying
business net worth is as stretched as it has ever been.
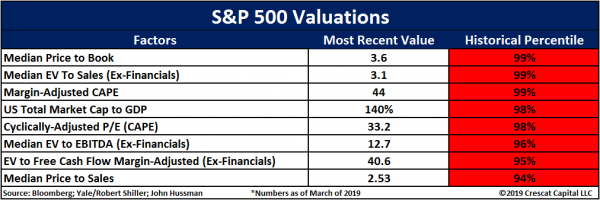
But total market cap to GDP is just one example of US stock market
valuations at historic extremes. Crescat’s models show that record or
near-record valuations were hit on September 2018 across at least eight
valuation measures. In the table below, we show seven additional
valuation extremes today relative to the S&P 500 Index with values
updated through March. We are essentially only re-testing the September
2018 valuation highs today in April:
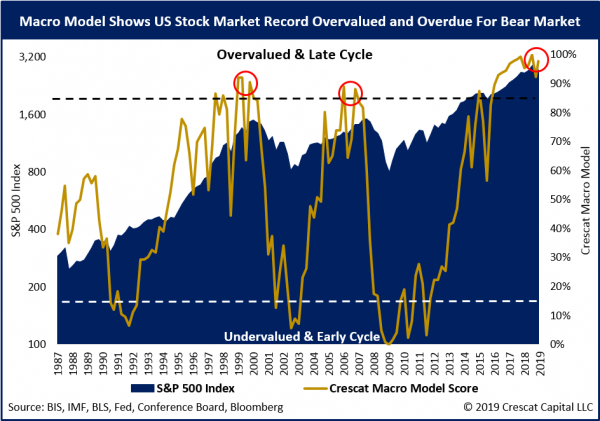
Crescat’s macro model combines sixteen factors across key
fundamental, economic, and technical indicators to time the US stock
market and business cycle. After the year-to-date rally, the model is
just two percentage points from record overvalued and record late-cycle
levels! The yellow line below shows a backtest of our model score going
back to 1987. The model did extremely well at timing the tops and
bottoms of the last two US stock market and business cycles. This time,
the S&P 500 briefly entered overvalued/late-cycle levels in
September of 2015 and was followed by a meltdown in China and emerging
markets that Crescat capitalized on in 2015. A pause in 2016 in Fed
interest rate hikes gave emerging and developed markets a new lease to
extend the global business cycle. As hikes resumed in 2017, the market
and our macro model score only surged to new highs. In September 2018,
we reached what we believe were and still are truly mania levels.
We strongly believe US stocks are overdue for a bear market and the
time of reckoning is near. The bear market started to unfold in the
fourth quarter of last year in our view. But now we are retesting the
September highs. Based on Crescat’s macro model score, and a myriad of
other indicators, there is a strong probability that this rally will
soon fail and that the bear market will resume.
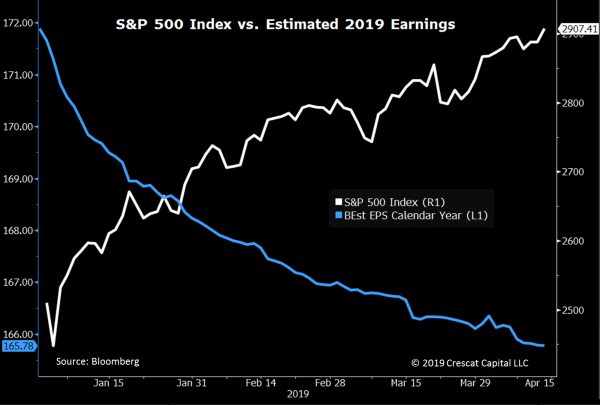
It’s interesting to us how surging US stocks are in complete
disconnect with the deteriorating fundamental outlook. Earnings
estimates for 2019 in fact have been plunging all year while diverging
significantly from sharply rising equity prices. This is not a positive
set-up for stocks as we start the Q1 earnings season.
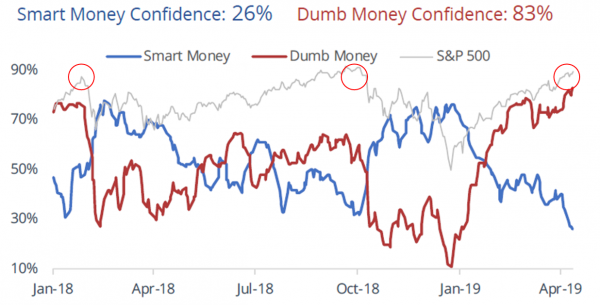
The recent stock market rally has remarkably similar fingerprints to
the January 2018 and September 2018 speculative tops as shown by the two
charts below courtesy of Jason Goepfert at sentimenTrader.com.
Jason’s smart versus dumb money indicators incorporate OEX put/call
and open interest ratios, commercial hedger positions in equity index
futures, and the current relationship between stocks and bonds. The
smart-money indicator is currently near its lows while the dumb money
one is near its highs. A similar wide spread between these two
indicators preceded the market’s two steep selloffs last year.
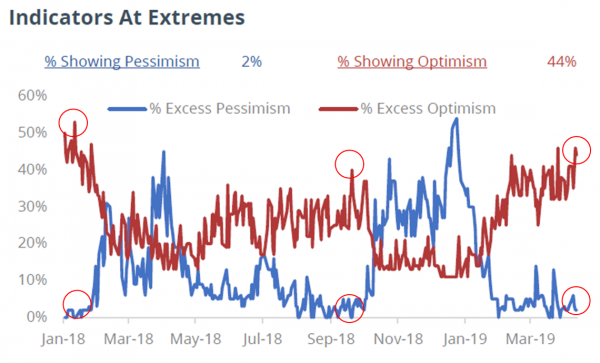
SentimenTrader also tracks 60+ market indicators and tallies the
percentage of them showing extreme optimism versus extreme pessimism. As
shown in the chart below, 44% of these indicators are registering
extreme optimism levels in equity markets today. Conversely, only 2% of
these indicators are showing significant levels of pessimism. Similar to
the smart vs. dumb money spread, such divergences performed extremely
well at identifying the last two interim market tops.
SentimenTraderは60超の市場指標を追跡している、それらの数値から極端な楽観、極端な悲観を数値化している。下のチャートに示すが、これらの指標のうち44%が株式市場の極端な楽観を示している。逆に深刻な悲観の割愛はわずか2%だ。同様のsmart vs. dumb money乖離がこれまで二回の相場天井で見られた。
Record bullishness sentiment rarely ends well for longs. Neither does
extreme divergences between speculative longs and professional hedgers
who are short.
Certainly, indicators like these in hindsight could have helped us
see how temporarily oversold the markets were in late December to better
manage the recent counter attack from the bulls. While we have stayed
grounded primarily in our macro and fundamental research, and that will
not change, sentiment indicators can help on the margin. We hope they
will help others to can see why timing for many of our tactically
bearish macro views could be ripe.
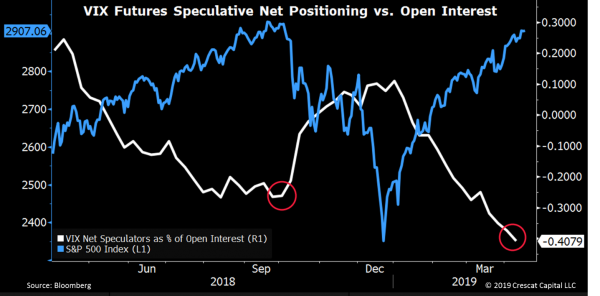
The chart below shows a third sentiment indicator we found that looks
incredibly frothy today, VIX speculation at an extreme. Speculative
futures traders are more net short stock market volatility than they
were at the September market peak.
China More Likely to Tank than Rescue the Global Economy
中国は世界経済を救済すると言うよりはむしろ停滞に引きずり込みそうだ
We think those looking for a China growth resurgence or trade
deal to materially extend the stock market and business cycle are
sorely mistaken. We have written extensively about China’s 400%
growth in banking assets since 2008, likely creating the largest credit
bubble and overvalued currency in modern financial history. Based on
this unsustainable rate of credit expansion, China was responsible for
over 60% of global GDP growth since the global financial crisis. The
country’s massive investment in non-productive infrastructure assets was
financed on credit and created high GDP growth but failed to add to the
wealth or debt-servicing capacity of the country. As a result, China
appears to us to be a financial crisis waiting to unfold.
State-directed misallocation of capital has compromised the savings
of Chinese citizens. In other words, there is an enormous non-performing
loan problem that we believe renders China’s banks insolvent. The
country’s citizens, the banks’ creditors, are the ones holding the bag.
When the Chinese economy inevitably implodes under its bad debt, the
government will be forced to print money to recapitalize its banks and
bail out its citizens to avoid social unrest. This massive money
printing will almost certainly lead to a currency crisis.
The Trump administration’s hardball on trade is just one of many
catalysts for the bursting of the China credit bubble. Whether there is a
trade agreement or an ongoing trade war, either one would lead to a
continued decline in China’s current account balance which should exert
downward pressure on its currency. We think China’s increasing fiscal
deficit due to the recent stimulus will also exert new downward pressure
on the currency.
While the US administration may continue to hype an impending trade
deal as hope for financial markets, we believe trade talks have dragged
on for too long already to not have wreaked havoc on global supply
chains and economic growth for the rest of the year. As the light
continues to get shined on China, it should become clear that nothing
beyond a token trade deal is likely to ever be reached. It is much more
likely that the ongoing trade negotiations will only continue to serve
to awaken the US government and its citizen voters to the egregious
extent of China’s malfeasance.
China’s cyber hacking, intellectual property theft, and forced
technology transfer are likely to be impossible roadblocks to arriving
at any meaningful and enforceable trade deal. The U.S. Trade
Representative reports make it clear that China has failed to live up to
its commitments to open its markets to fair trade ever since it was
permitted to join the WTO in 2001. China’s state-directed economic
policies are simply incompatible with an international trade system
based on open, market-oriented policies and rooted in the principles of
nondiscrimination, market access, reciprocity, fairness and
transparency.
With election season upon us in the US, the nature of our country’s
engagement with China should once again become a major campaign issue.
Taking a strong stance against China’s trade and human rights
transgressions would likely have broad, bi-partisan voter support.
Democracy, liberty, and justice are the foundation that has made the US a
true world economic superpower. Contrast that with China’s
authoritarianism, suppression, and corruption. Sure, there may be some
corruption in democratic, advanced economies too. But we believe it
pales compared to China.
In our view, the trade talks are closer to morphing into a new cold war than to being resolved by a substantial trade pact. Meanwhile,
much like downfall of other totalitarian communist economies, we
believe both internal and foreign capital is likely to continue fleeing
the country, exerting downward pressure on its currency, economy, and
banks. We continue to have a negative view on both the Chinese yuan and
Hong Kong dollar that we are expressing in our global macro fund through
put options on these currencies. We also are short richly-valued,
US-listed “China-hustle” stocks in both hedge funds.
Crescat Remains Steadfast in our Views and Positioning
Crescat社は私どもの見立てとポジションを維持したままだ
Today, with historic US equity valuations, record credit bubbles
globally, and the longest US economic expansion cycle ever likely to
soon come to an end based on our models, we remain steadfast in our net
short US and global equities position in our hedge funds. We are also
short subprime credit in our global macro fund. We remain long precious
metals and precious metals mining stocks across all our strategies. 現在のところ、米国株は歴史的なバリュエーションであり、世界的に記録的な与信バブルだ、そして米国景気拡大は史上最長だ、私どものモデルではこれもすぐに終わりを告げる、私どもは自らのヘッジファンドで米国株と世界株式のショートポジションをそのままだ。私どものGlobal macro fundではサブプライムクレジットもショートしている。私どもがロングしているのは貴金属とその鉱山株でこれはそのままだ。
How Are Gold And Money Supply Related? by Tyler Durden Sun, 06/14/2020 - 13:00 Authored by Mike Shedlock via MishTalk, M2 Money Supply is surging. Will gold follow? M2マネーサプライが急増している。ゴールドはこれを追従するだろうか? Let's investigate an alleged relationship between gold and M2, a measure of money supply in the US. よく言われるM2(米国のマネーサプライ指標)とゴールドの関係について調べてみよう。 "There’s a clear correlation between the annual growth rate in M2 money supply and the price of the yellow metal. " 「M2の年率増加速度とゴールド価格の間には明らかな相関がある。」 Clear Correlation? 明らかな相関? The Tweet claims something different than my lead chart depicts. So let's investigate the above idea in other time frames. このツイートの主張は私が示す最初のチャートが示すものとは異なる。というわけでこのtweetの主張を別の時間フレームで見てみよう。 Gold vs Rate of Change in M2 Money Supply ゴールド vs M2マネーサプライの変化率 If we look at longer time frames, the rate of increase in M2 theory falls flat on its face....
Is The Stock Market As Confused As You Are About A Recession? Written by Lance Roberts | Apr, 1, 2019 Last week, Barron’s ran an article entitled “The Stock Market Is Just As Confused About A Potential Recession As You Are?” To wit: 先週バロンズにこういう記事が掲載された「株式市場は景気後退を予感させるほどに混乱しているだろうか?」見てみよう: “Investors have long used where we are in the economic cycle to decide which stocks to buy and sell. New research from Nomura’s Joseph Mezrich flips that on its head by showing how investors can use stock performance to help determine where we are in the cycle. Too bad the market is sending mixed messages right now.” 長らく投資家は現在景気サイクルのどこに居るかを見てこの株式を売るか買うかを判断してきた。野村證券のJoseph Mezrichの最近の研究では、これが逆さで、投資家は株式のパフォーマンスを見て今景気サイクルのどこにいるかを判断している。最悪なことに現在相場は悪化改善混在のメッセージを送っている。」 But let’s be clear here; no one wants the party to end. So, despite a struggling stock market over the last year, slowing economic growth, and a collapsing yield curve, there are s...