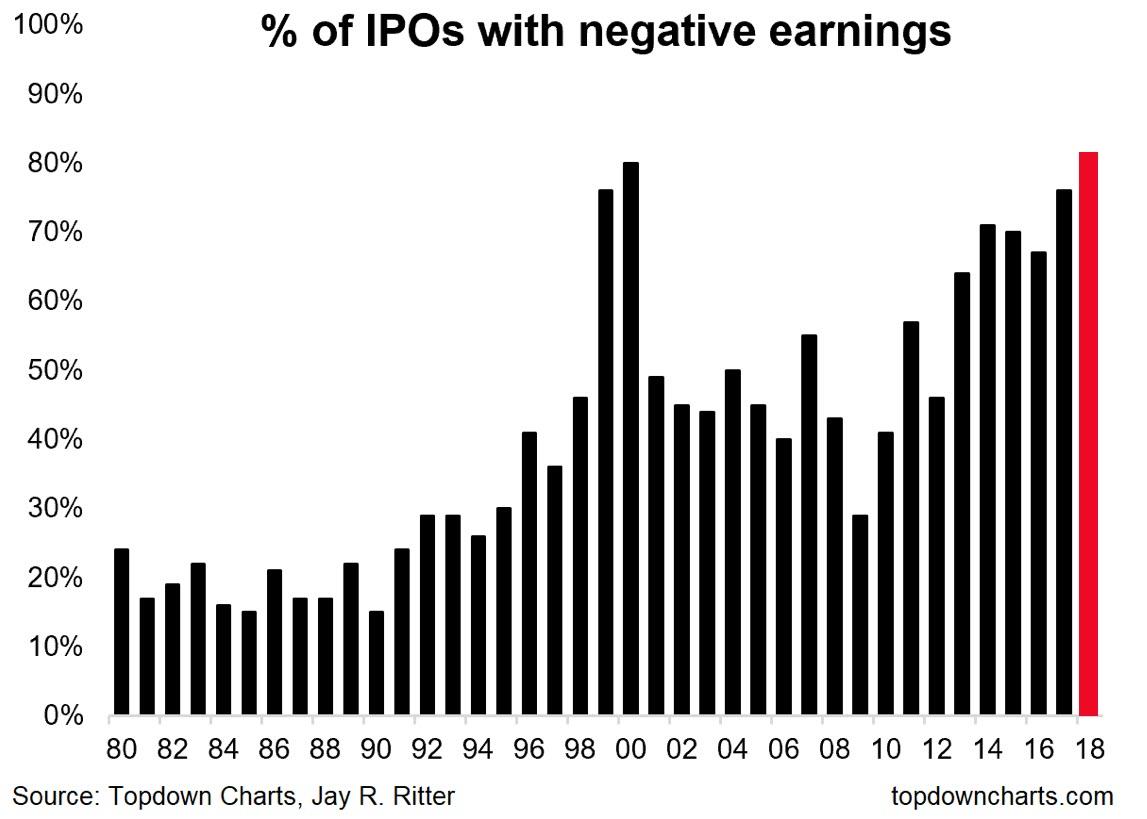
Markets failed to be efficient at the time of the dot.com bubble. And, it appears, they are back at the same game: ドットコムバブルの当時は市場は効率的ではなかった。そして、またもや同じゲームが舞い戻ってきたことが明らかに:
As the chart above shows, share of IPOs issued at negative earnings
(companies losing money) is now at the levels last seen during the
height of the dot.com bubble.
上のチャートを見れば解るが、赤字企業のIPO割合がドットコムバブル当時と同じくらいに増えている。
What can possibly go wrong? 絶対に上手くゆくよ
* * * Gurdgiev's view on the future of economic development is outlined briefly in the TEDx talk I gave on Human Capital and the Age of Change.
今後の経済の先行きに対するGurgievの見方がTEDx talkで簡単に紹介されている、Human Capital and the Age of Change にアクセスするとよい。
Class 8 Heavy Truck Orders Crash 68% in January by Tyler Durden Wed, 02/06/2019 - 17:25 Among the latest dismal news about the strength of the US economy, on Tuesday ACT Research released preliminary truck orders for January 2019 which showed that Class 8 truck orders collapsed an astounding 68% for January. The decline is being attributed to a 300,000+ vehicle backlog potentially prompting fleets to halt purchases in the near term. 米国経済に関し最近憂鬱なニュースが多い中で、火曜にACT researchが2019年1月のトラック発注を開示した、1月にClass 8のトラック発注がなんと68%も急落した。この発注減は短期的に300,000台超の潜在在庫を生み出す。 Specifically, in January Class 8 net orders were 15,800 units (14,700 SA; 176,400 SAAR), down 68% YoY and down 26% MoM. Class 5- 7 January net orders were 23,400...
Amazonで買物をしてContrarianJを応援しよう "On The Precipice" by Tyler Durden Mon, 06/24/2019 - 14:30 Authored by Kevin Ludolph via Crescat Capital, Dear Investors: The US stock market is retesting its all-time highs at record valuations yet again. We strongly believe it is poised to fail. The problem for bullish late-cycle momentum investors trying to play a breakout to new highs here is the oncoming freight train of deteriorating macro-economic conditions. 米国株式は記録的バリエーションのもとで再度過去最高を試している。私どもはこれが失敗すると強く信じている。景気拡大終盤で強気のモメンタム投資家が新高値を試そうとしていることの問題は、マクロ経済条件の悪化にある。 US corporate profit growth, year-over-year, for the S&P 500 already fully evaporated in the first quarter of 2019 and is heading toward outright decline for the full year based on earnings estimate revision trends. Note the alligator jaws divergence in the chart be...
中国が債務増加していることはたしかです。ただ日本の例を日銀資金循環報告でみると家計、320兆円、民間非金融機関1,785兆円、一般政府 1,284兆円となります。合算すると3,300兆円にもなり、GDPの600%を超えています。 https://www.boj.or.jp/statistics/sj/sjexp.pdf この記事の統計と同じ考え方で数値を採用しているのかどうか気になります。 加えて、この資金循環報告に書かれている海外資産というのが内数なのか外数なのか?私にはよくわかりません。当然海外債務も結構な額になります。一度日銀資金循環 図表1を見てください。詳しい方に教えていただければ。 この中国のたどる道は昔のソ連とかMMTと同様で、自国通貨ならいくら発行しても倒産はしない、というか為政者が痛みに耐えることができず緩和を続けるというものです。でも最終的には限界点に達します。ソ連は建国から崩壊まで70年かかりました。 自由主義経済なら立ち行かなくなった企業は退場してもらうというのが減速なのですが、これがうまくゆかないわけです。 でも日本は中国のはるか先を言っているように見えます。ちょっと検索したのですが、日本の債務に関しては政府債務に言及したものばかりで、この記事のように民間、個人まで総合的に記載しているのは日銀の資金循環統計しか見つけることができませんでした。 China Continues To Pile Debt On Top Of More Debt Written by Jesse Colombo | Feb, 27, 2019 Like many countries, China attempted to rein in its debt growth over the past couple years, but ultimately gave up and is now back to piling on even more debt. Bloomberg reports – 多くの国と同様に、中国もここ2年ほど債務増加を抑えようとしてきた、しかし結局の所諦めてしまい、今や更に債務を積み上げている。ブルームバーグ記事ーー For almost two years,...
Powell Keeps The Bond Bull Kicking Written by Lance Roberts | Mar, 21, 2019 In a widely expected outcome, the Federal Reserve announced no change to the Fed funds rate but did leave open the possibility of a rate hike next year. Also, they committed to stopping “Quantitative Tightening (or Q.T.)” by the end of September. 多くの人が予想したとおり、FEDはFFR変更をしないだけでなく来年も不明とした。さらには、QTを9月末に終えると約束した。 The key language from yesterday’s announcement was: 昨日の発表の重要な部分はこういう具合だ: “ Information received since the Federal Open Market Committee met in January indicates that the labor market remains strong but that growth of economic activity has slowed from its solid rate in the fourth quarter . Payroll employment was little changed in February, but job gains have been solid, on average, in recent months, and the unemployment rate has remained low. 「1月のFOMC以来の情報を分析すると、労働市場は強いがQ4に比べると経済成長は鈍化している。2月の雇用環境にほとんど変化がなかった、ここ数ヶ月確実に雇用は増えている、そして失業率は低いままだ。 Recent indicators point to s...