雇用統計が教えるものーー経済は鈍化している
The Message From The Jobs Report – The Economy Is Slowing
Written by Lance Roberts | Apr, 8, 2019
Last week, the Bureau of Labor Statistics (BLS) published the March monthly “employment report” which showed an increase in employment of 196,000 jobs. As Mike Shedlock noted on Friday:
先週、BLSが3月の月例「雇用統計」を発表した、雇用が196,000増えたという。Mike Shedlockは金曜にこう書いた:
「1月全非農業雇用は+311,000から+312,000に改定された、2月のデータは+20,000から+33,000に改定された。これらの改定で1月と2月を合算した雇用増は以前の報告よりも14,000多くなった。改定後でみると、雇用増は直近三ヶ月で平均180,000/月となる。
BLS Jobs Statistics at a Glance
BLS 雇用統計概観
就業数増加 employment growth に関する議論は世の中に殆ど見当たらない、これは驚くべきことで、景気後退的な収斂が回避され続けるだろうという願望によるものだ。過去3ヶ月の平均就業数増加に注目すると、Mikeが書いたように180,000だ、これを見ると明確に雇用に関するトレンドは鈍化している。今日はこの「トレンド」に関してもっと詳細に検証してみよう。
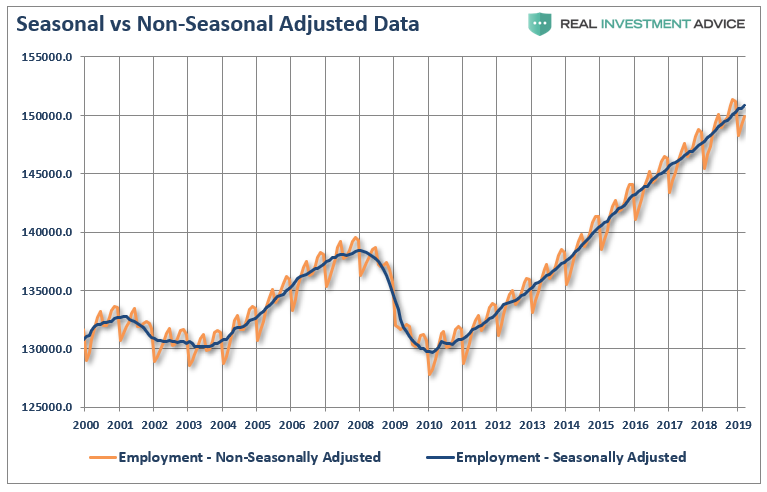
While a tremendous amount of attention is focused on the monthly employment numbers, the series is one of the most highly manipulated, guesstimated, and annually revised series produced by any agency. The whole issue of seasonal adjustments, which try to account for temporary changes to employment due to a variety of impacts, is entirely too systematic to be taken at face value. The chart below shows the swings between the non-seasonally adjusted and seasonally adjusted data – anything this rhythmic should be questioned rather than taken at face value as “fact.”
毎月の雇用統計に関してはとても大きく注目されるが、この一連の数字は最も操作された数字の一つだ、当てずっぽうの推量に過ぎず、年中改定されている。各種要因による一時的影響を考慮するために季節調整が行われているが、これが額面数値をまともに受け止めることができないほどにシステマティックに操作されている。下のチャートが季節調整前と後のデータを比べたものだーーこの繰り返しに疑念がある、額面数値は「本当」なのだろうか。
As stated, while most economists focus at employment data from one month to the next for clues as to the strength of the economy, it is the “trend” of the data which is far more important to understand.
上にも述べたが、多くのエコノミストは雇用データを一月前と比べて経済の強さを推し量ろうとする、しかしながら理解すべき重要なことは「トレンド」だ。
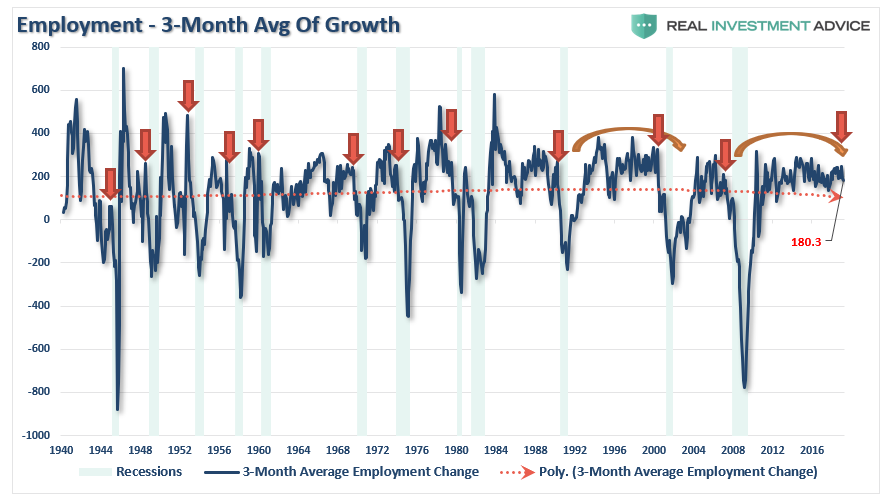
The chart below shows the peak annual rate of change for employment before the onset of a recession. The current annual rate of employment growth is 1.4% which is lower than any previous employment level prior to a recession in history.
下のチャートに示すのは景気後退開始直前の雇用統計年率変化のピーク値だ。現在の年率雇用増加は1.4%に過ぎず、歴史上のどの景気後退前雇用レベルYoY増加よりも弱いものだ。

But while this is a long-term view of the trend of employment in the U.S., what about right now? The chart below shows employment from 1999 to present.
ただし、このデータは米国雇用トレンドを長期的に見たものだが、今現在はどうだろう?下のチャートに示すのは1999年から現在までの雇用数だ。

While the recent employment report was slightly above expectations, the annual rate of growth is slowing. The chart above shows two things. The first is the trend of the household employment survey on an annualized basis. Secondly, while the seasonally-adjusted reported showed 196,000 jobs created, the actual household survey showed a loss of 200,000 jobs.
最近の雇用統計は予想値を少し上回るが、年率増加率は減速している。上のチャートで解ることが2つある。まず第一に、年率で見たときの雇用家計調査だ。第二に、季節調整後の(訳注:企業調査)データでは196,000の雇用 jobs が生み出されているが、実際の家計調査では200,000の雇用 jobs が失われている。
Many do not like the household survey for a variety of reasons but even if we use the 3-month average of seasonally-adjusted employment we see the same picture. (The 3-month average simply smooths out some of the volatility.)
いろいろな理由のために、多くの人は家計調査の数字を好まないが、しかし3ヶ月の季節調整後平均雇用を用いると同様の構図を見出すことができる(3ヶ月平均とすることで変動のかなりな部分をなめらかにしている。)
But here is something else to consider.
しかし、他にも考慮すべきことがある。
While the BLS continually adjusts and fiddles with the data to mathematically adjust for seasonal variations, the purpose of the entire process is to smooth volatile monthly data into a more normalized trend.
BLSは継続して数学的に季節調整でデータをごまかしているが、この一連のプロセスの目的は毎月の変動をより正常なトレンドに見せかけることにある。
The problem, of course, with manipulating data through mathematical adjustments, revisions, and tweaks, is the risk of contamination of bias. A simpler method to use for smoothing volatile monthly data is using a 12-month moving average of the raw data as shown below.
当然のことながら問題は数学的にデータを操作していることで、さらには改定、微調整が行われている、これでデータにバイアスがかかるリスクがある。毎月の変動を平坦化するシンプルな手法は12か月移動平均を利用することであり、下に示すようなものだ。
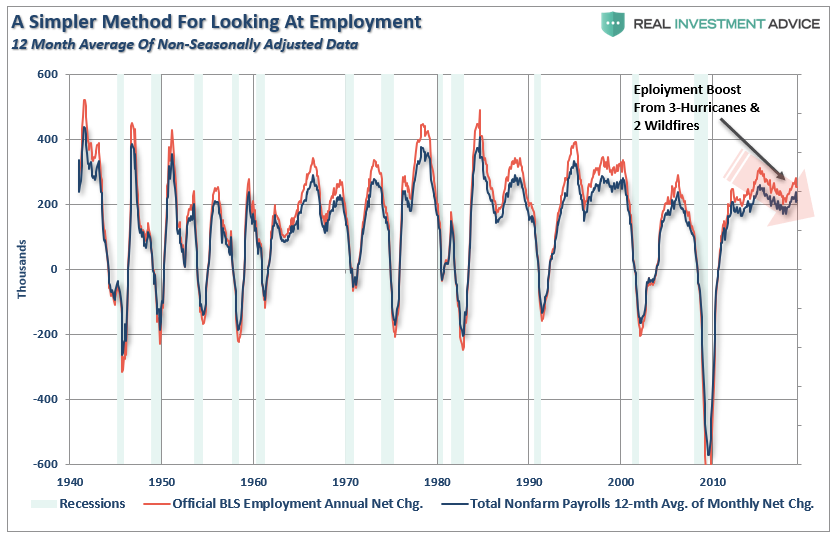
Notice that near peaks of employment cycles the employment data deviates from the 12-month average but tends to reconnect as reality emerges. (Also, note the pickup in employment due to the slate of “natural disasters” in late 2017 which are now fading as reconstruction completes)
注意してほしいが雇用サイクルのピーク近くでは雇用データは12か月移動平均から乖離する、しかしながらトレンドに変化はない。(もう一つ注意してほしいが、2017年遅くの「自然災害」で雇用が増えている、災害復旧が終わりこの効果は薄れている。)
Sometimes, “simpler” gives us a better understanding of the data.
ときには、「よりシンプルな手法」がデータを理解しやすくするものだ。
Importantly, there is one aspect to all the charts above which remains constant. No matter how you choose to look at the data, peaks in employment growth occur prior to economic contractions rather than an acceleration of growth.
大切なことは、上の一連のチャートで変わらないことが一つある。
データをどういうふうに見ようとも、経済縮小の前に雇用増加のピークが訪れるということだ。
However, there is more to this story.
ただし、さらに興味深いことがある。
One thing which is never discussed when reporting on employment is the “growth” of the working age population. Each month, new entrants into the population create “demand” through their additional consumption. Employment
should increase to accommodate the increased demand from more
participants in the economy. Either that or companies resort to
automation, off-shoring, etc. to increase rates of production without
increases in labor costs. The chart below shows the total increase in employment versus the growth of the working age population.
雇用統計に関する報告で決して議論されないことがある、それは労働人口の「増加」だ。毎月、人口数が増えて追加消費が加わるために「需要」が生まれる。経済活動に関与する人口が増えるために需要が増え、雇用もそれに応じて増えるはずだ。あるいはそうしなくとも、企業は自動化やオフショアー利用等で労働コストを増やさずに生産性を上げることができる。下のチャートで雇用増と労働人口増加を比べている。
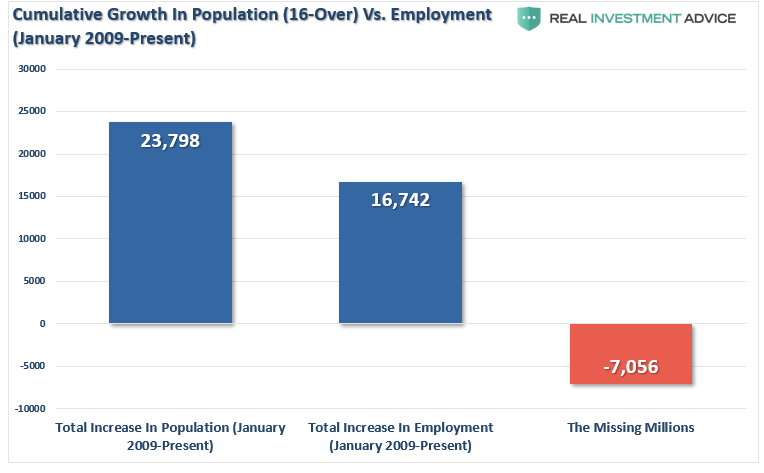
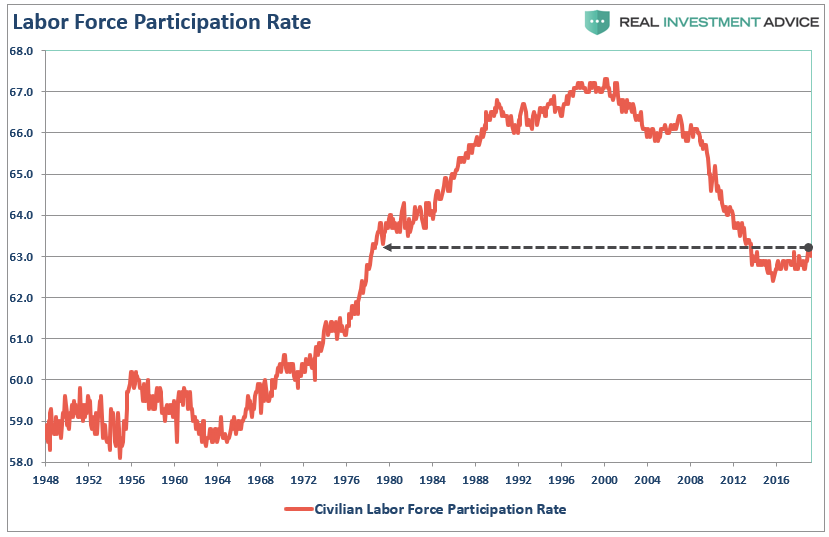
The missing “millions” shown in the chart above is one of the “great mysteries” about one of the longest economic booms in U.S. history. This is particularly a conundrum when the Federal Reserve talks about the economy nearing “full employment.” The Labor Force Participation Rate below shows this great mystery.
このグラフで分かるように「何百人」もの人がこの期間にいなくなっている、米国市場最長の景気拡大にもかかわらず「大きなミステリー」のひとつだ。経済は「完全雇用」にもかかわらずこういうことになるというのがFEDがいつも言うコナンドラム難問だ。下に示す労働参加率がこの大きなミステリーを示している。
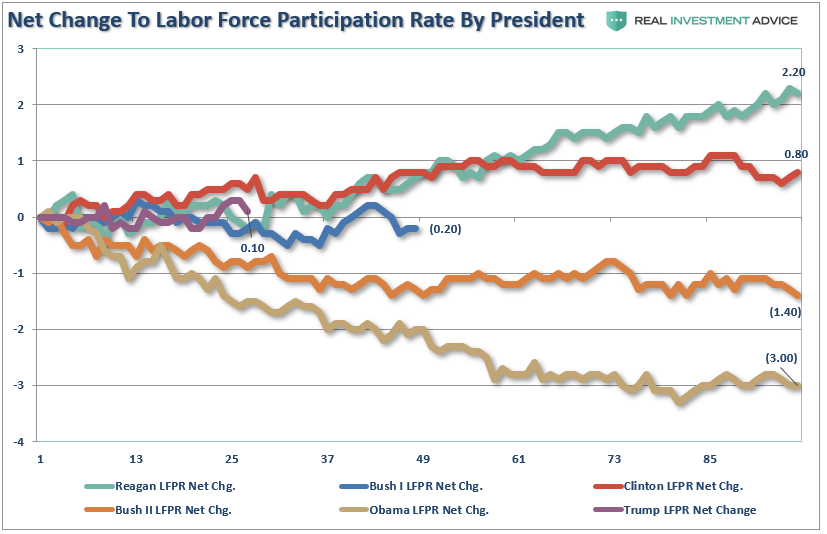
Since many conservatives continue to credit President Trump with a booming economy and employment gains, we can look at changes to the labor force participation rate by President as a measure of success. Currently, Trump’s gains are either less than Clinton, the same as Reagan, or tracking Bush Sr.; “spin it” as you will.
多くの保守派はトランプ大統領の公約通り景気が改善し雇用は増えたというが、しかし私どもは各大統領ごとに労働参加率を比べてその政策の成功度指標とみなすこともできる。現在のところトランプ就任後の雇用増加はクリントン時代よりも悪く、レーガンと同程度だ、もしくはBush Sr. を追いかけている;今後の推移を見てみよう。
Of course, as we are all very aware, there are many people who are working part-time, going to school, etc. But even when we consider just those working “full-time” jobs, particularly when jobless claims are reaching record lows, the percentage of full-time employees is still well below levels of the last 35 years.
当然のことながら皆が分かっていることだが、パートタイムの仕事をしているひともたくさんいる、なかには学校に行きながらの場合もある。ここで我々は「フルタイム」の仕事を考えよう、新規失業保険申請は記録的低位になっている、フルタイム雇用の割合は過去35年のレベルからみてとても低いものだ。
One of the arguments often given for the low labor force participation rate is that millions of “baby boomers” are leaving the workforce for retirement. This argument doesn’t carry much weight given that the “Millennial”
generation, which is significantly larger, is simultaneously entering
the workforce. The other problem is shown below, there are more
individuals over the age of 55, as a percentage of that age group, in
the workforce today than in the last 50-years.
労働参加率が低い理由としてよく言われるのは「団塊の世代」が引退で労働力から去っているからだと言われる。この理由は「Millennial 若年層」には当てはまらない、この動きと同時に多数の若者が労働力人口に加わっているのだ。別の問題が下のチャートに示されている、55歳以上の多くの割合の人達が現在労働力人口に加わっている、過去50年よりも大きいのだ。
Of course, the reason they aren’t retiring is that they can’t. After two massive bear markets, weak economic growth, questionable spending habits,and poor financial planning, more individuals over the age of 55 are still working because they simply can’t “afford” to retire.
当然のことながら彼らが引退しないのは、(経済的理由で)引退できないからだ。二回のひどいベア相場のため、また弱い経済成長のため、そして浪費癖と自らの財政計画がでたらめだったために、多くの人が55歳を超えても働いている、彼らは単に「資産不足で」引退できないのだ。
However, for argument sake, let’s assume that every worker over the age of 55 retires. If the “retiring” argument is valid, then employment participation rates should soar once that group is removed. The chart below is full-time employment relative to the working-age population of 16-54.
しかしながら議論のために、55歳を超えると全員が引退すると仮定してみよう。もし「引退」できるなら、この世代が除外されることで労働参加率は極端に向上する。下のチャートに示すのは16−54労働力人口に対するフルタイム雇用の割合だ。

Importantly, note in the first chart above the number of workers over the age of 55 increased last month. However, employment of 16-54 year olds declined from 50.78% to 50.55%. It is also, the lowest rate since 1985, which was the last time employment was increasing from such low levels.
大切なことは、最初のチャートでも示したが、先月55歳以上の労働者が増えたことだ。しかしながら、16−54の雇用は50.78%から50.55%に下がった。この値は1985年以来の低い割合だ、当時は低雇用から雇用が増えている途中だった。
The other argument is that Millennials are going to school longer than before so they aren’t working either. (We have an excuse for everything these days.) The chart below strips out those of college age (16-24) and those over the age of 55. Uhm…
もう一つ大切なことは若年層Millennialsはかつてよりも進学率が高く、昔よりも働いている割合が少ない。(いろいろな局面でこの言い訳が使われる)下のチャートは大学生年代(16−24)を除外している、さらに55歳以上も除いている。(訳注:母数は16歳以上のままです)うーーん・・・・・
Here is the same chart of employed 25-54 year olds as a percentage of just that group.
ここに示すのは同様のチャートで、25−54の雇用者の割合だ。(訳注:母数を25−54Labor Force にしている)

When refined down to this level, talk about data mining, we do actually see recovery, however, after the longest economic expansion on record, a record stock market, and record levels of corporate debt to fund expansions and buybacks; employment ratios for this group are at the same level as seen in 1988. Such should raise the question of just how robust the labor market actually is?
この数値をデーターマイニング手法で分析すると、我々は実際に景気回復し、記録的な長期景気拡大を実現し、株価も記録的な高値で、そこには記録的な企業債務積み上げと記録的自社株買いが起きている;しかしながらこの年齢層の雇用率は1988年当時と同じだ。こういう現実が明らかになると疑問が湧いてくる、本当に労働市場はどれほど強靭なのだろうか?
Low initial jobless claims coupled with the historically low unemployment rate are leading many economists to warn of tight labor markets and impending wage inflation. If there is no one to hire, employees have more negotiating leverage according to prevalent theory. While this seems reasonable on its face, further analysis into the employment data suggests these conclusions are not so straightforward.
新規失業保険申請は低く、失業率は記録的な低位なために、多くのエコノミストは労働市場は引き締まり給与インフレが差し迫ると警告する。
Michael Lebowitz recently pointed out some important considerations in this regard.
Michael Lebowitzは最近こういうことを指摘した、この件に関する大切な検討だ。
For example, if there are indeed very few workers in need of a job, then current workers should have pricing leverage over their employers. This does not seem to be the case as shown in the graph of personal income below.
たとえば、仕事を探している労働者がほとんどいないとして、現在仕事についている労働者が雇用主と労働条件、賃金、の交渉をするとしよう。下に示す個人所得のグラフを見ると、今はそういう状況にないことが解る。(訳注:給料増加率は長期的に鈍化しており、完全雇用状態で既存の労働者が止めても変わりを見つけられないような状況ではこういうことにはならないだろう。)
Furthermore, a closer inspection of the BLS data reveals that, since 2008, 16 million people were reclassified as “leaving the workforce”. To put those 16 million people into context, from 1985 to 2008, a period almost three times longer than the post-crisis recovery, a similar number of people left the workforce.
更に言うと、BLSデータを詳細に見てみると、2008年以来16百万の人が「労働市場から去っている」。この16百万の人を考慮すると、1985から2008の間、金融危機後の回復期間よりも三倍も長い期間に渡り、同じ程度の数の人達が労働市場から去っている。
Why are so many people struggling to find a job and terminating their search if, as we are repeatedly told, the labor market is so healthy? To explain the juxtaposition of the low jobless claims number and unemployment rate with the low participation rate and weak wage growth, a calculation of the participation rate adjusted unemployment rate is revealing.
どうしてお多くの人は仕事を見つけることに懸命であったのに求職行為を諦めてしまうのだろう、そうであるなら私どもがずっと言ってきたが、労働市場は本当に健全なのだろうか?新規失業保険申請が少なく、また失業率は低く、さらに給与増加が弱いということはこういうふうに解釈できる、労働参加率を考慮した失業率を計算してみると良い。
When people stop looking for a job, they are still unemployed, but they are not included in the U-3 unemployment calculation. If we include those who quit looking for work in the data, the employment situation is quite different. The graph below compares the U-3 unemployment rate to one that assumes a constant participation rate from 2008 to today. Contrary to the U-3 unemployment rate of 3.90%, this metric implies an adjusted unemployment rate of 8.69%.
仕事を探すのを諦めそのとき仕事についていないなら、そういう人たちはU3失業率計算で考慮されない。もし我々がそういう求職活動を止めた人を考慮するなら、雇用状況はまったく異なったものとなる。下のチャートは2008年から現在まで労働参加率が変わらないとしてU3失業率を計算したものだ。U3失業率は現在3.90%だが、この計測方法では調整後の失業率は8.69%になる。
Importantly, this number is much more consistent with the data we have laid out above, supports the reasoning behind lower wage growth, and is further confirmed by the Hornstein-Kudlyak-Lange Employment Index.
大切なことは、この数値は上のグラフで示した数値にとても合致しているということだ、給与増加が弱いことも納得できる、そしてこの状況はHornstein- Kudlyak-Lange 雇用指数でも確認できる。
One of the main factors driving the Federal Reserve to raise interest rates and reduce its balance sheet is the perceived low level of unemployment. Simultaneously, multiple comments from Fed officials suggest they are justifiably confused by some of the signals emanating from the jobs data. As we have argued in the past, the current monetary policy experiment has short-circuited the economy’s traditional traffic signals. None of these signals is more important than employment.
FEDが金利を引き上げバランスシートを縮小する理由の一つは低い失業率にある。それと同時にFED高官が発するたくさんのコメントは雇用データとはかなり混乱するものだ。私どもがこれまでもずっと言ってきたが、現在の金融政策実験は伝統的な経済データが発するシグナルを無効にしてしまっている。雇用以上に重要なシグナルはない。
As Michael noted:
Michaelはこう記す:
As an aside, it is worth noting that in November of 1969 jobless claims stood at 211,000, having risen slightly from the lows recorded earlier that year. Despite the low number of claims, a recession started a month later, and jobless claims would nearly double within six months. This episode serves as a reminder that every recession followed interim lows in jobless claims and the unemployment rate. We are confident that the dynamics leading to the next recession will not be any different.
それはさておきこのことは大切だ、1969年11月に新規失業率申請数は211,000であり、この数値はこの年の年初の低位からほんの少し増えただけだった。申請数は少ないにもかかわらず、そのひと月後に景気後退が始まった、そして6か月以内に新規失業保険申請は倍になった。この出来事を深く記憶に留めることだ、新規失業保険申請や失業率が底値から少し増えただけでいつも景気後退が訪れる。私どもは次の景気後退に至る力学も全く変わらないものだろうと確信している。
But then again, maybe the yield-curve is already giving us the answer.
しかし繰り返すが、イールドカーブはすでにその答えを出しているかもしれない。
先週、BLSが3月の月例「雇用統計」を発表した、雇用が196,000増えたという。Mike Shedlockは金曜にこう書いた:
“The change in total non-farm payroll employment for January was revised up from +311,000 to +312,000, and the change for February was revised up from +20,000 to +33,000. With these revisions, employment gains in January and February combined were 14,000 more than previously reported. After revisions, job gains have averaged 180,000 per month over the last 3 months.
「1月全非農業雇用は+311,000から+312,000に改定された、2月のデータは+20,000から+33,000に改定された。これらの改定で1月と2月を合算した雇用増は以前の報告よりも14,000多くなった。改定後でみると、雇用増は直近三ヶ月で平均180,000/月となる。
BLS Jobs Statistics at a Glance
BLS 雇用統計概観
- Nonfarm Payroll: +196,000 – Establishment Survey
- Employment: -201,000 – Household Survey
- Unemployment: -24,000 – Household Survey
- Involuntary Part-Time Work: +189,000 – Household Survey
- Voluntary Part-Time Work: +144,000 – Household Survey
- Baseline Unemployment Rate: Unchanged at 3.8% – Household Survey
- U-6 unemployment: Unchanged at 7.3% – Household Survey
- Civilian Non-institutional Population: +145,000
- Civilian Labor Force: -224,000 – Household Survey
- Not in Labor Force: +369,000 – Household Survey
- Participation Rate: -0.2 to 63.0– Household Survey”
就業数増加 employment growth に関する議論は世の中に殆ど見当たらない、これは驚くべきことで、景気後退的な収斂が回避され続けるだろうという願望によるものだ。過去3ヶ月の平均就業数増加に注目すると、Mikeが書いたように180,000だ、これを見ると明確に雇用に関するトレンドは鈍化している。今日はこの「トレンド」に関してもっと詳細に検証してみよう。
While a tremendous amount of attention is focused on the monthly employment numbers, the series is one of the most highly manipulated, guesstimated, and annually revised series produced by any agency. The whole issue of seasonal adjustments, which try to account for temporary changes to employment due to a variety of impacts, is entirely too systematic to be taken at face value. The chart below shows the swings between the non-seasonally adjusted and seasonally adjusted data – anything this rhythmic should be questioned rather than taken at face value as “fact.”
毎月の雇用統計に関してはとても大きく注目されるが、この一連の数字は最も操作された数字の一つだ、当てずっぽうの推量に過ぎず、年中改定されている。各種要因による一時的影響を考慮するために季節調整が行われているが、これが額面数値をまともに受け止めることができないほどにシステマティックに操作されている。下のチャートが季節調整前と後のデータを比べたものだーーこの繰り返しに疑念がある、額面数値は「本当」なのだろうか。
As stated, while most economists focus at employment data from one month to the next for clues as to the strength of the economy, it is the “trend” of the data which is far more important to understand.
上にも述べたが、多くのエコノミストは雇用データを一月前と比べて経済の強さを推し量ろうとする、しかしながら理解すべき重要なことは「トレンド」だ。
The chart below shows the peak annual rate of change for employment before the onset of a recession. The current annual rate of employment growth is 1.4% which is lower than any previous employment level prior to a recession in history.
下のチャートに示すのは景気後退開始直前の雇用統計年率変化のピーク値だ。現在の年率雇用増加は1.4%に過ぎず、歴史上のどの景気後退前雇用レベルYoY増加よりも弱いものだ。
But while this is a long-term view of the trend of employment in the U.S., what about right now? The chart below shows employment from 1999 to present.
ただし、このデータは米国雇用トレンドを長期的に見たものだが、今現在はどうだろう?下のチャートに示すのは1999年から現在までの雇用数だ。
While the recent employment report was slightly above expectations, the annual rate of growth is slowing. The chart above shows two things. The first is the trend of the household employment survey on an annualized basis. Secondly, while the seasonally-adjusted reported showed 196,000 jobs created, the actual household survey showed a loss of 200,000 jobs.
最近の雇用統計は予想値を少し上回るが、年率増加率は減速している。上のチャートで解ることが2つある。まず第一に、年率で見たときの雇用家計調査だ。第二に、季節調整後の(訳注:企業調査)データでは196,000の雇用 jobs が生み出されているが、実際の家計調査では200,000の雇用 jobs が失われている。
Many do not like the household survey for a variety of reasons but even if we use the 3-month average of seasonally-adjusted employment we see the same picture. (The 3-month average simply smooths out some of the volatility.)
いろいろな理由のために、多くの人は家計調査の数字を好まないが、しかし3ヶ月の季節調整後平均雇用を用いると同様の構図を見出すことができる(3ヶ月平均とすることで変動のかなりな部分をなめらかにしている。)
But here is something else to consider.
しかし、他にも考慮すべきことがある。
While the BLS continually adjusts and fiddles with the data to mathematically adjust for seasonal variations, the purpose of the entire process is to smooth volatile monthly data into a more normalized trend.
BLSは継続して数学的に季節調整でデータをごまかしているが、この一連のプロセスの目的は毎月の変動をより正常なトレンドに見せかけることにある。
The problem, of course, with manipulating data through mathematical adjustments, revisions, and tweaks, is the risk of contamination of bias. A simpler method to use for smoothing volatile monthly data is using a 12-month moving average of the raw data as shown below.
当然のことながら問題は数学的にデータを操作していることで、さらには改定、微調整が行われている、これでデータにバイアスがかかるリスクがある。毎月の変動を平坦化するシンプルな手法は12か月移動平均を利用することであり、下に示すようなものだ。
Notice that near peaks of employment cycles the employment data deviates from the 12-month average but tends to reconnect as reality emerges. (Also, note the pickup in employment due to the slate of “natural disasters” in late 2017 which are now fading as reconstruction completes)
注意してほしいが雇用サイクルのピーク近くでは雇用データは12か月移動平均から乖離する、しかしながらトレンドに変化はない。(もう一つ注意してほしいが、2017年遅くの「自然災害」で雇用が増えている、災害復旧が終わりこの効果は薄れている。)
Sometimes, “simpler” gives us a better understanding of the data.
ときには、「よりシンプルな手法」がデータを理解しやすくするものだ。
Importantly, there is one aspect to all the charts above which remains constant. No matter how you choose to look at the data, peaks in employment growth occur prior to economic contractions rather than an acceleration of growth.
大切なことは、上の一連のチャートで変わらないことが一つある。
データをどういうふうに見ようとも、経済縮小の前に雇用増加のピークが訪れるということだ。
However, there is more to this story.
ただし、さらに興味深いことがある。
A Function Of Population
人口動態の影響
雇用統計に関する報告で決して議論されないことがある、それは労働人口の「増加」だ。毎月、人口数が増えて追加消費が加わるために「需要」が生まれる。経済活動に関与する人口が増えるために需要が増え、雇用もそれに応じて増えるはずだ。あるいはそうしなくとも、企業は自動化やオフショアー利用等で労働コストを増やさずに生産性を上げることができる。下のチャートで雇用増と労働人口増加を比べている。
The missing “millions” shown in the chart above is one of the “great mysteries” about one of the longest economic booms in U.S. history. This is particularly a conundrum when the Federal Reserve talks about the economy nearing “full employment.” The Labor Force Participation Rate below shows this great mystery.
このグラフで分かるように「何百人」もの人がこの期間にいなくなっている、米国市場最長の景気拡大にもかかわらず「大きなミステリー」のひとつだ。経済は「完全雇用」にもかかわらずこういうことになるというのがFEDがいつも言うコナンドラム難問だ。下に示す労働参加率がこの大きなミステリーを示している。
Since many conservatives continue to credit President Trump with a booming economy and employment gains, we can look at changes to the labor force participation rate by President as a measure of success. Currently, Trump’s gains are either less than Clinton, the same as Reagan, or tracking Bush Sr.; “spin it” as you will.
多くの保守派はトランプ大統領の公約通り景気が改善し雇用は増えたというが、しかし私どもは各大統領ごとに労働参加率を比べてその政策の成功度指標とみなすこともできる。現在のところトランプ就任後の雇用増加はクリントン時代よりも悪く、レーガンと同程度だ、もしくはBush Sr. を追いかけている;今後の推移を見てみよう。
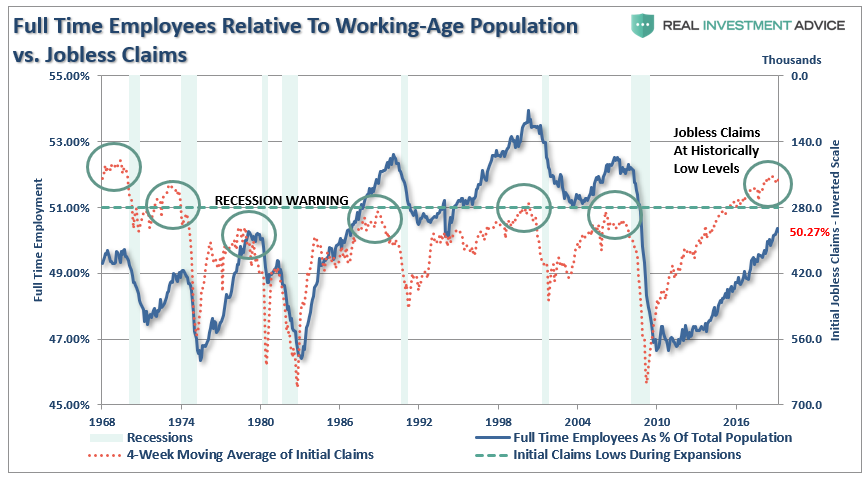
Of course, as we are all very aware, there are many people who are working part-time, going to school, etc. But even when we consider just those working “full-time” jobs, particularly when jobless claims are reaching record lows, the percentage of full-time employees is still well below levels of the last 35 years.
当然のことながら皆が分かっていることだが、パートタイムの仕事をしているひともたくさんいる、なかには学校に行きながらの場合もある。ここで我々は「フルタイム」の仕事を考えよう、新規失業保険申請は記録的低位になっている、フルタイム雇用の割合は過去35年のレベルからみてとても低いものだ。
“With jobless claims at historic lows, and the unemployment rate at 4%, then why is full-time employment relative to the working-age population at just 50.27% which is down from 50.5% last month?”「新規失業保険申請は記録的な低位だ、しかも失業率は4%程度でしかない、こういう状況なのにどうして労働人口あたりのフルタイム雇用割合がわずか50.27%なのだろう?、しかも先月の50.5%から下落している。」
It’s All The Baby Boomers Retiring
問題は団塊の世代の引退にある
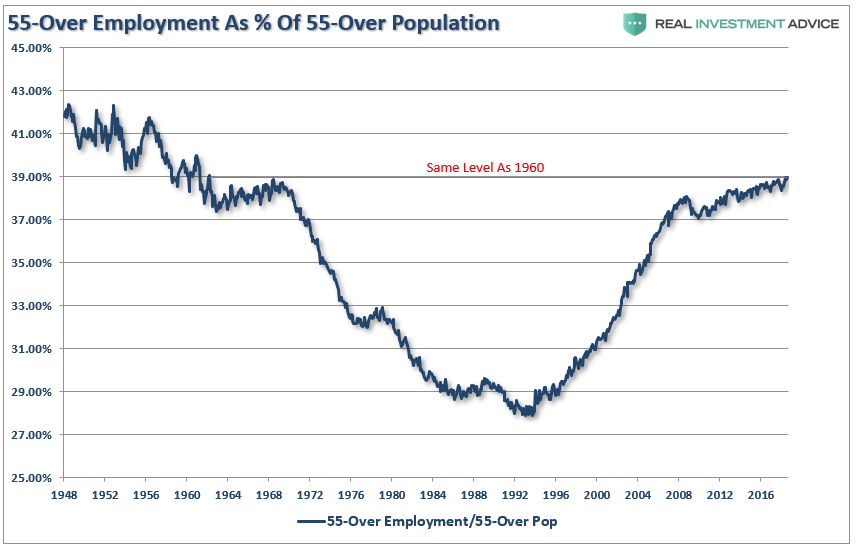
労働参加率が低い理由としてよく言われるのは「団塊の世代」が引退で労働力から去っているからだと言われる。この理由は「Millennial 若年層」には当てはまらない、この動きと同時に多数の若者が労働力人口に加わっているのだ。別の問題が下のチャートに示されている、55歳以上の多くの割合の人達が現在労働力人口に加わっている、過去50年よりも大きいのだ。
Of course, the reason they aren’t retiring is that they can’t. After two massive bear markets, weak economic growth, questionable spending habits,and poor financial planning, more individuals over the age of 55 are still working because they simply can’t “afford” to retire.
当然のことながら彼らが引退しないのは、(経済的理由で)引退できないからだ。二回のひどいベア相場のため、また弱い経済成長のため、そして浪費癖と自らの財政計画がでたらめだったために、多くの人が55歳を超えても働いている、彼らは単に「資産不足で」引退できないのだ。
However, for argument sake, let’s assume that every worker over the age of 55 retires. If the “retiring” argument is valid, then employment participation rates should soar once that group is removed. The chart below is full-time employment relative to the working-age population of 16-54.
しかしながら議論のために、55歳を超えると全員が引退すると仮定してみよう。もし「引退」できるなら、この世代が除外されることで労働参加率は極端に向上する。下のチャートに示すのは16−54労働力人口に対するフルタイム雇用の割合だ。
Importantly, note in the first chart above the number of workers over the age of 55 increased last month. However, employment of 16-54 year olds declined from 50.78% to 50.55%. It is also, the lowest rate since 1985, which was the last time employment was increasing from such low levels.
大切なことは、最初のチャートでも示したが、先月55歳以上の労働者が増えたことだ。しかしながら、16−54の雇用は50.78%から50.55%に下がった。この値は1985年以来の低い割合だ、当時は低雇用から雇用が増えている途中だった。
The other argument is that Millennials are going to school longer than before so they aren’t working either. (We have an excuse for everything these days.) The chart below strips out those of college age (16-24) and those over the age of 55. Uhm…
もう一つ大切なことは若年層Millennialsはかつてよりも進学率が高く、昔よりも働いている割合が少ない。(いろいろな局面でこの言い訳が使われる)下のチャートは大学生年代(16−24)を除外している、さらに55歳以上も除いている。(訳注:母数は16歳以上のままです)うーーん・・・・・
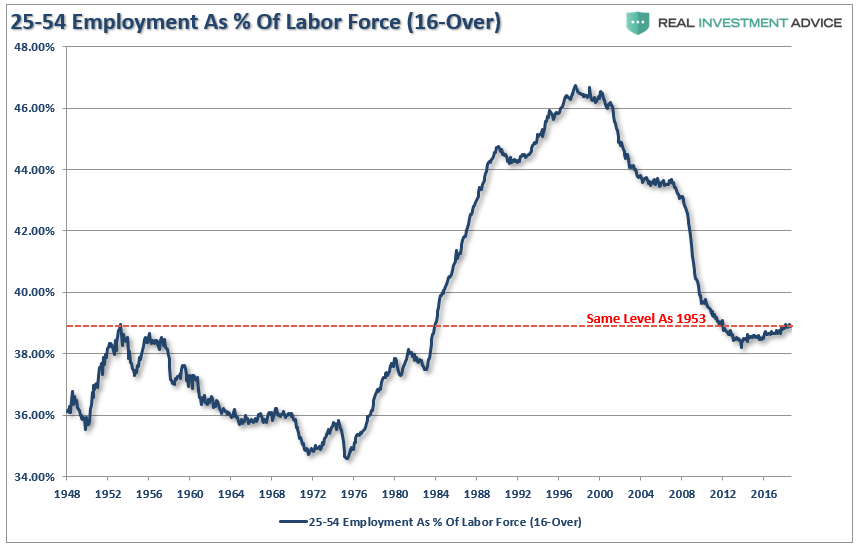
Here is the same chart of employed 25-54 year olds as a percentage of just that group.
ここに示すのは同様のチャートで、25−54の雇用者の割合だ。(訳注:母数を25−54Labor Force にしている)
When refined down to this level, talk about data mining, we do actually see recovery, however, after the longest economic expansion on record, a record stock market, and record levels of corporate debt to fund expansions and buybacks; employment ratios for this group are at the same level as seen in 1988. Such should raise the question of just how robust the labor market actually is?
この数値をデーターマイニング手法で分析すると、我々は実際に景気回復し、記録的な長期景気拡大を実現し、株価も記録的な高値で、そこには記録的な企業債務積み上げと記録的自社株買いが起きている;しかしながらこの年齢層の雇用率は1988年当時と同じだ。こういう現実が明らかになると疑問が湧いてくる、本当に労働市場はどれほど強靭なのだろうか?
Low initial jobless claims coupled with the historically low unemployment rate are leading many economists to warn of tight labor markets and impending wage inflation. If there is no one to hire, employees have more negotiating leverage according to prevalent theory. While this seems reasonable on its face, further analysis into the employment data suggests these conclusions are not so straightforward.
新規失業保険申請は低く、失業率は記録的な低位なために、多くのエコノミストは労働市場は引き締まり給与インフレが差し迫ると警告する。
Strong Labor Statistics
強い雇用統計
Michael Lebowitzは最近こういうことを指摘した、この件に関する大切な検討だ。
“The data certainly suggests that the job market is on fire. While we would like nothing more than to agree, there is other employment data which contradicts that premise.”「一連のデータをみると確かに雇用市場は加熱している。私どももこれに同意せざるを得ないが、その前提条件に反する雇用統計データがある。」
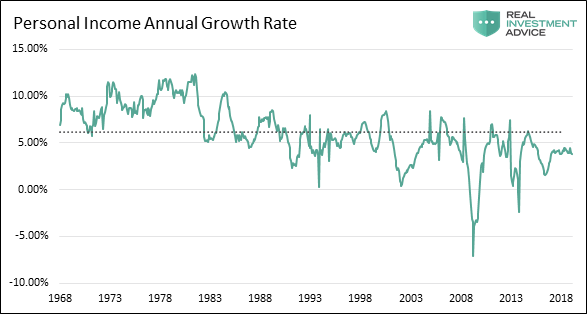
For example, if there are indeed very few workers in need of a job, then current workers should have pricing leverage over their employers. This does not seem to be the case as shown in the graph of personal income below.
たとえば、仕事を探している労働者がほとんどいないとして、現在仕事についている労働者が雇用主と労働条件、賃金、の交渉をするとしよう。下に示す個人所得のグラフを見ると、今はそういう状況にないことが解る。(訳注:給料増加率は長期的に鈍化しており、完全雇用状態で既存の労働者が止めても変わりを見つけられないような状況ではこういうことにはならないだろう。)
Furthermore, a closer inspection of the BLS data reveals that, since 2008, 16 million people were reclassified as “leaving the workforce”. To put those 16 million people into context, from 1985 to 2008, a period almost three times longer than the post-crisis recovery, a similar number of people left the workforce.
更に言うと、BLSデータを詳細に見てみると、2008年以来16百万の人が「労働市場から去っている」。この16百万の人を考慮すると、1985から2008の間、金融危機後の回復期間よりも三倍も長い期間に渡り、同じ程度の数の人達が労働市場から去っている。
Why are so many people struggling to find a job and terminating their search if, as we are repeatedly told, the labor market is so healthy? To explain the juxtaposition of the low jobless claims number and unemployment rate with the low participation rate and weak wage growth, a calculation of the participation rate adjusted unemployment rate is revealing.
どうしてお多くの人は仕事を見つけることに懸命であったのに求職行為を諦めてしまうのだろう、そうであるなら私どもがずっと言ってきたが、労働市場は本当に健全なのだろうか?新規失業保険申請が少なく、また失業率は低く、さらに給与増加が弱いということはこういうふうに解釈できる、労働参加率を考慮した失業率を計算してみると良い。
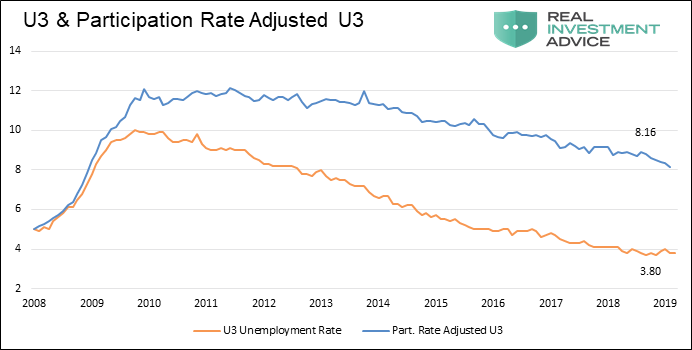
When people stop looking for a job, they are still unemployed, but they are not included in the U-3 unemployment calculation. If we include those who quit looking for work in the data, the employment situation is quite different. The graph below compares the U-3 unemployment rate to one that assumes a constant participation rate from 2008 to today. Contrary to the U-3 unemployment rate of 3.90%, this metric implies an adjusted unemployment rate of 8.69%.
仕事を探すのを諦めそのとき仕事についていないなら、そういう人たちはU3失業率計算で考慮されない。もし我々がそういう求職活動を止めた人を考慮するなら、雇用状況はまったく異なったものとなる。下のチャートは2008年から現在まで労働参加率が変わらないとしてU3失業率を計算したものだ。U3失業率は現在3.90%だが、この計測方法では調整後の失業率は8.69%になる。
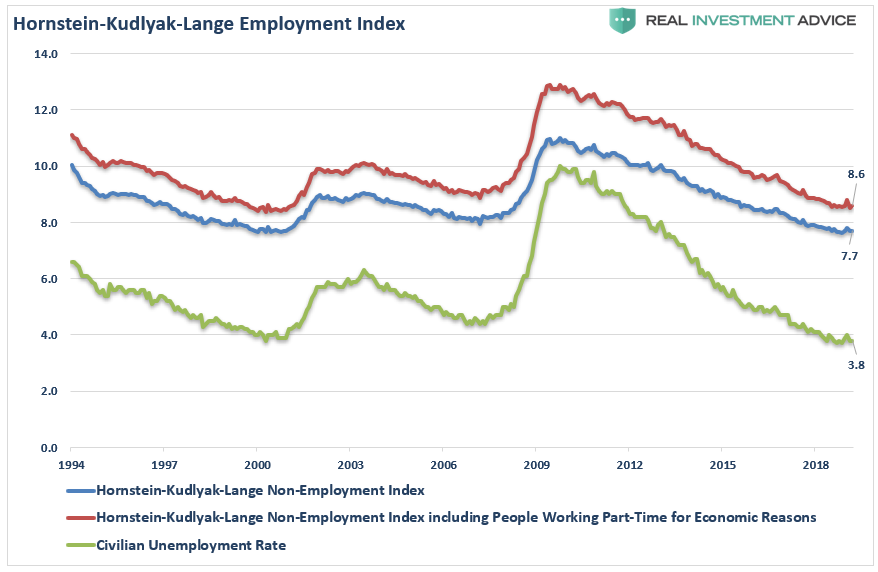
Importantly, this number is much more consistent with the data we have laid out above, supports the reasoning behind lower wage growth, and is further confirmed by the Hornstein-Kudlyak-Lange Employment Index.
大切なことは、この数値は上のグラフで示した数値にとても合致しているということだ、給与増加が弱いことも納得できる、そしてこの状況はHornstein- Kudlyak-Lange 雇用指数でも確認できる。
(The Hornstein-Kudlyak-Lange Non-Employment Index including People Working Part-Time for Economic Reasons (NEI+PTER) is a weighted average of all non-employed people and people working part-time for economic reasons expressed as the share of the civilian non-institutionalized population 16 years and older. The weights take into account persistent differences in each group’s likelihood of transitioning back into employment. Because the NEI is more comprehensive and includes tailored weights of non-employed individuals, it arguably provides a more accurate reading of labor market conditions than the standard unemployment rate.)(Hornstein-Kudlyak-Langeの非雇用指数NEIは経済的理由でパートタイム労働をしている人を含んでおり、すべての失業者と仕方なくパートタイムで働いている人を考慮している、また16歳以上のすべての人口に対する割合で算出される。NEIの算出は複雑で非雇用のグループに対する重み付けをしており、標準的な失業率よりもより正確に労働市場を把握している。)
One of the main factors driving the Federal Reserve to raise interest rates and reduce its balance sheet is the perceived low level of unemployment. Simultaneously, multiple comments from Fed officials suggest they are justifiably confused by some of the signals emanating from the jobs data. As we have argued in the past, the current monetary policy experiment has short-circuited the economy’s traditional traffic signals. None of these signals is more important than employment.
FEDが金利を引き上げバランスシートを縮小する理由の一つは低い失業率にある。それと同時にFED高官が発するたくさんのコメントは雇用データとはかなり混乱するものだ。私どもがこれまでもずっと言ってきたが、現在の金融政策実験は伝統的な経済データが発するシグナルを無効にしてしまっている。雇用以上に重要なシグナルはない。
As Michael noted:
Michaelはこう記す:
“Logic and evidence argue that, despite the self-congratulations of central bankers, good wage-paying jobs are not as plentiful as advertised and the embedded risks in the economy are higher. We must consider the effects that these sequences of policy error might have on the economy – one where growth remains anemic and jobs deceptively elusive.「論理と証拠を見る限りでは、中央銀行は自己称賛するが、皆が言うほどに良い給与の仕事はそう多くはない、そして経済に埋め込まれたリスクは高いものだ。我々は一連の政策ミスを考慮しなければならないーー経済成長は弱々しいもので雇用は見せかけでとらえどころが無い。
Given that wages translate directly to personal consumption, a reliable interpretation of employment data has never been more important. Oddly enough, it appears as though that interpretation has never been more misleading. If we are correct that employment is weak, then future rate hikes and the planned reduction in the Fed’s balance sheet will begin to reveal this weakness soon.”給与は直接個人消費につながる、雇用データの信頼できる解釈がこれほど大切なことはなかった。奇妙なことに、ここまでデータ解釈が誤解されたことはない。私どもの解釈が正しく雇用が弱いものなら、将来の金利引き上げとFEDバランスシート縮小はすぐに経済の弱さを露呈するだろう。」
As an aside, it is worth noting that in November of 1969 jobless claims stood at 211,000, having risen slightly from the lows recorded earlier that year. Despite the low number of claims, a recession started a month later, and jobless claims would nearly double within six months. This episode serves as a reminder that every recession followed interim lows in jobless claims and the unemployment rate. We are confident that the dynamics leading to the next recession will not be any different.
それはさておきこのことは大切だ、1969年11月に新規失業率申請数は211,000であり、この数値はこの年の年初の低位からほんの少し増えただけだった。申請数は少ないにもかかわらず、そのひと月後に景気後退が始まった、そして6か月以内に新規失業保険申請は倍になった。この出来事を深く記憶に留めることだ、新規失業保険申請や失業率が底値から少し増えただけでいつも景気後退が訪れる。私どもは次の景気後退に至る力学も全く変わらないものだろうと確信している。
But then again, maybe the yield-curve is already giving us the answer.
しかし繰り返すが、イールドカーブはすでにその答えを出しているかもしれない。


Lance Roberts is a Chief Portfolio Strategist/Economist for Clarity Financial. He is also the host of “The Lance Roberts Podcast” and Chief Editor of the “Real Investment Advice” website and author of “Real Investment Daily” blog and “Real Investment Report“. Follow Lance on Facebook, Twitter, Linked-In and YouTube


