引き続き製造業は弱い:米国経済データは2年ぶりの低位
とはいうものの、市場参加者がさらなる金融緩和を予感し1999のようなストーリーを作ることができればバリュエーションが更に高まることも否定はできません。
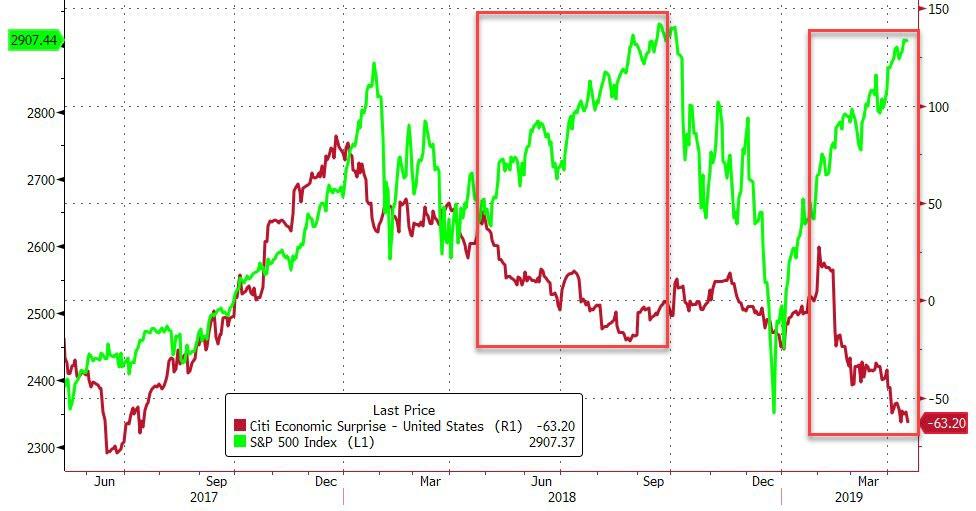
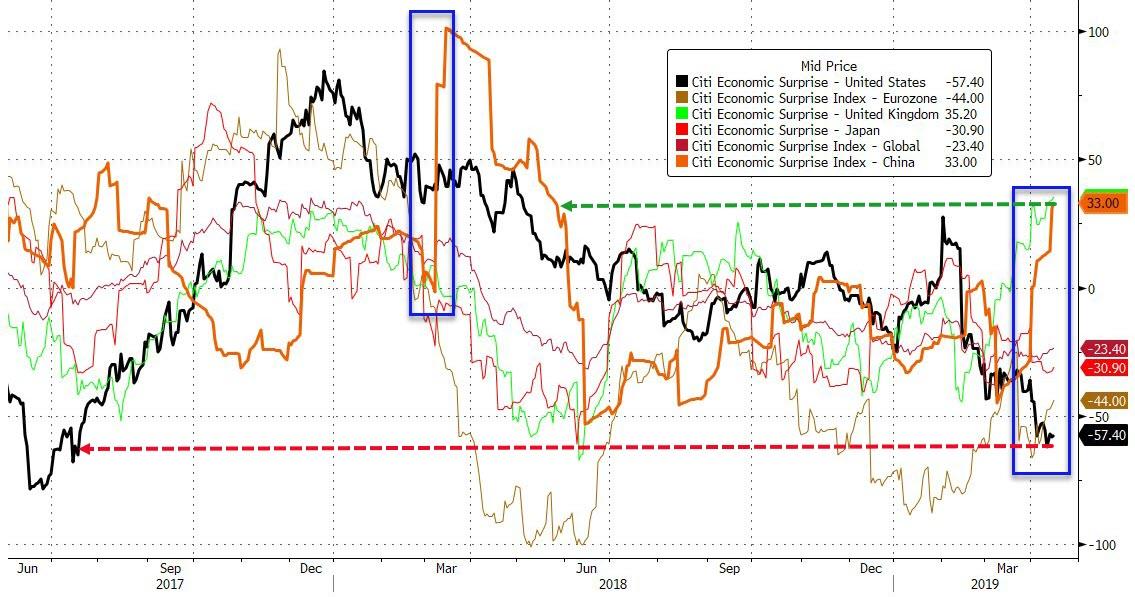
Despite
all the talk of a great US economy ready for rebirth now that The Fed
has taken its foot off the neck of expansion, US macro-economic data has
collapsed (absolutely and relative to expectations) in recent weeks to
its lowest since July 2017 - taking on the ugly title of 'worst economic data in the world'...
FEDがもう制限なく緩和をすることで米国経済が素晴らしい再生をすると皆が話題にするが、米国経済マクロデータはここ数週急落し(市場予想に対する絶対値&相対値共に)、2017年7月以来の悪い数値だーーあえて言うなら「世界最悪のデータ」・・・

And things are getting worse. As Knowledge Leaders Capital blog's Steven Vanelli notes, so far this week, we’ve received a few data points that reinforce the manufacturing slowdown taking place in the US.
そして状況は悪化しつつある。Steven VanelliがKnowledge Leaders Capitalブログで今週書いたことだが、いくつかのデータを見ると米国製造業の鈍化を余儀なくされている。
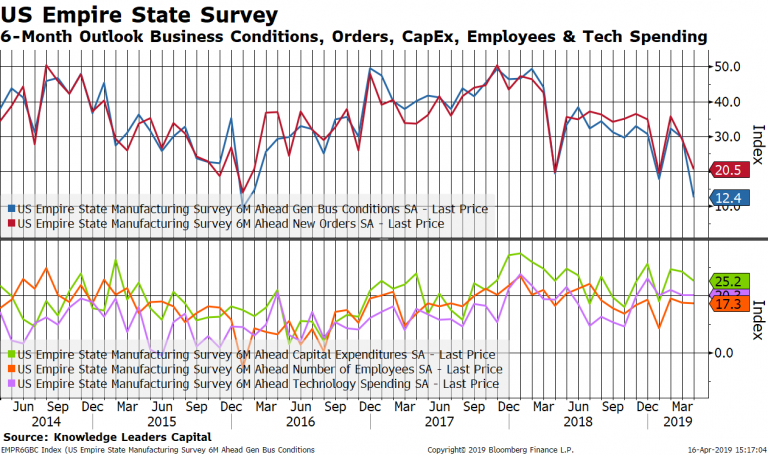
On Monday, we got the Empire State Survey, a survey of manufacturing in New York.
月曜に私どもはEmpire State Surveyの最新データを入手した、ニューヨークの製造業に関する調査だ。
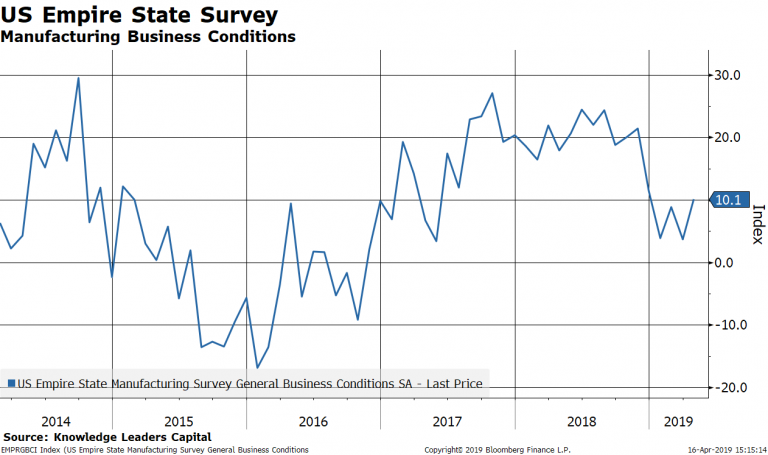
Importantly, this is one of the few “soft” data points we have for
April, so its message is important. It turned up slightly from last
month, showing some stabilization and beating estimates, but it is still
well down from 2018 levels.
Underneath the surface, the data was a bit less encouraging. In the 6-month outlook, expectations for general business conditions and new orders plunged.
大切なことは、このデータが数少ない4月の「ソフト」データであることだ、というわけでこのデータの意味することは重要だ。先月から多少改善し、多少の安定化と予想を上回った、しかしまだ2018のレベルよりも低いものだ。このデータの背景をみるとそれほど勇気づけられるものではない。今後6か月を見通すと、一般ビジネス環境期待値と新規オーダーは下落している。

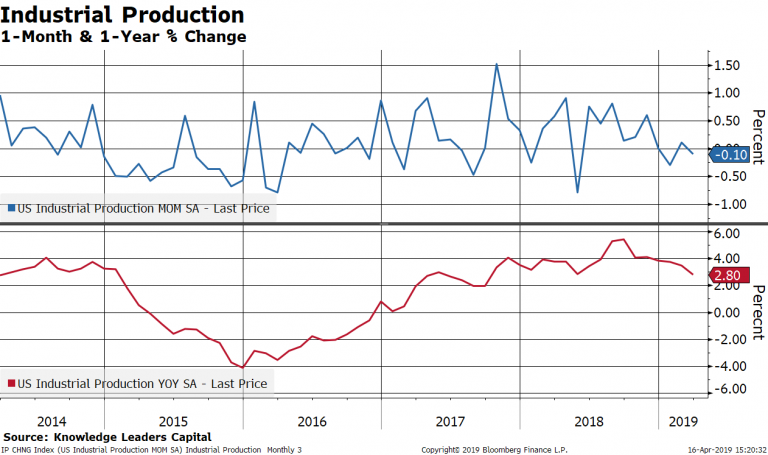
Industrial production undershot monthly estimates, falling .10% when it was expected to rise .2%. This brought the 1-year percent change down to 2.8% from a rate about twice that of last September.
工業生産は月次ベースで0.10%下落してる、市場予想は0.2%増だった。ということは年率換算で2.8%下落であり、昨年9月よりも二倍のペースで悪化見通しとなる。
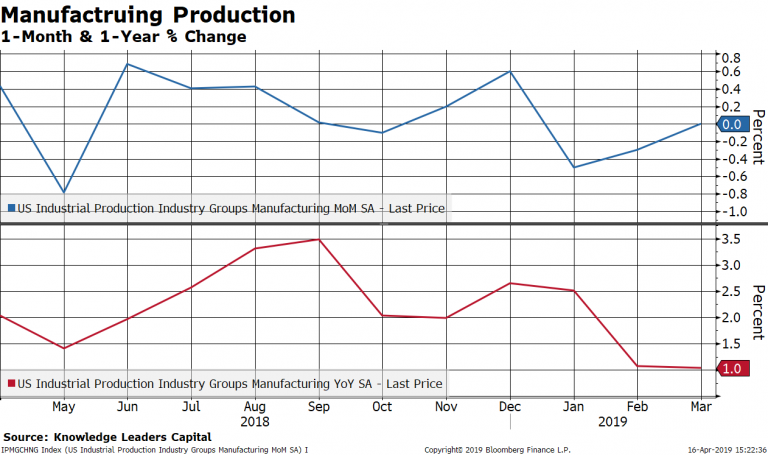
The manufacturing component of industrial production came in .10% under expectations also, slowing to a 1% 1-year rate of change.
工業生産のうち製造要素は予想を0.10%下回る、年率換算では1%と減速している。
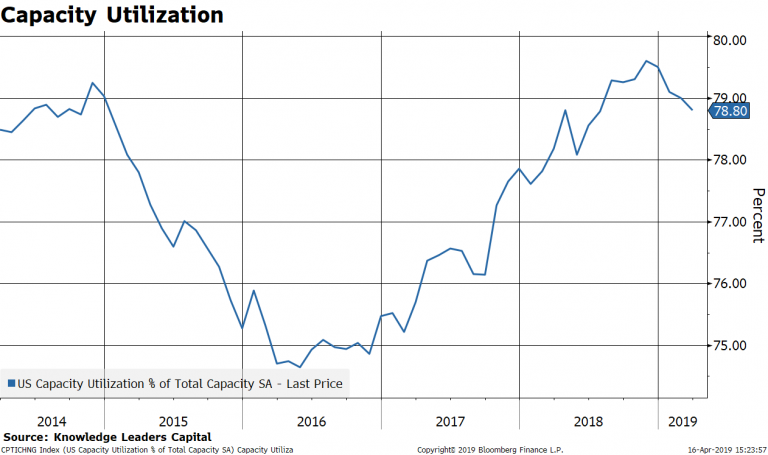
Lastly, capacity utilization was reported at 78.8%, coming in .3% lower than the 79.1% estimate.
最後に、設備稼働率は78.8%であり、市場予想の79.1%よりも0.3%低い。

All of this explains why the Bloomberg Industrial Surprise Index - a sub-index of the Bloomberg Economic Surprise Index - has notched down recently.
これら全般を見ると、どうしてブルームバーグのIndustrial Surprise Indexが最近下落したかを理解できる。
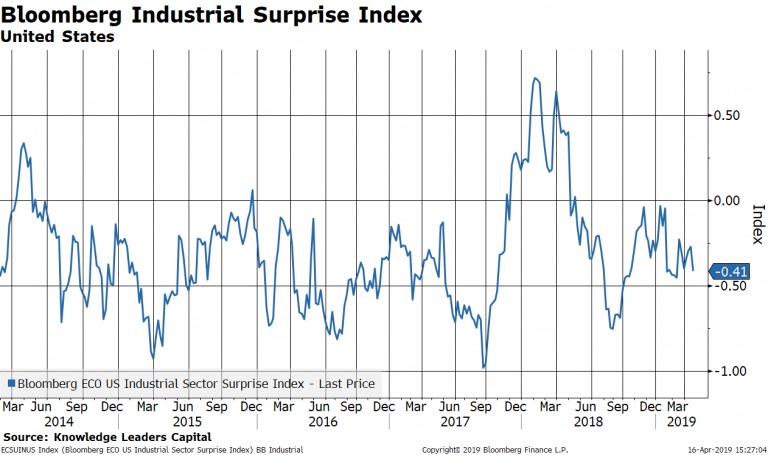
...even as stocks near record highs.
・・・ただ株式は過去最高値に近づいてる。
FEDがもう制限なく緩和をすることで米国経済が素晴らしい再生をすると皆が話題にするが、米国経済マクロデータはここ数週急落し(市場予想に対する絶対値&相対値共に)、2017年7月以来の悪い数値だーーあえて言うなら「世界最悪のデータ」・・・
And things are getting worse. As Knowledge Leaders Capital blog's Steven Vanelli notes, so far this week, we’ve received a few data points that reinforce the manufacturing slowdown taking place in the US.
そして状況は悪化しつつある。Steven VanelliがKnowledge Leaders Capitalブログで今週書いたことだが、いくつかのデータを見ると米国製造業の鈍化を余儀なくされている。
On Monday, we got the Empire State Survey, a survey of manufacturing in New York.
月曜に私どもはEmpire State Surveyの最新データを入手した、ニューヨークの製造業に関する調査だ。

Underneath the surface, the data was a bit less encouraging. In the 6-month outlook, expectations for general business conditions and new orders plunged.
大切なことは、このデータが数少ない4月の「ソフト」データであることだ、というわけでこのデータの意味することは重要だ。先月から多少改善し、多少の安定化と予想を上回った、しかしまだ2018のレベルよりも低いものだ。このデータの背景をみるとそれほど勇気づけられるものではない。今後6か月を見通すと、一般ビジネス環境期待値と新規オーダーは下落している。
Industrial production undershot monthly estimates, falling .10% when it was expected to rise .2%. This brought the 1-year percent change down to 2.8% from a rate about twice that of last September.
工業生産は月次ベースで0.10%下落してる、市場予想は0.2%増だった。ということは年率換算で2.8%下落であり、昨年9月よりも二倍のペースで悪化見通しとなる。

The manufacturing component of industrial production came in .10% under expectations also, slowing to a 1% 1-year rate of change.
工業生産のうち製造要素は予想を0.10%下回る、年率換算では1%と減速している。

Lastly, capacity utilization was reported at 78.8%, coming in .3% lower than the 79.1% estimate.
最後に、設備稼働率は78.8%であり、市場予想の79.1%よりも0.3%低い。
All of this explains why the Bloomberg Industrial Surprise Index - a sub-index of the Bloomberg Economic Surprise Index - has notched down recently.
これら全般を見ると、どうしてブルームバーグのIndustrial Surprise Indexが最近下落したかを理解できる。

・・・ただ株式は過去最高値に近づいてる。
