Commercial and industrial (C&I) loan activity is watched
closely by economists to gauge the strength of the economy and estimate
where we are in the business cycle. C&I loans are used to
finance capital expenditures or increase the borrower’s working capital.
The C&I loan cycle often takes up to a couple of years to turn
positive after a recession, but provides even more confirmation that an
economic expansion is underway. For example, the U.S. Great Recession
officially ended in June 2009, but the C&I loan cycle didn’t turn
positive until late-2010. C&I loans also help to warn when the economic cycle is approaching its end (as they are now).
C&I ローン(企業の設備投資や運転資金に利用するローン)動向がエコノミストに注視されている、経済の強さや景気サイクルで今どこにいるかを判断するためにだ。C&Iローンは設備投資や運転資金に用いられる。景気後退後にC&Iローンが上昇するのは2年ほどの遅れがある、しかしこういう状況のときには経済拡大が起きていることが確実だ。たとえば、米国のGreat Recessionは2009年6月に終わったが、C&Iローンが増えるのは2010年遅くだった。C&Iローンはまた景気拡大終焉の警告ともなる(まさにいまがそうだ)。
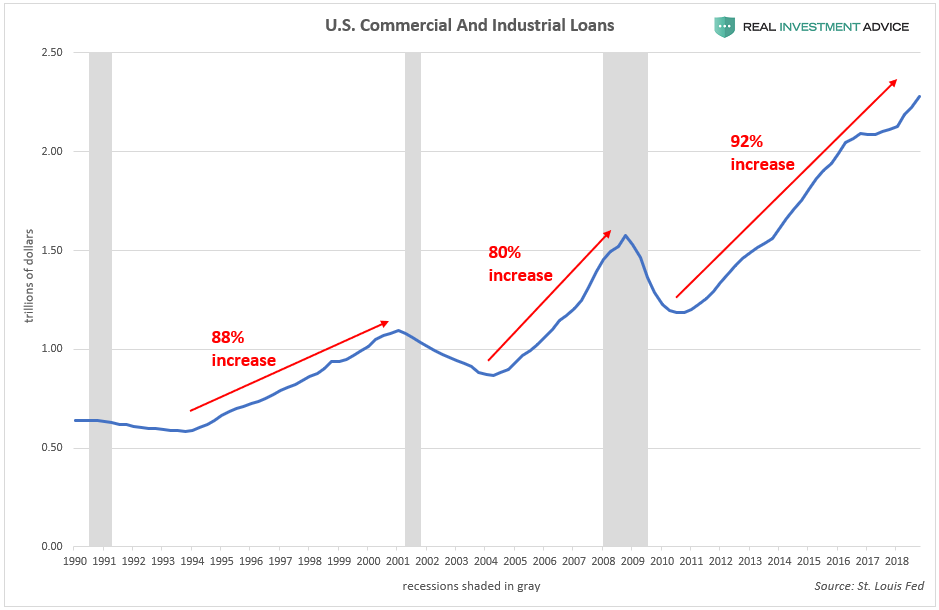
Total outstanding U.S. commercial and industrial loans have increased
by 92% in the current cycle, which surpasses the 80% increase during
the mid-2000s cycle and the 88% increase during the late-1990s cycle:
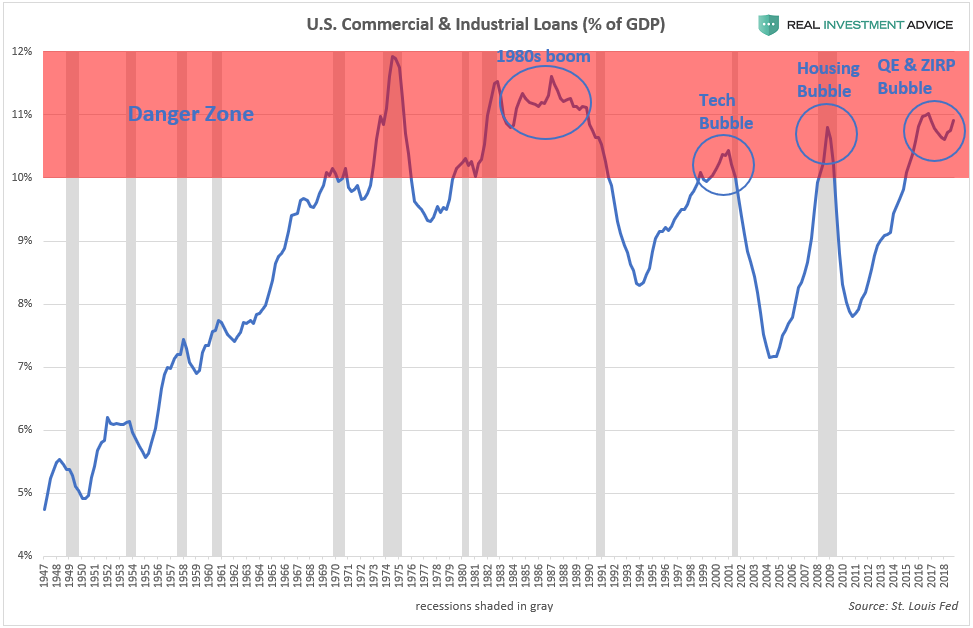
One way of determining when the C&I loan cycle (and,
therefore, the overall economic cycle) is nearing its end is by charting
total outstanding commercial and industrial loans as a percentage of
GDP. When C&I loans are at 10% of GDP or higher (the
“Danger Zone”), that is typically a sign that the cycle is long in the
tooth and about to tip over into a recession. According to the chart
below, recessions occurred shortly after C&I loans peaked within the “Danger Zone.” C&I
loans are currently in that zone, which I see as further confirmation
that we are in a Fed-driven economic bubble that will end badly.
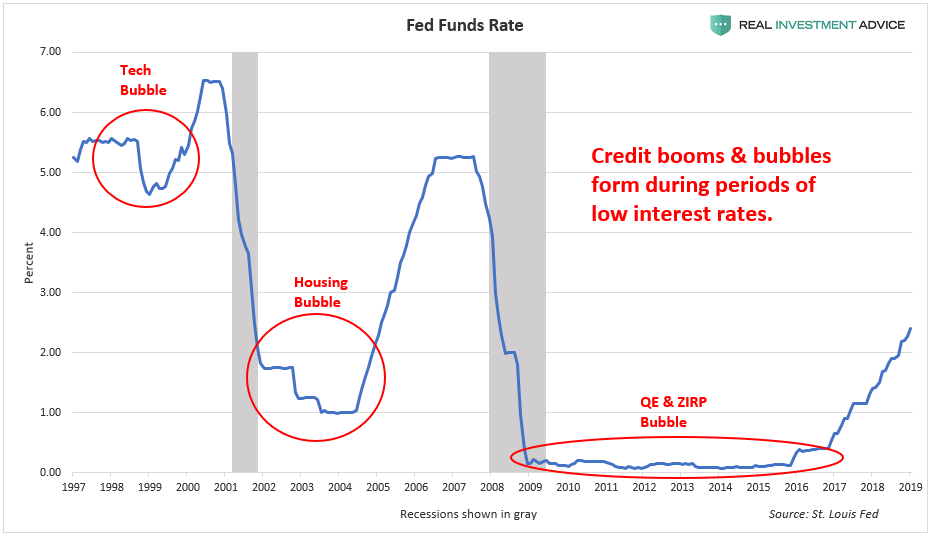
The current C&I loan cycle has been more powerful and
longer-lasting than the prior two cycles because the Fed has held
interest rates at record low levels for a record length of time. As the
chart below shows, credit booms and bubbles form during low interest
rate periods (low interest rates encourage borrowing):
現在のC&Iローンサイクルは過去二回のものよりも力強く長期に渡るものだった、というのも、FEDが金利を記録的低位にかつ記録的長期に渡り維持したためだ。下のチャートに示すが、与信ブームとバブルが見て取れる、低金利が借金しやすくするためだ:
The U.S. corporate debt market (which is mostly in the form of bonds
instead loans) is telling a similar message as commercial and industrial
loans, as I recently discussed.
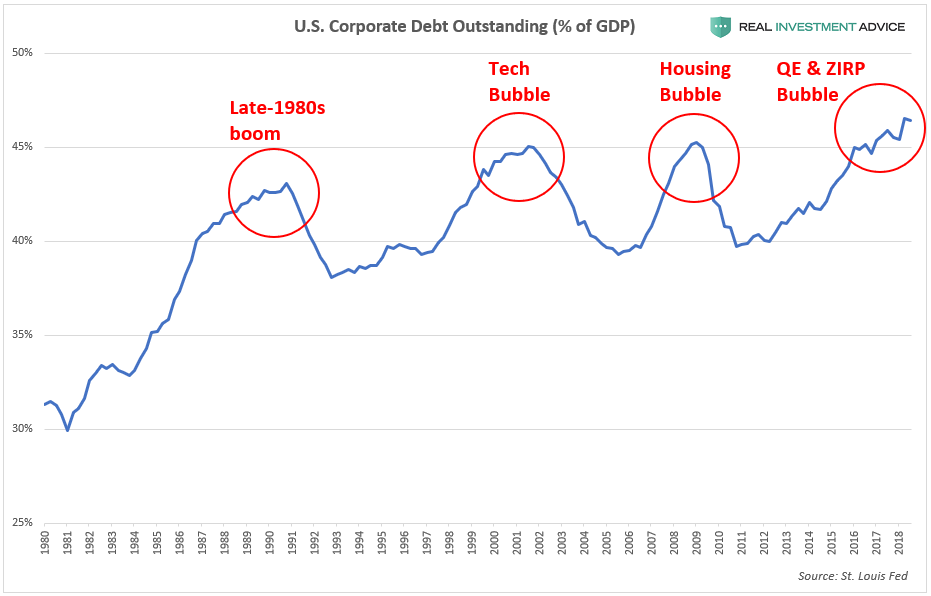
To summarize, ultra-low bond yields over the past decade have
encouraged a corporate borrowing bubble that has also been funding the
stock buyback boom. As a result, total outstanding U.S.
corporate debt has increased by $3 trillion or 45% since the last peak
in 2008. U.S. corporate debt is now at an all-time high of over 46% of
GDP, which is even worse than the levels reached during the dot-com bubble and mid-2000s housing bubble.
I am fully aware that both C&I loans and corporate debt
may reach a higher percentage of GDP in this cycle due to how low
interest rates are. Still, it is important to be aware of the risks that
are building up and not be complacent. When the Fed and other
central banks hold interest rates at low levels, they create market
distortions and encourage malinvestment or unwise lending decisions that
would not otherwise occur in a normal interest rate environment. These
malinvestments are revealed once interest rates are raised and the
economic cycle turns (read my piece about this in Forbes). A
tremendous amount of malinvestment has accumulated after a decade of
artificially low interest rates, which is going to result in serious
pain when the cycle inevitably turns – make no mistake about that. 今回の景気サイクルでC&Iローンも企業債務もともに対GDPでみると最悪なのは低金利のためだと私は分かっている。FEDや世界中の中央銀行が低金利政策をとったために、市場をゆがめmalinvestmentを増やし、通常の金利なら起こりえない馬鹿げた貸出判断をしてしまった。今後金利が上昇し景気サイクルが変わると、これらのmalinvestmentsが明らかになる(私のForbsの記事を読むが良い)。人工的に低金利を10年も続けたため意にとんでもない数のmalinvestmentが積み上がっている、景気サイクルが変わると深刻な痛みを伴うだろうーー決してこの件で投資判断を間違ってはいけない。
How Are Gold And Money Supply Related? by Tyler Durden Sun, 06/14/2020 - 13:00 Authored by Mike Shedlock via MishTalk, M2 Money Supply is surging. Will gold follow? M2マネーサプライが急増している。ゴールドはこれを追従するだろうか? Let's investigate an alleged relationship between gold and M2, a measure of money supply in the US. よく言われるM2(米国のマネーサプライ指標)とゴールドの関係について調べてみよう。 "There’s a clear correlation between the annual growth rate in M2 money supply and the price of the yellow metal. " 「M2の年率増加速度とゴールド価格の間には明らかな相関がある。」 Clear Correlation? 明らかな相関? The Tweet claims something different than my lead chart depicts. So let's investigate the above idea in other time frames. このツイートの主張は私が示す最初のチャートが示すものとは異なる。というわけでこのtweetの主張を別の時間フレームで見てみよう。 Gold vs Rate of Change in M2 Money Supply ゴールド vs M2マネーサプライの変化率 If we look at longer time frames, the rate of increase in M2 theory falls flat on its face....
Is The Stock Market As Confused As You Are About A Recession? Written by Lance Roberts | Apr, 1, 2019 Last week, Barron’s ran an article entitled “The Stock Market Is Just As Confused About A Potential Recession As You Are?” To wit: 先週バロンズにこういう記事が掲載された「株式市場は景気後退を予感させるほどに混乱しているだろうか?」見てみよう: “Investors have long used where we are in the economic cycle to decide which stocks to buy and sell. New research from Nomura’s Joseph Mezrich flips that on its head by showing how investors can use stock performance to help determine where we are in the cycle. Too bad the market is sending mixed messages right now.” 長らく投資家は現在景気サイクルのどこに居るかを見てこの株式を売るか買うかを判断してきた。野村證券のJoseph Mezrichの最近の研究では、これが逆さで、投資家は株式のパフォーマンスを見て今景気サイクルのどこにいるかを判断している。最悪なことに現在相場は悪化改善混在のメッセージを送っている。」 But let’s be clear here; no one wants the party to end. So, despite a struggling stock market over the last year, slowing economic growth, and a collapsing yield curve, there are s...