Last week, one of the most confounding features of the post-Christmas rally was resolved,
when following a 4 month boycott, bearish investors finally threw in
the towel and after pulling money from equity funds for 13 weeks, bought
a whopping $27.3Bn of US stock funds and ETFs in the week ending on
March 13th. This was the second largest inflow on record, behind
$38.30bn from March of last year, and contrasts with a mix of small
inflows and outflows earlier this year, including a $5.83bn outflow in
the prior week.
先週のことだが、クリスマス後のラリーでもっとも混乱してきたことが解決した、4か月ポジションを取っていなかったが、とうとうベア派がタオルを投げて諦めた、市場から13週に渡り資金を引き上げていたが、なんと$27.3Bもの資金を米国株とETFに投じた、3月13日までの一週間の出来事だ。この買いは米国史上二番目のものだ、一番は$38.30Bで昨年3月のものだ、今年の薄商いでの売り買い交錯が今年になって続いていたがこれまでの動きとは大きく異なるものだ、その前の週は$5.83Bの資金流出だった。
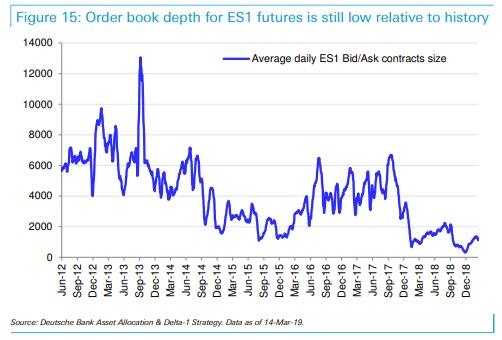
The topic of reversing equity flows was also the key focus in the latest note from DB's Parag Thatte, who writes that following
large outflows of over $100bn since October, US equity funds this week
saw inflows surge with over $31bn in the first 3 days, helping drive the S&P 500 back to the top of its recent range.
What to make of this sudden fund flow reversal? As Thatte explains,
there have been only a handful of episodes (9) in the last few years
when US equities saw inflows at such a strong pace. These episodes were
of two types:
In a majority of episodes surging inflows were a contrarian indicator.
6 out of the 9 episodes saw the S&P 500 fall an average of -5.9%
over the course of the following one month, accompanied by outflows.
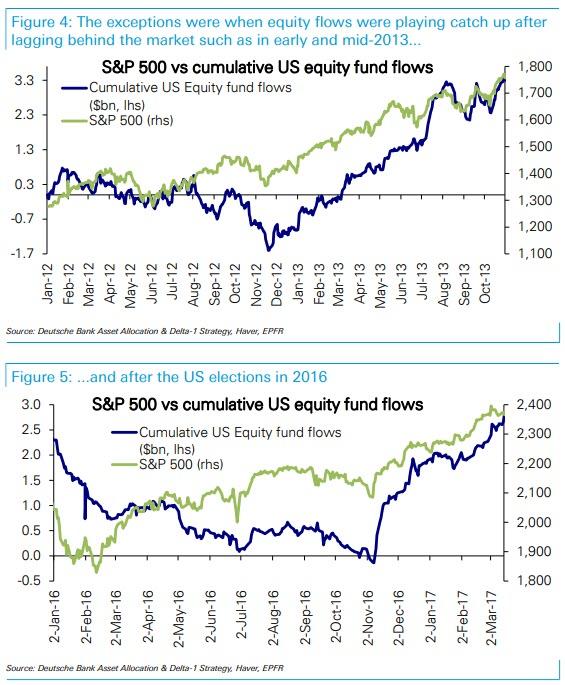
Exceptions were when inflows were just catching up after lagging the market.
In early- and mid-2013 and in late 2016 following the US elections,
strong equity inflows continued for an extended period of time after the
initial surge, driving the market even higher. These exceptions are
instructive in that they all occurred when inflows were playing catch up
after lagging far behind a market rally, which may be the case now.
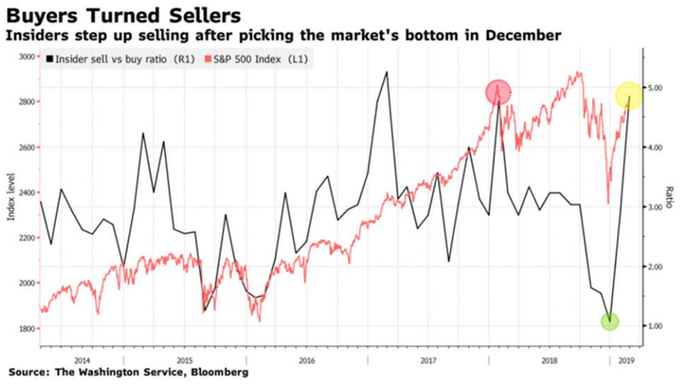
However, arguing for the former, less cheerful take on the fund flow
timing reversal is an additional downside risk that has emerged this
week: according to Deutsche, the number of S&P 500 companies
in blackouts will ramp up sharply starting in the last week of March
and peak mid-April, implying a reduced pace of buybacks. As
Thatte warns, "the outsized role played by buybacks in driving the rally
in this recovery cycle as well as investor attention focused on the
blackout period recently adds to the risks highlighted above."
So as companies are about to go cold turkey on what has been another
year of record buybacks, who will be buying - or selling? The answer, as
Thatte explains in laying out the various flows expected from
systematic strategies, is mixed:
The Risk from Vol Control is to the downside. Vol
Control funds were quiet this week. VIX dropped from 16 to 13.5 over
the week as the market rebounded, while 1M realized vol was flat at 9. Vol Control funds are near full equity allocations, so risk is to the downside if volatility spikes.
Vol Controlからのリスクを見ると下落傾向だ。Vol Control ファンドは今週おとなしかった。VIXはこれまでの16から今週13.5に下落した、市場のリバウンドによるものだ、一方で一月のボラティリティは変わらずの9だった。Vol Control ファンドは目一杯株式露出している、そのためもしボラティリティが急上昇すると下落リスクは大きい。
CTAs are poised to buy in the next 7-10 days if a sell-off does not materialize. CTAs
are in aggregate net long S&P 500 and other equity indices, however
with lighter positioning than in 2017-2018. With S&P 500's 50d MA
rising and only -1.7% below the 200d MA, expect more buying if those
technical triggers cross. That is likely to occur within the next 7-10 trading days if a sell-off doesn't materialize. In other words, they will buy unless they sell.
Risk Parity continues to buy equities providing a tailwind. Equity
allocations for Risk Parity are still low relative to their historical
range. Risk Parity managers started buying equities a few weeks ago and
will continue to be incremental buyers in the coming weeks as long as
cross asset volatility continues to decline.
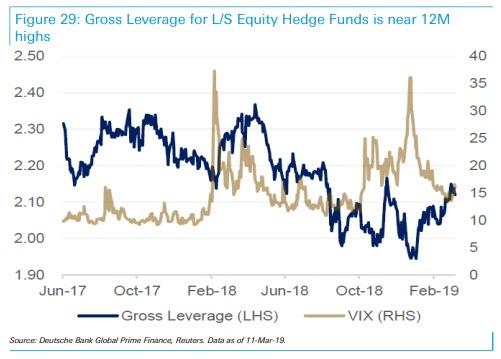
Finally, as the market stormed higher so did hedge fund Gross
Leverage for Equity L/S Hedge Funds, which is now near 12M highs, after
managers slowly added risk YTD. Equity L/S Hedge Funds had a strong
week bringing YTD returns to +6% on average. Top $-longs continue to
outperform top $-shorts, although PMs trimmed net exposure slightly.
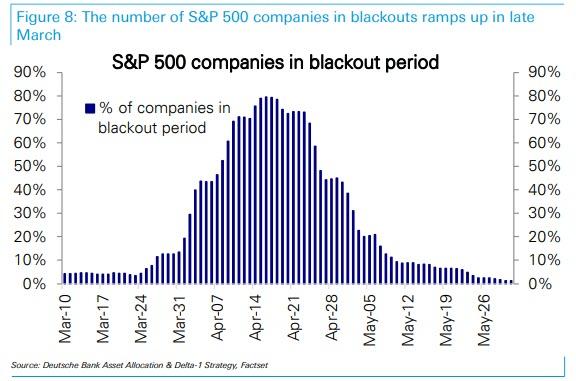
One last observation: Emini (S&P futs) liquidity remains abysmal,
with the average ES bid/ask contracts size just above 1,000 and toughly
where it average for much of the fourth quarter. This means that any
abrupt and sustained reversal will likely lead to sharp and violent drop
in the market, as multiple bid levels are taking out in a rerun of what
happened in December.
Amazonで買物をしてContrarianJを応援しよう Silver Outperforming Gold 2 Adam Hamilton July 26, 2019 3232 Words Silver has blasted higher in the last couple weeks, far outperforming gold. This is certainly noteworthy, as silver has stunk up the precious-metals joint for years. This deeply-out-of-favor metal may be embarking on a sea-change sentiment shift, finally returning to amplifying gold’s upside. Silver is not only radically undervalued relative to gold, but investors are aggressively buying. Silver’s upside potential is massive. ここ2週シルバーは急騰した、ゴールドを遥かに凌ぐものだ。これは注目すべきことだ、もう何年もシルバーはひどいものだった。この極端に嫌われた金属が大きく心理を買えている、とうとうゴールド上昇を増幅するに至った。シルバーは対ゴールドで極端に過小評価されているだけでなく、投資家は積極的に買い進んでいる。シルバーの潜在上昇力は巨大なものだ。 Silver’s performance in recent years has been brutally bad, repelling all but the most fanatical contrarians. Historically silver prices have been mostly ...
結局、中国は隣国日本で20年前に起きたことを学んでいなかったということでしょう、というかどの国もどの政府も十分成熟するまでは「わかっちゃいるけどやめられない」ということでしょうね、きっと。 Spooked By Apple? Wait ‘Til China’s Bubble Bursts Written by Jesse Colombo | Jan, 3, 2019 Apple stock plunged nearly 10% on Thursday after the company cut its revenue forecast due to slowing iPhone sales in China. Apple’s woes dragged U.S. stock indices lower by more than 2% as fears of a more extensive China-driven slowdown spread. アップルの株価は火曜に約10%下落した、同社が中国でのiPhone売上原則を予想したためだ。アップルの弱さが米国株式指数を2%以上押し下げた、中国主導でさらなる原則が広がるのではという懸念からだ。 From the New York Times : ニューヨークタイムスによると: For years, no matter what was happening elsewhere, global companies bet billions upon billions of dollars that China’s consumers would keep spending money. 長年、他国で何が起きようとも多国籍企業は中国消費は巨額を維持することに賭けてきた。 Now, just when the world economy could use their financial firepower, they are no longer so quick to open their wallets. 今や、世界経済が金融弾薬を用いてももはや彼らの財布を緩めることはできない。 The latest sign of a slowdown in...
多量のオピオイドを米国に送り込み、米国で深刻な麻薬中毒問題を引き起こしています。現代版「阿片戦争」です。あのトヨタ初の女性取締役もオピオイド中毒で逮捕解任されましたよね。 US Is Dependent On China For Almost 80% Of Its Medicine by Tyler Durden Fri, 05/31/2019 - 12:55 Experts are warning that the U.S. has become way too reliant on China for all our medicine , our pain killers, antibiotics, vitamins, aspirin and many cancer treatment medicine. 専門家はこう警告する、米国はすべての医薬品、痛み止め、抗生物質、ビタミン、アスピリン、各種抗がん剤で、中国依存度が高すぎる。 Fox Business reports that according to FDA estimates at least 80 percent of active ingredients found in all of America’s medicine come from abroad, primarily from China . And it’s not just the ingredients, China wants to become the world’s dominant generic drug maker. So far Chinese companies are making generic for everything from high blood pressure to chemotherapy drugs. 90 percent of America’s prescriptions a...
Barrick’s average quarterly production since Q4’16 plunged an astounding 8.6% YoY. The reason Barrick’s management blew $6.5b in stock buying Randgold is they desperately needed more production to mask the precipitous drop in their own. Barrick’s total 2018 production of 4525k ounces was 18.0% below the 5516k it mined only a couple years earlier in 2016. At best adding Randgold just regains those losses. Barrickの平均四半期生産は2016Q4以来なんとYoYで8.6%下落している。Barrickの取締役が$6.5Bも投じてRandgoldの株式を購入した理由は、彼らはなんとしても急落する自らの生産量を隠すために生産量増加としたかったからだ。Barrickの2018全生産量は4525Kオンスで、わずか2年前の5516kオンスから18.0%も少ない。Randgoldを買収したところでこの下落を補うに過ぎない。 And GOLD has been suffering the same production struggles as ABX. Over its past 4 reported quarters, Randgold’s gold mined has fallen an average of 7.4% YoY. Can bringing two rapidly-depleting major gold miners together magically make a stronger one? I doubt it. Barrick’s reported production will enjoy a big temporary boost...
S&P Surges To Key Technical Level - Now What? by Tyler Durden Tue, 02/12/2019 - 12:03 Having failed twice last week, the S&P 500 is once again testing its 200DMA as hopes of a border/shutdown deal, a lack of collusion, China trade dreams, and an easy Fed are prompting stocks to new post-Xmas dip highs... 先週二回失敗し、S&P500がまたもや200日移動平均に挑戦している、国境の壁/政府閉鎖問題解決、ロシア疑惑解消、中国貿易改善そしてFEDのハト派姿勢、これらがクリスマス下落後の高値を推進している・・・ The S&P 500 is at its highest since Dec 4th... S&P500は12月4日以来の高値だ・・・ What happens next? では次はどうなる? Earnings recession? Meh, don't worry about it... 収益による景気後退? 別に心配することではない・・・・ Oh and don't worry - Fed Chair Powell just told everyone that he "doe...