As Goldman's Andrew Tilton (Chief Asia Economist) suggested:
ゴールドマンサックスのAndrew Tilton(アジアエコノミスト主任)はこう示唆する:
"There are reasons to be concerned [that easing is becoming less effective].
Local government officials who typically implement infrastructure
spending and other forms of stimulus are facing conflicting pressures.
The emphasis in recent years on reducing off-balance-sheet borrowing,
selecting only higher-value projects, and eliminating corruption has
made local officials more cautious. But at the same time, the
authorities are now encouraging local officials to do more to support
growth, like accelerate infrastructure projects. President Xi himself
recently acknowledged the incentive problems and administrative burdens
facing local officials."
And Nomura's Ting Lu has an explanation for why China stimulus i snot working... Chinese easing- / stimulus- escalation being a likely
requirement for any sort of “reflation” theme to work beyond a tactical
trade:
そしてノムラのTing Luはこう解説する、どうして中国の刺激策が機能しないかについて・・。中国の緩和/刺激策拡大にはある種の「リフレーション」が必要で戦略的な功罪が伴う:
yes, more RRR cuts are coming eventually (a better way for Chinese
banks to obtain liquidity vs borrowing from MLF or TMLF, bc it’s cheaper
and more stable)... ...but that the timing of such a cut is primarily dependent on the Chinese stock market, asthe
“re-bubbling” happening real-time in Chinese Equities (CSI 300 +26.8%
YTD; SHCOMP +24.4%; SZCOMP +34.0%) likely then constrains the room and
pace of Beijing’s policy easing / stimulus
This “Chinese Equities rally effectively holding further RRR cuts
hostage” then could become a serious “fly in the ointment” for near-term
/ tactical “reflation” (or bear-steepening) themes, as Q2 is on-pace to
see a significant liquidity shortage.
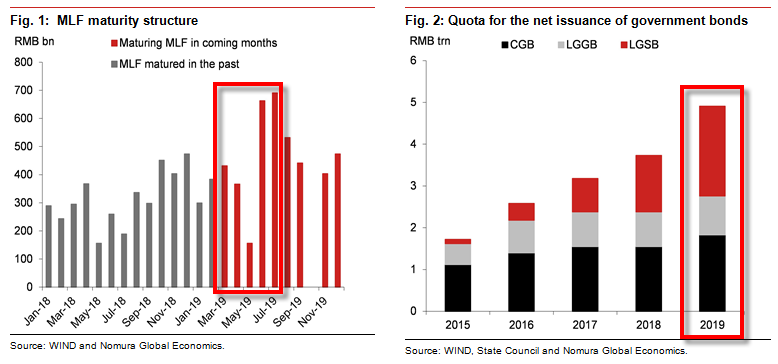
Ting estimates the liquidity gap could reach ~ RMB 1.7T in Q2 due to the following factors:
The size of the upcoming MLF maturities (est to be ~RMB 1.2T in Q2); 今後のMLF中期債権満期規模(Q2にRMB1.2Tと見積もられている);
The size and pace of (both central and local) government bond issuance (Nomura ests a target of ~ RMB 1T for Q2); 中央地方政府債券発行の規模とペース(ノムラはQ2にRMB1Tと見積もる);
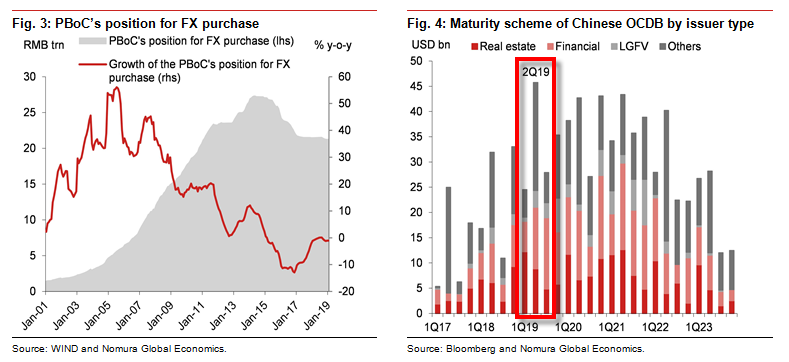
Tax season effects; and 納税時期効果;そして
The shortage of money supply through the PBoC’s FX purchases 中国人民銀行の為替取引でのマネーサプライ不足
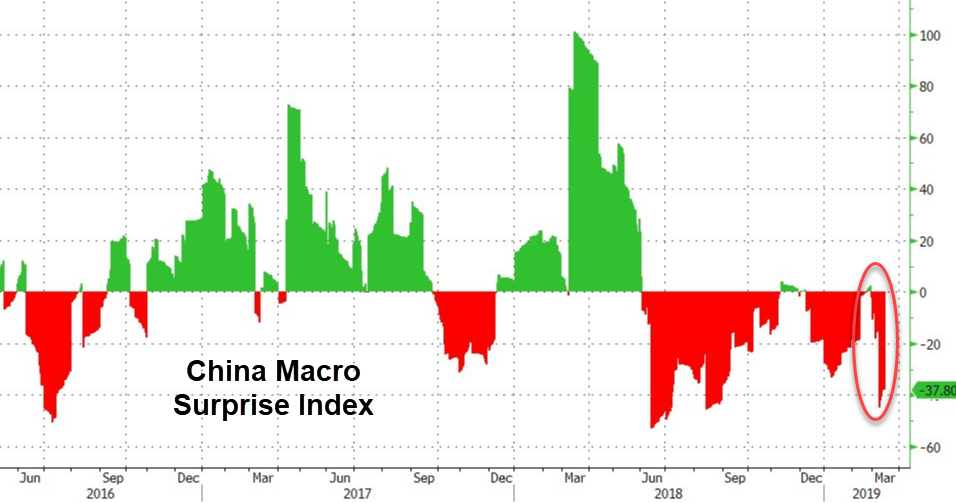
CHINA’S COMING Q2 LIQUIDITY-SHORTAGE:
So, simply put, China is merely refilling a rapidly leaking bucket of liquidity, as opposed to sloshing more into the bath of global risk - even if Chinese stocks were embracing it.
How Are Gold And Money Supply Related? by Tyler Durden Sun, 06/14/2020 - 13:00 Authored by Mike Shedlock via MishTalk, M2 Money Supply is surging. Will gold follow? M2マネーサプライが急増している。ゴールドはこれを追従するだろうか? Let's investigate an alleged relationship between gold and M2, a measure of money supply in the US. よく言われるM2(米国のマネーサプライ指標)とゴールドの関係について調べてみよう。 "There’s a clear correlation between the annual growth rate in M2 money supply and the price of the yellow metal. " 「M2の年率増加速度とゴールド価格の間には明らかな相関がある。」 Clear Correlation? 明らかな相関? The Tweet claims something different than my lead chart depicts. So let's investigate the above idea in other time frames. このツイートの主張は私が示す最初のチャートが示すものとは異なる。というわけでこのtweetの主張を別の時間フレームで見てみよう。 Gold vs Rate of Change in M2 Money Supply ゴールド vs M2マネーサプライの変化率 If we look at longer time frames, the rate of increase in M2 theory falls flat on its face....