Authored by Alasdair Macleod via GoldMoney.com, Note: this article is not and must not be construed as investment
advice. It is analysis based purely on economic theory and empirical
evidence. この記事は単なる分析であり、投資を推奨するものではない。
The global economic outlook is deteriorating. Government
borrowing in the deficit countries will therefore escalate. US Treasury
TIC data confirms foreigners have already begun to liquidate dollar
assets, adding to the US Government’s future funding difficulties. The
next wave of monetary inflation, required to fund budget deficits and
keep banks solvent, will not prevent financial assets suffering a severe
bear market, because the scale of monetary dilution will be so large
that the purchasing power of the dollar and other currencies will be
undermined. Failing fiat currencies suggest the dollar-based financial
order is coming to an end. But with few exceptions, investors own
nothing but fiat-currency dependent investments. The only portfolio
protection from these potential dangers is to embrace sound money -
gold.
The global economy is at a cross-road, with
international trade stalling and undermining domestic economies. Some
central banks, notably the European Central Bank, the Bank of Japan and
the Bank of England were still reflating their economies by supressing
interest rates, and the ECB had only stopped quantitative easing in
December. The Fed and the Peoples’ Bank of China had been tightening in
2018. The PBOC quickly went into stimulation mode in November, and the
Fed has put monetary tightening and interest rates on hold, pending
further developments.
It is very likely this new downturn will be substantial. The
coincidence of the top of the credit cycle with trade protectionism last
occurred in 1929, and the subsequent depression was devastating.
The reason we should be worried today is stalling trade disrupts the
capital flows that fund budget deficits, particularly in America where
savers do not have the free capital to invest in government bonds. Worse
still, foreigners are now not only no longer investing in dollars and
dollar-denominated debt, but they are suddenly withdrawing funds.
According to the most recent US Treasury TIC data, in December and
January these outflows totalled $257.2bn. At this rate, not only will
the US Treasury need to fund a deficit likely to exceed a trillion
dollars in fiscal 2019, but the US markets will need to absorb
substantial sales from foreigners as well.
In short, America is going to face a funding crisis. To
have this funding problem coinciding with the ending of credit
expansion at the top of the credit cycle is a lethal combination, as yet
unrecognised as the most important factor behind both American and
global economic prospects. The problem is bound to emerge in coming
months.
While today’s trade protectionism is less vicious than the
Smoot-Hawley Tariff Act, America’s drawn-out trade threats today are
similarly destabilising. The top of the credit cycle in 1929 was
orthodox; its principal effect had been to fuel a speculative stock
market frenzy in 1927-29.
This time, the credit bubble is proportionately far larger, and its
implosion threatens to be even more violent. Governments everywhere are
up to their necks in debt, as are consumers. Personal savings in
America, the UK and in some EU nations are practically non-existent. The
potential for a credit, economic and systemic crisis is therefore
considerably greater today than it was ninety years ago.
Bearing in mind the Dow fell just under 90% from its 1929 peak, the
comparison with these empirical facts suggests we might experience no
less than a virtual collapse in financial asset values. However, there
is an important difference between then and now: during the Wall Street
crash, the dollar was on a gold standard. In other words, the
price-effect of the depression was reflected in the rising purchasing
power of gold. This time, no fiat currency is gold-backed, so a major
credit, economic and systemic crisis will be reflected in a falling
purchasing power of fiat currencies.
The finances of any government whose unbacked currency is the
national pricing medium are central to determining future general price
levels. Just taking the US dollar for example, the government’s debt to
GDP ratio is over 100% (in 1929 it was less than 40%). At the peak of
the cycle, the government should have a revenue surplus reflecting
underlying full employment and the peak of tax revenues. In 1929, the
surplus was 0.7% of estimated GDP; today it is a deficit of 5.5% of GDP.
In 1929, the government had minimal legislated welfare commitments, the
net present value of which was therefore trivial. The deficits that
arose in the 1930s were due to falling tax revenues and voluntary
government schemes enacted by Presidents Hoover and Roosevelt. Today,
the present value of future welfare commitments is staggering, and
estimates for the US alone range up to $220 trillion, before adjusting
for future currency debasement.
Other countries are in a potentially worse position, particularly in
Europe. A global economic slump on any scale, let alone that approaching
the 1930s depression, will have a drastic impact on all national
finances. Tax revenues will collapse while welfare obligations escalate.
Some governments are more exposed than others, but the US, UK, Japan
and EU governments will see their finances spin out of control.
Furthermore, their ability to cut spending is limited to that not
mandated by law. Even assuming responsible stewardship by politicians,
the expansion of budget deficits can only be financed through monetary
inflation.
That is the debt trap, and it has already sprung shut on minimal
interest rates. For a temporary solution, governments can only turn to
central banks to fund runaway government deficits by inflationary means.
The inflation of money and credit is the central banker’s cure-all for
everything. Inflation is not only used to finance governments but to
provide the commercial banks with the wherewithal to stimulate an
economy. An acceleration of monetary inflation is therefore guaranteed
by a global economic slowdown, so the purchasing power of fiat
currencies will take another lurch downwards as the dilution is
absorbed. That is the message we must take on board when debating
physical gold, which is the only form of money free of all liabilities.
Gold can only give an approximation of the loss of purchasing
power in a fiat currency during a slump, because gold’s own purchasing
power will be rising at the same time. Between 1930 and 1933
the wholesale price index in America fell 31.6% and consumer prices by
17.8%. These price changes reflected the increasing purchasing power of
gold, because of its fixed convertibility with the dollar at that time.
Therefore, the change in purchasing power of a fiat currency is only
part of the story. However, the comparison between purchasing powers for
gold and fiat currency is the most practical expression of the change
in purchasing power of a fiat currency, because the choice for economic
actors for whom gold has a monetary role is to prefer one over the
other.
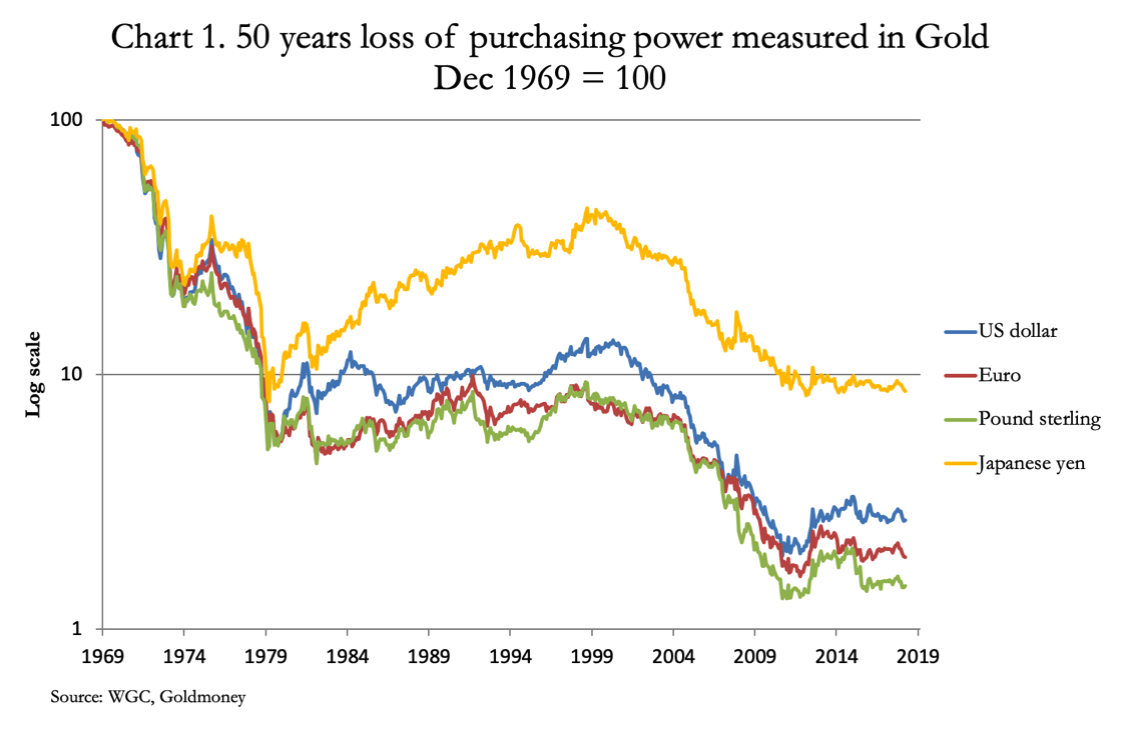
It is an ongoing process, about to accelerate. Chart
1 shows how four major currencies have declined measured in gold over
the last fifty years. The yen has lost 92.4%, the dollar 97.42%,
sterling 98.5%, and the euro 98.2% (prior to 2001 the euro price is
calculated on the basis of its constituents).
The ultimate bankruptcy of currency-issuing governments, likely to be
exposed by the forthcoming slump, will be reflected in another lurch
downwards in currency purchasing powers.
It should become apparent as time progresses that the price of gold
in fiat currencies will continue to rise. The reasons are not yet clear
to the consensus of portfolio investors and speculators, but it is
likely that the more prescient among them will begin to realise that in
the event of a significant recession, slump or depression, the dollar
price of gold will rise substantially.
For the moment, they are likely to concentrate on timing, using
technical analysis, rather than thinking through economic concepts.
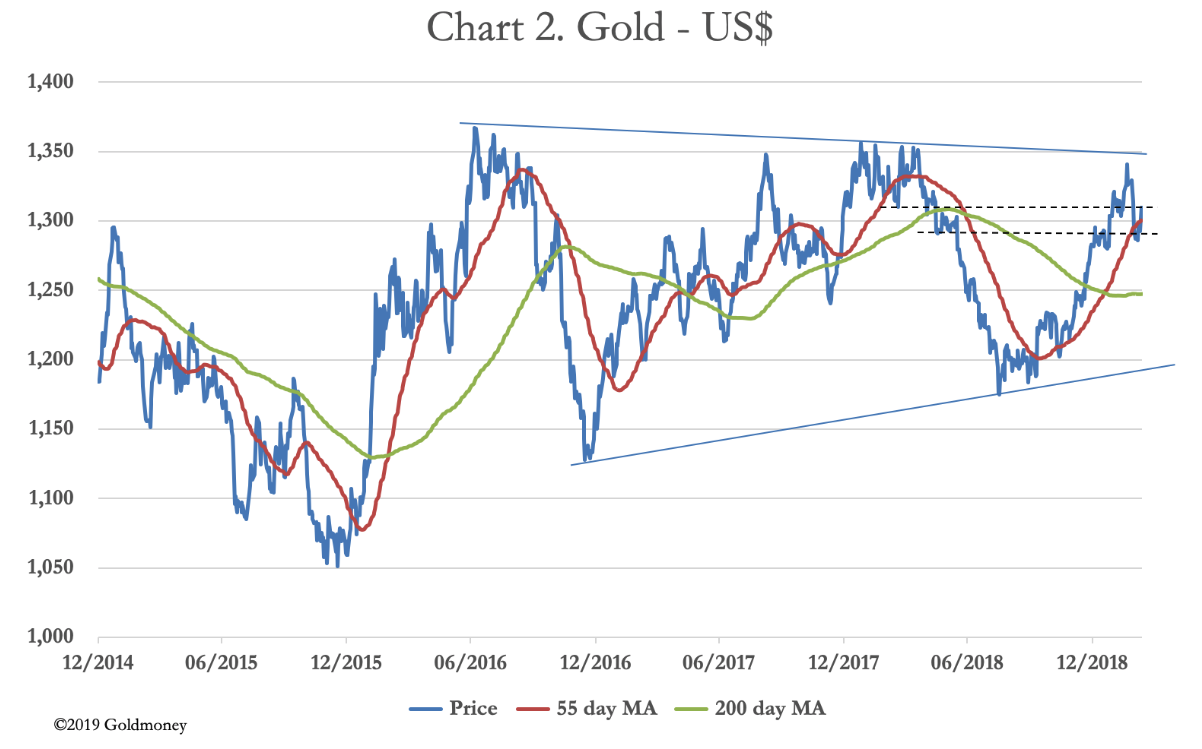
Chart 2 illustrates the current technical position.
Following its peak in September 2011, gold found a bottom at $1047 in
December 2015. That was followed by a 31% rally to $1375 in July 2016,
since when gold has established a triangular consolidation pattern. Last
August, the price sold off to $1160, becoming oversold to record
levels. That established the second point of a rising trend, marked by
the lower solid line.
In February the gold price mounted a challenge to the upper parameter
of the consolidation range before retreating to test established
support at $1280-$1305, shown by the pecked lines.
There is a good chance that another attempt to break through the
$1350 level will take place soon, and that it will succeed. The
following bullet points sum up this positive case:
The current rally commenced from a record oversold condition on
Comex. The selloff was consistent with extreme selling exhaustion,
indicating a major turning point.
The net managed-money position on Comex indicates the gold contract
is still moderately oversold. However, the April contract is running off
the board, which means that some 200,000 expiring contracts are still
to be sold, stand for delivery or rolled forward by the end of this
month (March). This suggests a little more consolidation may be needed
before gold advances to attempt a challenge on the $1350 level.
The 55-day and 200-day moving averages recently completed a bullish
golden cross, with the price above both signalling a bullish trend. A
retest of the 55-day MA occurred at the beginning of this month and is
normal.
If, as the chart suggests, a triangle pattern is emerging, it is an
ascending triangle, which is bullish. An ascending triangle has a flat
top and a rising base. Admittedly, the top line declines slightly but
not enough to put it in the class of symmetrical triangles, where the
eventual break-out direction is less certain.
It is possible for the gold price to trade another down leg within
the confines of the triangle before making its final breakout to the
upside. In which case, the gold price might decline towards the low
$1200s before making its upwards break.
The possibility that the ascending triangle might need longer to
play out leads to the common technical recommendation to wait until
gold breaks through the $1350-$1365 level before buying for the next leg
of the bull market.
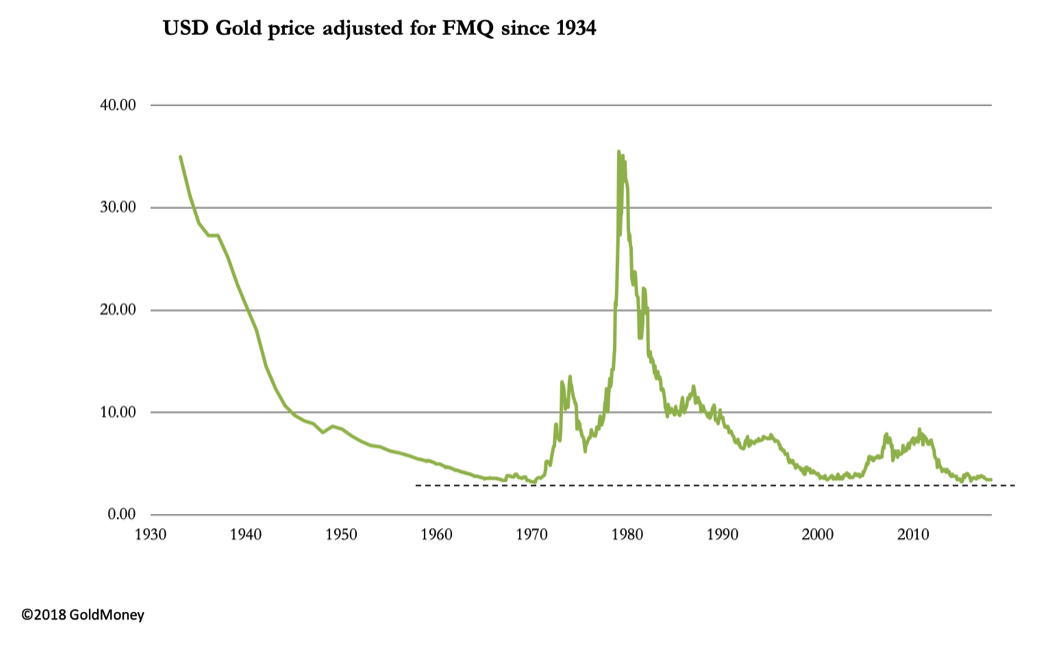
Chart 3 gives a longer-term perspective of gold’s valuation.
It is of the gold price adjusted by mine supply and for changes in the
fiat money quantity. Simply put, FMQ is the sum of cash, bank deposits
and savings accounts, and also bank reserves held at the Fed. It is the
total amount of fiat money both in circulation and available for
circulation.
In 1934-dollars, deflated by the increase in the fiat money
quantity, gold has returned to the extreme lows seen on only two
previous occasions. The first was when the London gold pool
failed in the 1960s followed by the collapse of the Bretton Woods
Agreement in 1971. At that time the decline in the FMQ-adjusted price of
gold since 1934 was fuelled by monetary expansion until a point was
reached which could go no further. This led to an explosive recovery
taking the price of gold in adjusted terms back to 1934 levels.
The realisation that the dollar faced the prospect of uncontrolled
price inflation forced the Fed to raise interest rates so that the
banks’ prime rate exceeded 21% in December 1980. This was sufficient to
prevent the gold price from further rises, and physical gold then became
the collateral of choice for a developing carry trade. Central bank
sales were designed to signal the demonetisation of gold and deter
buyers. They leased significant quantities of bullion for the carry
trade, which increased supply synthetically and drove the gold price
back to the same extreme valuation lows seen in the 1960s. This was
2000-2002.
After rallying from these extreme lows to a nominal high in September
2011, an increase in derivative supply coupled with the banking and
investment establishment retaining an increasingly rosy view of fiat
currencies have been instrumental in returning gold to the valuation
lows of the 1960s and 2000 – 2002.
It is in this context that the outcome predicted in Chart 2 should be
considered. If, as argued earlier in this article, America and the rest
of the world faces a global slump, a premium for physical gold is
likely to arise relative to the systemic risks of holding gold
substitutes, such as derivatives and even physically-backed ETFs. In
that event, a return to the 1934 price level for gold in FMQ-adjusted
terms before any further monetary dilution implies a nominal gold price
of about $24,000.
This conclusion does no more than indicate an upper
target for the price of gold adjusted for historic monetary inflation.
If, as seems likely, a developing credit crisis occurs as a consequence
of today’s events, the quantity of fiat money in issue will rise
significantly from current levels as government debt is monetised.
Therefore, given the extreme undervaluation of gold suggested by Chart
3, it is hard to see how the price of gold, measured in dollars, can go
much lower.
The gold market has three basic elements to it. ゴールド市場には基本的に3つある。
There is an underlying stock of approximately 170,000 tonnes, increasing at about 3,000 tonnes a year.
It is impossible to define how much of the total above-ground stock is
monetary gold, not least because jewellery in Asia is bought as a store
of monetary wealth and is used as collateral against loans. However, if
we are to classify Asian jewellery as non-monetary gold, then monetary
gold in the form of bars and coin is thought by many experts to
represent between thirty and forty per cent of the total. Assuming a
median estimate of 35%, this is 60,000 tonnes, of which 33,760 tonnes is
stated to be in national reserves. This leaves an estimated 26,240
tonnes of investment gold in public hands, worth $1.1 trillion. Much of
this can be regarded as being in long-term storage. For market purposes,
the physical market on its own is relatively illiquid.
Secondly, there are regulated futures and options markets, the most important of which is America’s Comex.
Currently, there are about 520,000 Comex contracts of 100 oz each
outstanding, which are worth a total of $68bn. Options on futures total a
further 220,000 contracts, which are impossible to notionally value,
being puts and calls at varying strike prices.
Third, there are unregulated OTC derivatives, mostly forward contracts in London. The
last Bank of International Settlements statistics estimated total gold
forwards and swaps were valued at $419bn, over six times the size of
Comex. In addition, there were $149bn of OTC options.
The liquidity is broadly confined to Comex, London forwards and other OTC media.
These are all derivatives, with minimal physical settlement taking
place. Consequently, the price of physical gold is not determined by the
marginal supply and demand for bullion, but almost entirely reflects
financial factors in the banking system. If financial market conditions
return to an approximation of the 1929-32 period for the reasons
described earlier in this article, there is likely to be a banking
crisis, or at the very least a serious dislocation of financial markets. Therefore, it is possible that at the same time investment funds and
private individuals seek to gain portfolio exposure to the gold price,
they will be doing so while the means of doing so are contracting, or
even disappearing altogether.
An outcome of this sort hinges on the depth and pace of economic
deterioration. Time will tell as to whether the current rapid
deterioration in the economic outlook goes on to replicate the 1929-32
precedent, but it is getting increasingly difficult to argue against it
happening. In which case, the gold price could rise rapidly due to its
current undervaluation, a shortage of monetary gold outside central bank
reserves, systemic disruption of paper markets and a renewed pace of
monetary inflation before the fiat-money investment community realises
what is happening.
If the combination of both a developing credit and trade
crises leads to a modern version of the 1929-32 global economic slump,
financial asset values will fall heavily. But this time, there
is the additional factor of a renewed acceleration of monetary
inflation, which at some point might offer some support to stock prices,
at least in nominal currency terms. In every hyperinflation, an index
of stock prices can perform well on this basis, but adjusted for the
currency’s loss of purchasing power, stock prices actually suffer
substantial losses.
That assumes, of course, the rest of the world’s economy is
broadly stable, which is almost certainly not going to be the case in
our scenario.
Additionally, the inflationary conditions of a fiat currency’s
twilight moments involve the market imposing increasing levels of
time-preference on everything, including bond prices. Therefore, the
discount between market prices and final redemption values widens
dramatically. Governments and other borrowers face a near-impossible
funding task, unless they are prepared to pay increasingly higher
interest coupons. Unlike the experience of the great depression when
interest rates reflected those of gold, this time bond yields paid in
fiat currencies will rise and continue rising.
This leads towards a different progression of notable
developments compared with 1929-32. An approximate sequence of how these
might evolve is described as follows:
1. Evidence of a looming recession becomes increasingly apparent.
Central banks respond in their time-honoured way, by easing monetary
policy and replacing stalling credit creation with extra base money.
Government bond prices rise as they are seen to be the least risky
investment in an uncertain economic outlook, and equities rally after an
initial sell-off. At the same time, lending bankers observe increasing
risk in commercial lending and respond by quietly withdrawing loan
facilities from all but the largest manufacturers of goods and producers
of services. This appears to approximate to the current situation.
2. With unsold inventory increasing, industrial production is
reduced, and rising numbers of workers are laid off. Analysts revise
their forecasts for corporate profits downwards, and the number of
corporate failures increases. Bond dealers adjust their expectations of
government borrowing, and quantitative easing is reintroduced by central
banks to ensure government bonds can be issued at suppressed interest
rates. At this stage, investors face a worrying combination of falling
equity prices reflecting a deteriorating economic outlook, combined with
unexpected monetary inflation in the form of QE.
3. Foreigners liquidate US investments in order to sell dollars (the
reserve currency – this appears to have started early) and repatriate
funds to support their base operations. Bond dealers facing a glut of
government bond issues expect bond yields to continue to rise. Stock
markets slide, and with it is a growing realisation that the recession
is turning into a wealth-destroying slump.
4. As the markets’ demands for increased time-preference undermine
all debtors’ finances, investors increasingly avoid bonds and equities,
abandoning hope of any recovery in financial asset prices. Hedging into
gold mines and gold ETFs gathers pace, and the purchasing power of gold
continues to rise measured against both fiat currencies and against the
commodity and energy complex.
5. Having fallen behind the time-preference demanded by markets,
central banks are reluctantly forced to raise overnight interest rates
to protect the currency and bring price inflation under control. They
have no choice, but this is seen as capitulation by investors.
Residential mortgage costs increase sharply, driving consumers into
negative equity as property prices suffer from forced selling. In
countries where the home has become the middle class’s principal asset,
the effect on consumer spending is devastating. Governments end up
bailing-out or bailing-in lenders while trying to moderate mortgage
interest costs.
6. By now, the gold price measured in unbacked currency is beginning
to discount a continuing acceleration in monetary inflation. The gold
price will be at multiples of current levels in all currencies,
including the dollar.
7. The sense of crisis escalates and mounting bad debts at the banks
raise the prospect of a systemic banking crisis. Despite depositor
protection schemes, depositors begin to take steps to reduce their bank
balances. With the facility to encash bank deposits being strictly
limited, alternatives to deposits in insolvent banks will be in high
demand. These will be gold, silver and other perceived stores of value.
Cryptocurrencies could come into their own as an escape route from
holding deposits in the banking system.
危機が進行し銀行の不良債権が積み上がるとシステマティックな銀行危機可能性を増やす。預金者保護の仕組みはあるが、預金者は銀行預金を引き出し始める。銀行預金からの引き出しは制限されており、支払いできない銀行の代替機能が強く求められる。これがゴールドやシルバーのようなstores of valueになるだろう。暗号通貨も銀行システムからの回避策として好まれるかもしれない。
8. Those who attempt to escape systemic risk by exchanging bank
balances for alternatives are simply passing bank deposits to the
vendors. This is fine, so long as vendors are happy to accept the
systemic risk. If not, then prices of alternative stores of value must
rise to compensate. A classic flight out of money into anything else
develops and is made more urgent by the lack of a cash alternative.
銀行を経由するシステムリスクを回避しようとする人は銀行預金でなく直接借り手にアクセスするだろう。借り手が受け入れるならこれもよかろう。そうでないなら、sotres of value代替システムの価格は高くなる。伝統的にみられる、マネーから他のものへの逃避が起き、キャッシュ代替品がそうないことが喫緊の課題となる。
9. The currency rapidly loses purchasing power, and it will be moving
into its end-of-life. Government bonds will have lost nearly all their
value, measured in gold, and governments will still be accelerating
inflationary financing, because bond financing without the central bank
buying them will not be possible.
During this process, with few exceptions financial assets will face annihilation.
A further problem is failing banks are the custodians of stock
entitlements, with few being directly registered in the beneficial
owners’ names. At best, this leads to a temporary loss of ownership. At
worst, it provides the means for confiscation.
An intense bear market destroys wealth. At some stage,
investors will begin to realise their portfolios are almost totally
exposed to fiat currency risk. The belief that inflation
hedges, such as overweight equities and underweight bonds, offer
protection against extreme monetary inflation will be disproved.
Investors will need a radical new approach, using sound money as their
performance criteria. This is cannot be an inflation index, which is
likely to become increasingly manipulated by statistical method. It has
to be gold, instead of rapidly depreciating fiat currency.
The problem investors will then face is mathematical. There
are probably less than 30,000 tonnes of monetary gold, excluding Asian
jewellery, in private hands, today worth about $1.1 trillion.
According to The Boston Consulting Group, in 2015 there were $71.4
trillion of portfolio assets, of which $36.1 trillion were in US
dollars. With the monetary gold held outside government reserves being
about 1.5% of portfolio assets, how do you replace non-performing
fiat-currency dependent assets with a portfolio designed with sound
money in mind?
This is why the return to sound money will destroy the West’s financial system, driving the purchasing power of gold higher, measured
against commodities, goods and services, while that of paper fiat moves
towards worthlessness. The destruction of financial wealth could easily
compare with 1929-32, and if it wipes out fiat currencies will be even
worse.
The removal of cash as an effective escape route for
investors fleeing systemic risk turns systemic risk directly into a
collapsing preference for money relative to goods, gold,
cryptocurrencies and the rest. Once it starts, it could happen quite
quickly.
How Are Gold And Money Supply Related? by Tyler Durden Sun, 06/14/2020 - 13:00 Authored by Mike Shedlock via MishTalk, M2 Money Supply is surging. Will gold follow? M2マネーサプライが急増している。ゴールドはこれを追従するだろうか? Let's investigate an alleged relationship between gold and M2, a measure of money supply in the US. よく言われるM2(米国のマネーサプライ指標)とゴールドの関係について調べてみよう。 "There’s a clear correlation between the annual growth rate in M2 money supply and the price of the yellow metal. " 「M2の年率増加速度とゴールド価格の間には明らかな相関がある。」 Clear Correlation? 明らかな相関? The Tweet claims something different than my lead chart depicts. So let's investigate the above idea in other time frames. このツイートの主張は私が示す最初のチャートが示すものとは異なる。というわけでこのtweetの主張を別の時間フレームで見てみよう。 Gold vs Rate of Change in M2 Money Supply ゴールド vs M2マネーサプライの変化率 If we look at longer time frames, the rate of increase in M2 theory falls flat on its face....