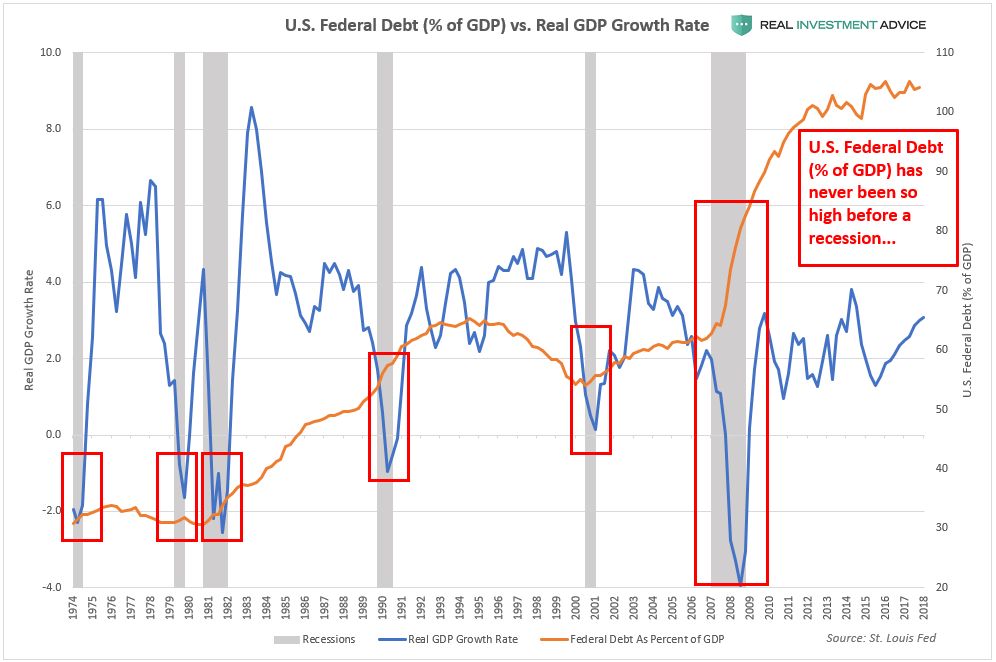
As the current economic cycle becomes increasingly long-in-the-tooth and macroeconomic and earnings data deteriorate, it is time to start thinking about the next recession. In particular, I wanted to point out that the U.S. federal debt burden has never been so high before a recession, as the chart below shows (hat tip to my Twitter follower @grimacemcdonald
for the idea). In past recessions (see gray bars on chart), the U.S.
federal government ramped up spending in order to help support the
economy. With federal debt at over 100% of the GDP (vs. 62% before the
Great Recession), however, it will be a much greater challenge to keep
the economy afloat in the coming recession.
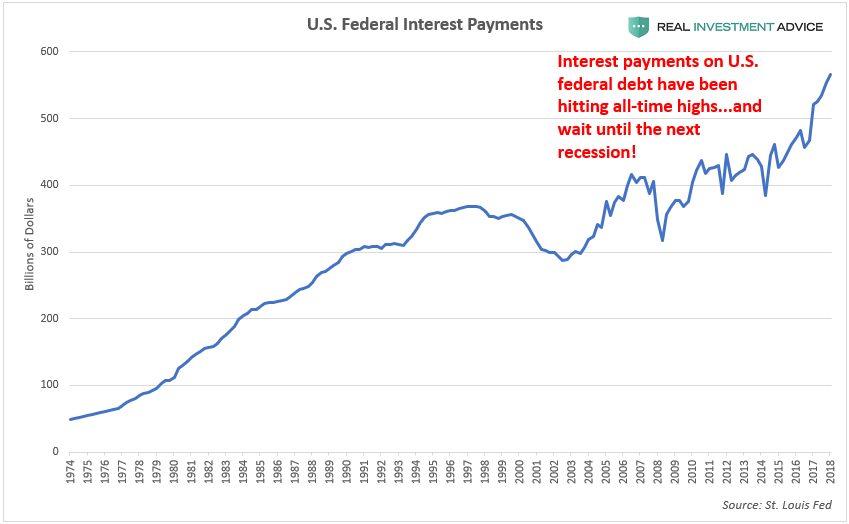
Though interest rates have been at ultra-low levels for the past
decade, the sheer amount of U.S. federal debt (over $22 trillion) is the
reason why interest payments have spiked over the past couple years. To
make matters worse, this debt will eventually need to be refinanced at
higher interest rates, which means that interest payments will rise even
more. Another recession combined with another ramp-up of federal debt
will cause these payments to rise even more. This is how sovereign debt
crises happen.
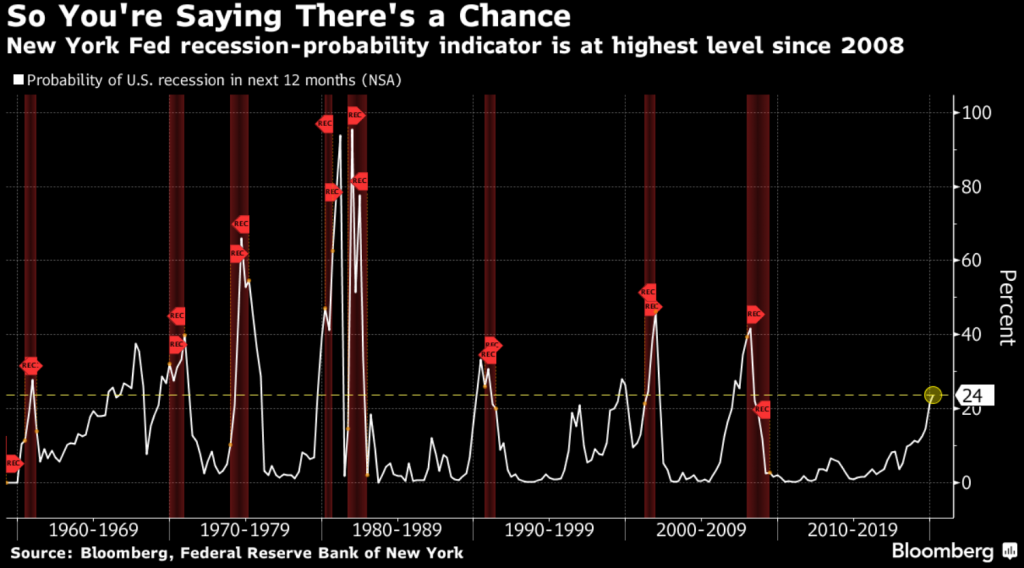
Think another U.S. recession is unlikely any time soon? As Lance Roberts has been saying,
the odds are much higher than most people think. For example, the
extremely accurate New York Federal Reserve recession indicator is now
at its highest level since 2008:
米国景気後退はまだ遠いと思うだろうか? Lance Rovertsがずっと言っているが、多くの人が思っているよりもその可能性は大きい。たとえば、これまでとても正確に予想実績のあるNew York FEDの景気後退指数は今や2008年以来で最高になっている:
Though the stock market has been rallying in the face of deteriorating data, now is not the time for complacency. In my view,
the fact that the stock market has been rallying for the past two
months is a sign of an extremely unhealthy market in which the
Fed/central banks are panicking and doing whatever they can to prop it
up as recession odds increase.
Please follow me on LinkedIn and Twitter to keep up with my updates. Please click here to sign up for our free weekly newsletter to learn how to navigate the investment world in these risky times.
How Are Gold And Money Supply Related? by Tyler Durden Sun, 06/14/2020 - 13:00 Authored by Mike Shedlock via MishTalk, M2 Money Supply is surging. Will gold follow? M2マネーサプライが急増している。ゴールドはこれを追従するだろうか? Let's investigate an alleged relationship between gold and M2, a measure of money supply in the US. よく言われるM2(米国のマネーサプライ指標)とゴールドの関係について調べてみよう。 "There’s a clear correlation between the annual growth rate in M2 money supply and the price of the yellow metal. " 「M2の年率増加速度とゴールド価格の間には明らかな相関がある。」 Clear Correlation? 明らかな相関? The Tweet claims something different than my lead chart depicts. So let's investigate the above idea in other time frames. このツイートの主張は私が示す最初のチャートが示すものとは異なる。というわけでこのtweetの主張を別の時間フレームで見てみよう。 Gold vs Rate of Change in M2 Money Supply ゴールド vs M2マネーサプライの変化率 If we look at longer time frames, the rate of increase in M2 theory falls flat on its face....