When
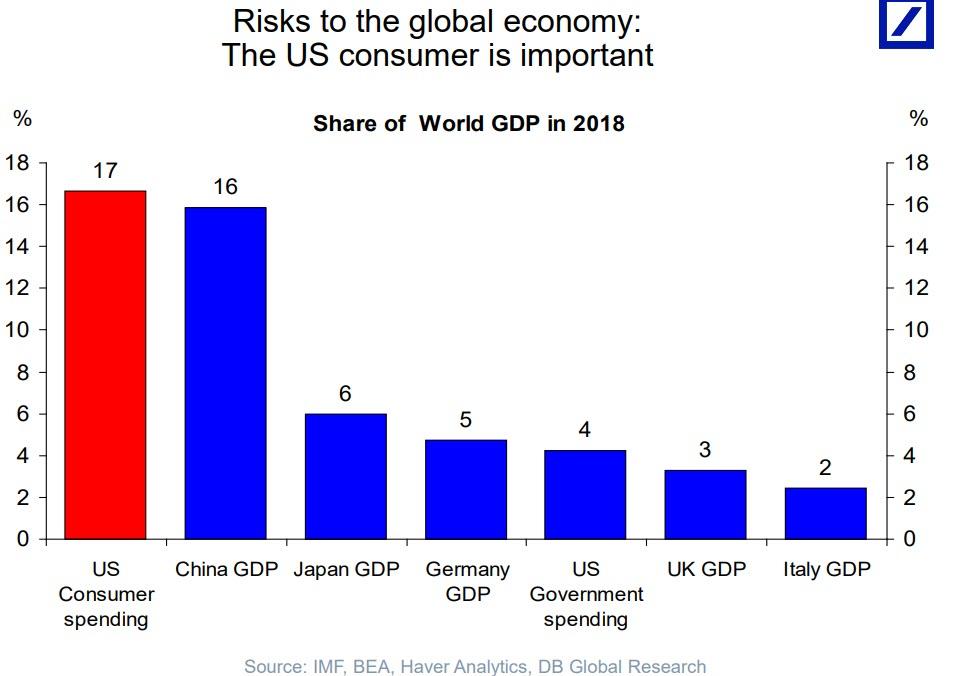
it comes to the growth dynamo behind the global economy, nobody can
match the US consumer - not even China: accounting for trillions in
annual spending, the US consumer, who represents roughly 70% of US GDP,
is also responsible for roughly 17% of global GDP, slightly ahead of the entire country of China.
世界経済の成長エンジンを議論する時、米国消費以上のものはないーー中国ではない:年間トリリオンドルを米国消費者は使っている、これが米国GDPの70%、そして世界GDPの17%を占める、中国全GDPよりも大きい。
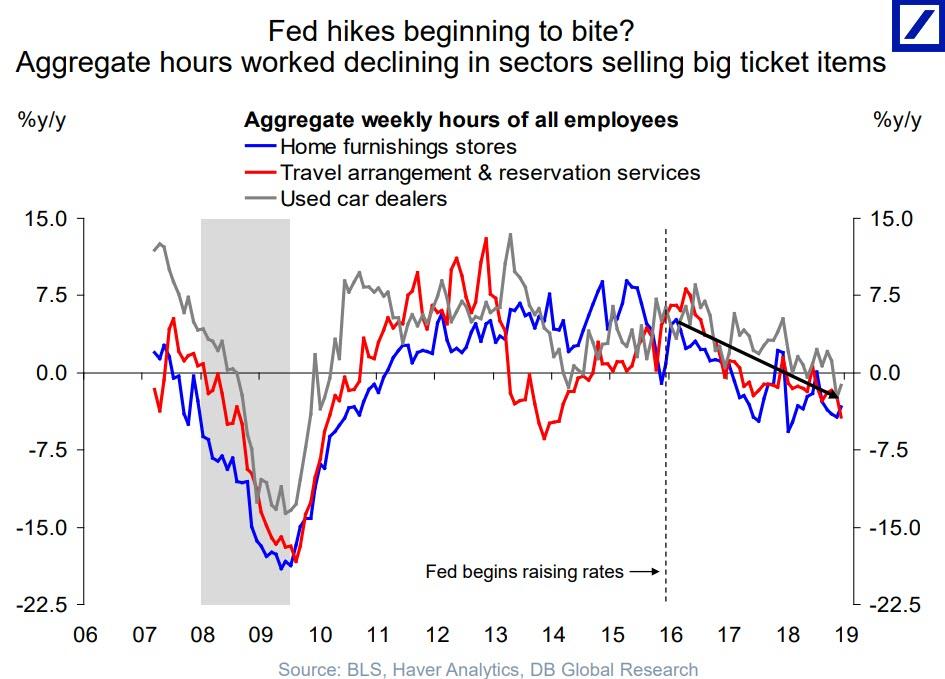
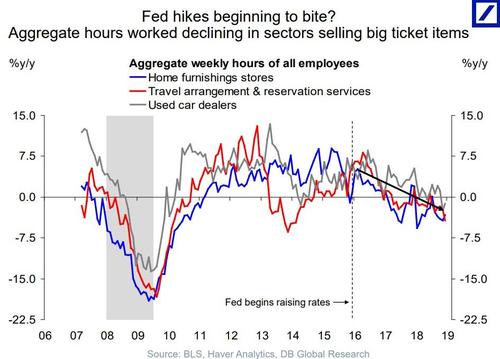
However, as recent economic data has shown, the future of the US
consumer is suddenly looking ominously cloudy, for two big reasons:
rising interest rates, which as Deutsche Bank notes are "beginning to
bite" as observed in the number of working hours in sector selling big
ticket items...
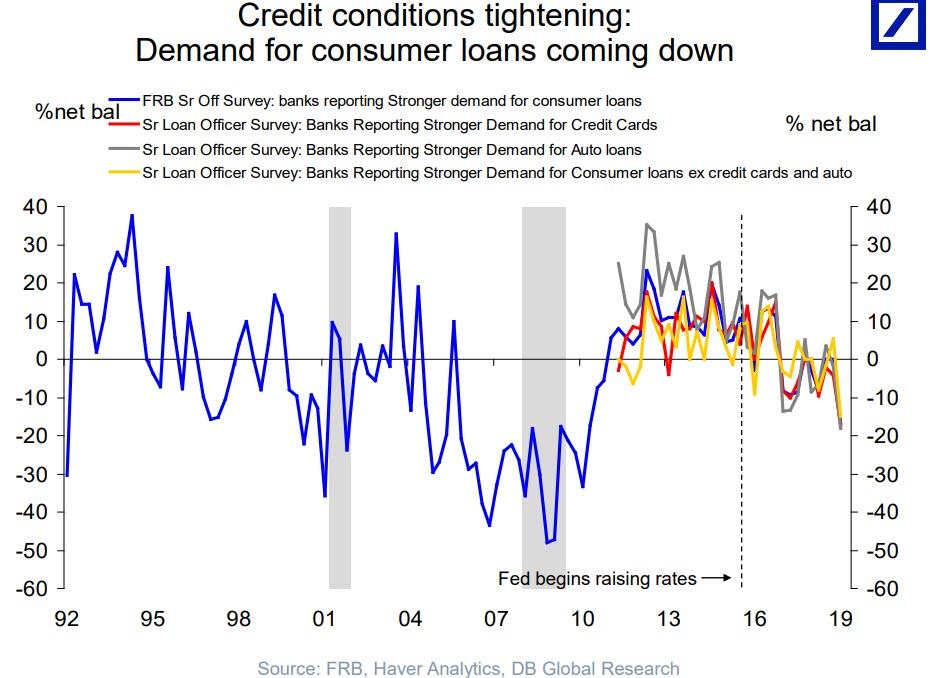
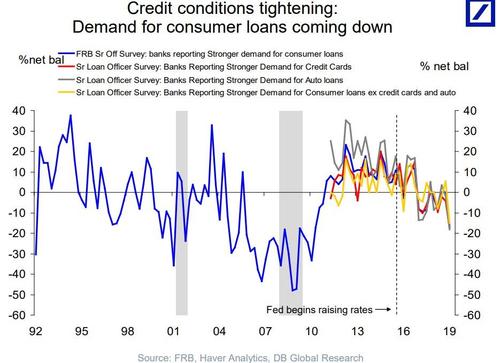
... and increasingly tighter loan terms, which coupled with softer
loan demand, means that the purchasing power of the US consumer is
suddenly facing a very troubling air pocket.
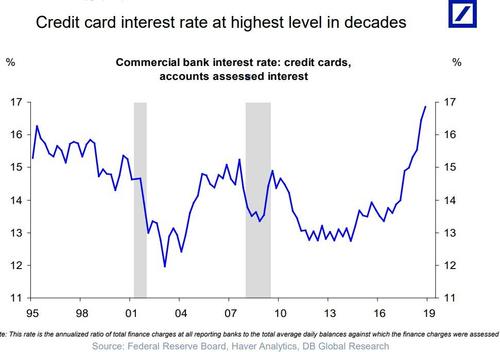
One driver behind the sudden drop in loan demand may also be the most
obvious one: interest rates on credit cards have soared to the highest
in over two decades...
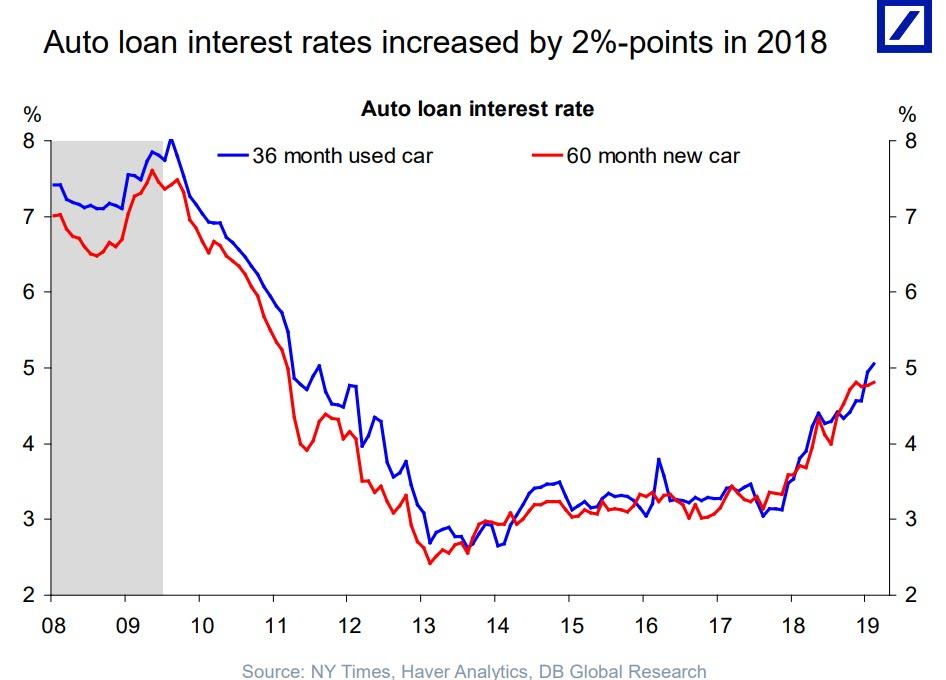
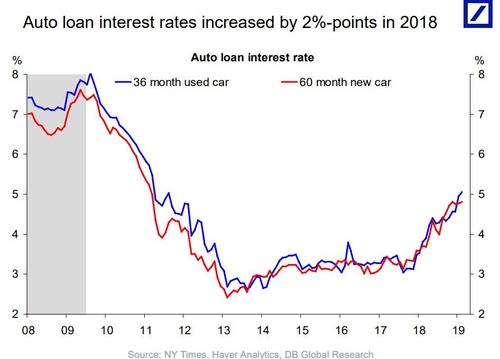
... while auto loan interest rates are now the highest since 2011,
and rapidly rising, making the average auto loan payment the highest on
record as discussed recently.
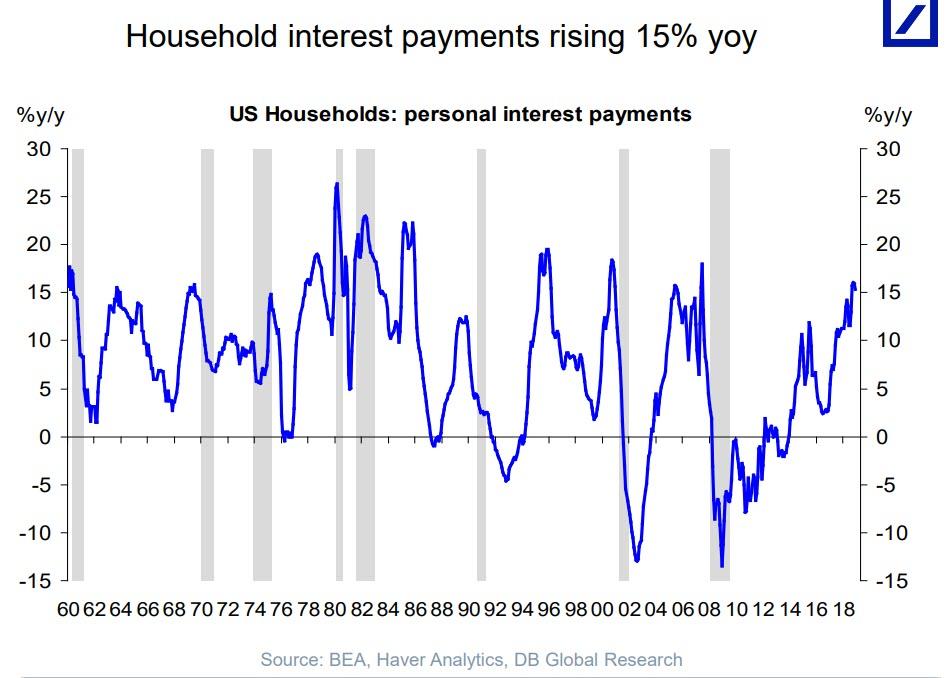
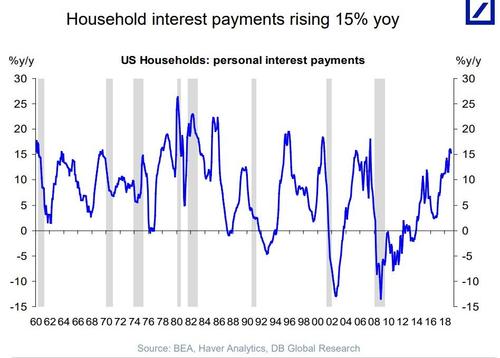
It's not just credit cards and auto loans: the aggregate household
interest payment has soared at a 15% Y/Y rate. Virtually every prior
time when interest payments spiked this much, a recession promptly
followed.
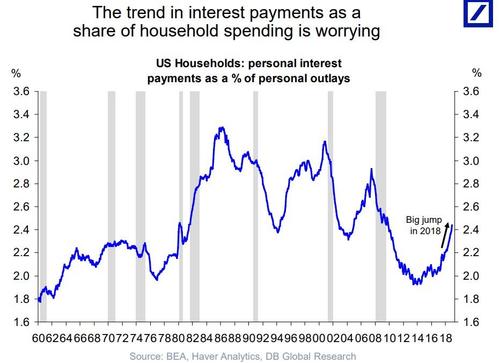
And while not quite at "redline levels" just yet, interest payments
as a share of total household spending has jumped to the highest level
since the financial crisis.
そしてまだ「赤線レベル」にはなっていないが、家計に占める利払い率は金融危機以来で最高レベルだ。
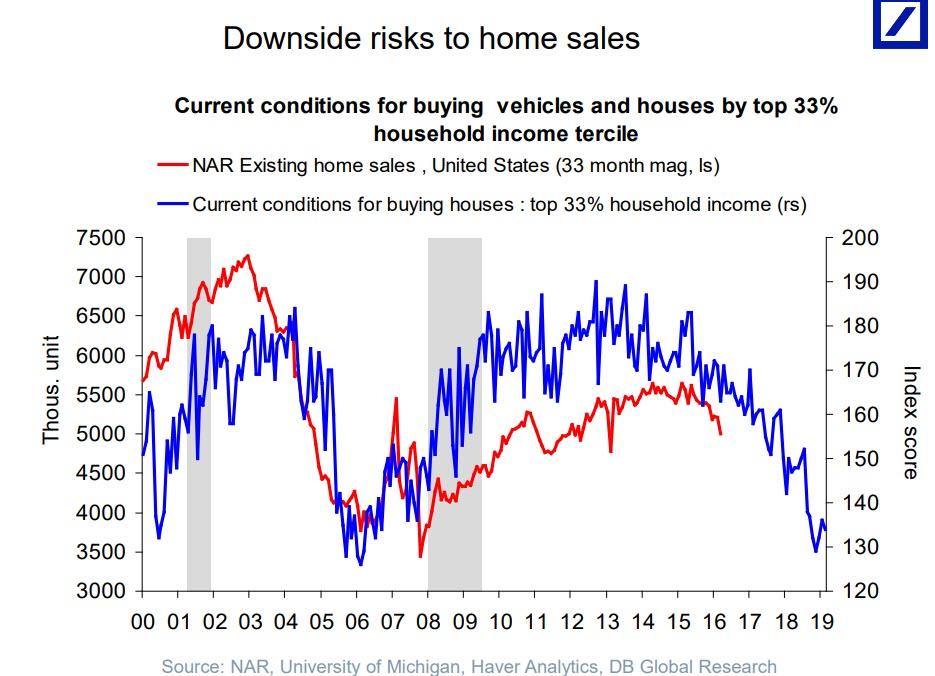
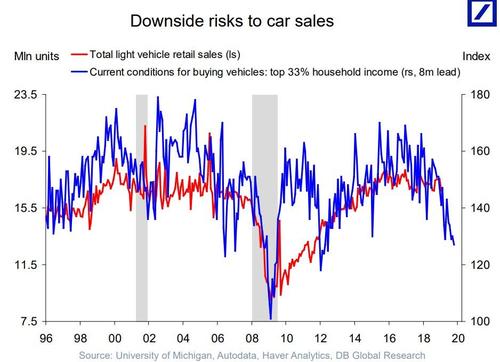
Meanwhile, as US purchasing power shrinks, so do intentions to purchase both cars...
それと同時に、米国の購買力は縮小している、自動車と・・・・
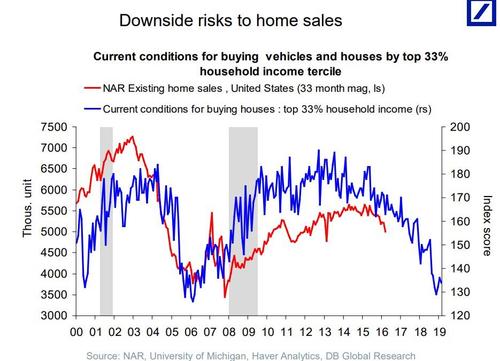
... and houses.
・・・・そして住宅だ。
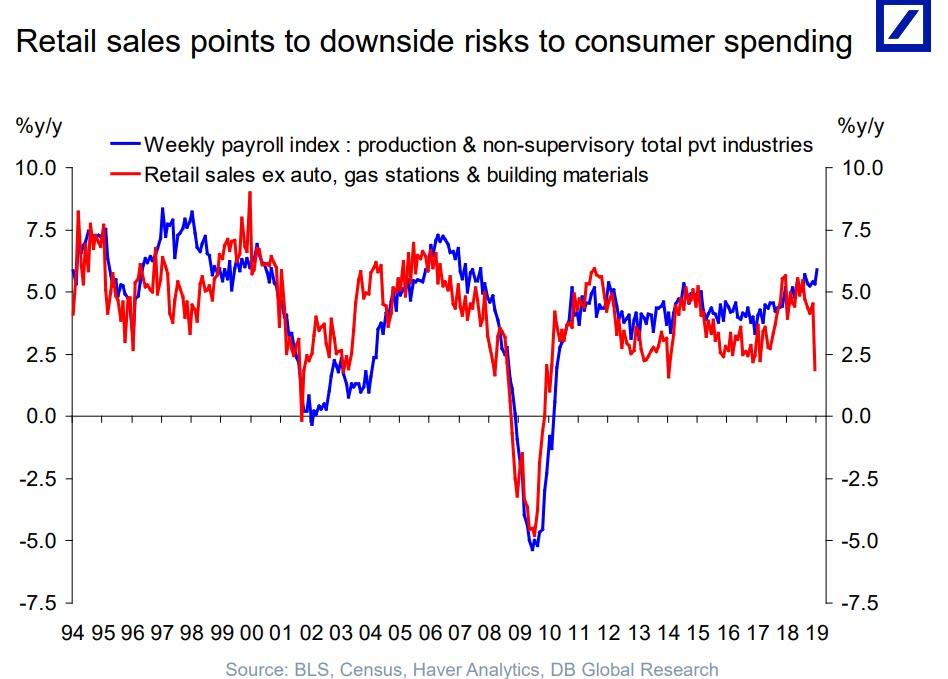
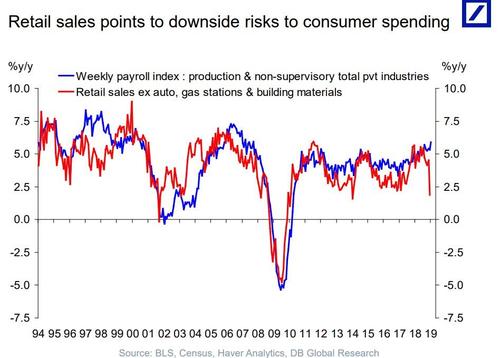
And while many legacy economists and pundits have said to ignore the
dismal December retail sales print, considering the collapse in spending
intentions for most other goods and services, it is only a matter of
time before consumer spending slides into recession (and the latest
retail sales print is confirmed as the accurate one).
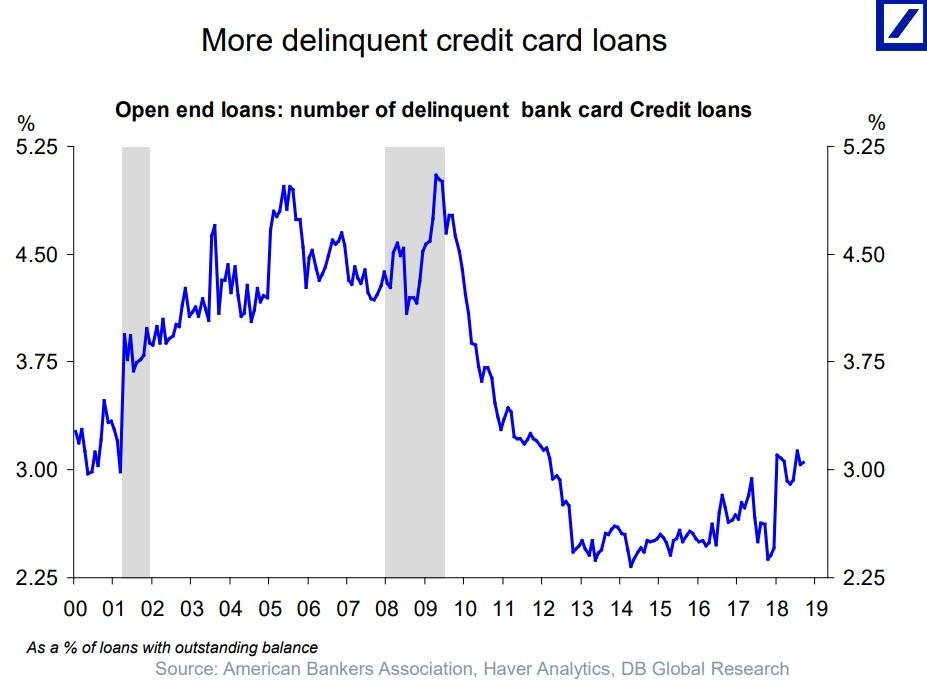
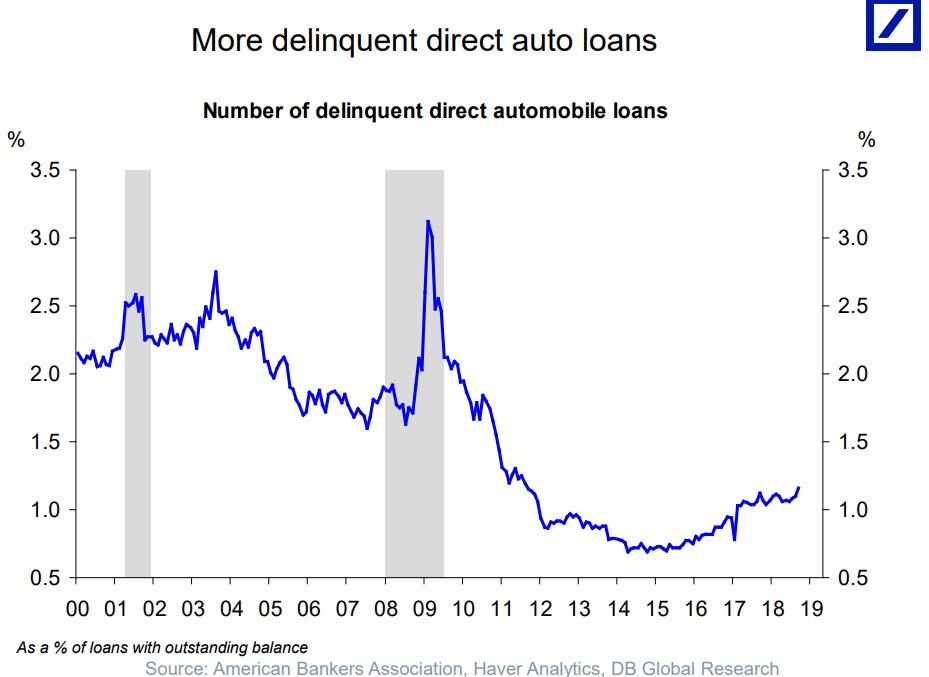
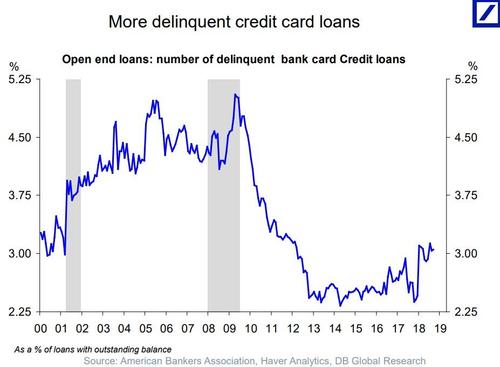
With rates rising, and with ever greater monthly payments, both credit card...
金利上昇に伴い、クレジットカードの毎月の支払いが大きくなり・・・・
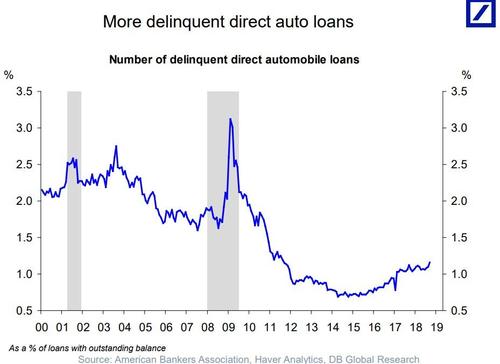
... and auto delinquencies are surging.
・・・自動車ローン返済遅延が上昇している。
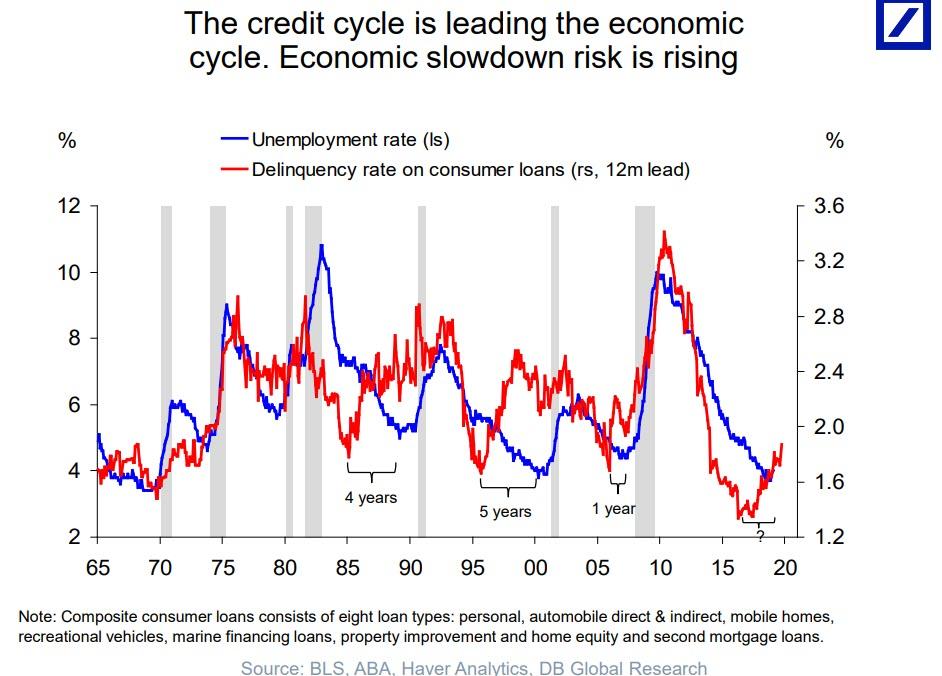
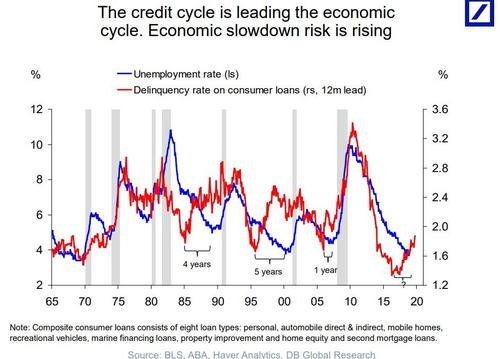
And so, with the credit cycle having peaked and absent rate cuts (and
QE) by the Fed, only set to make life for US consumers even more
difficult, it is just a matter of time before the economic slowdown
follows.
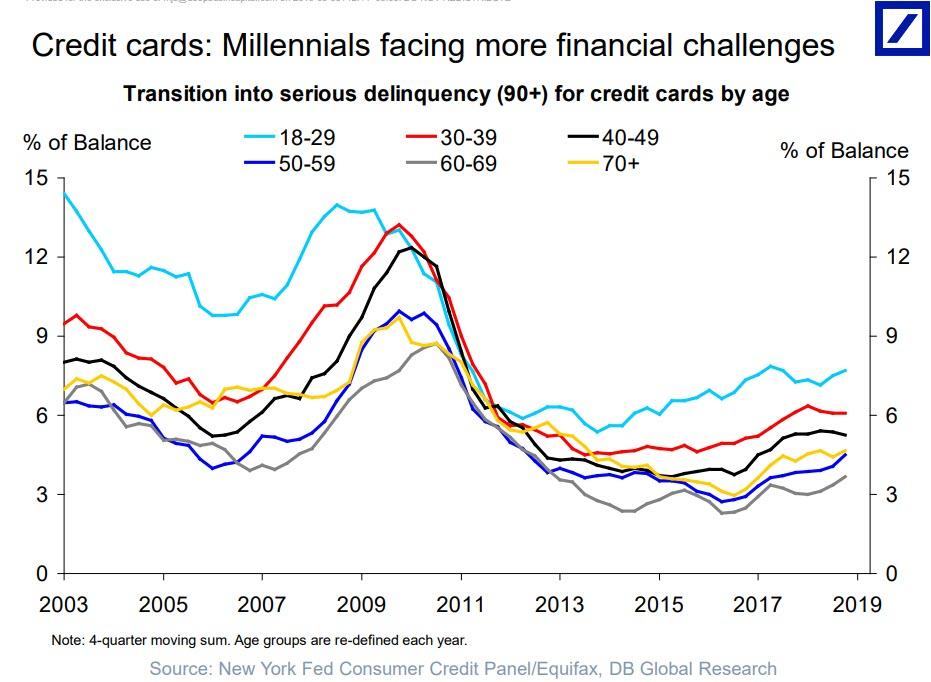
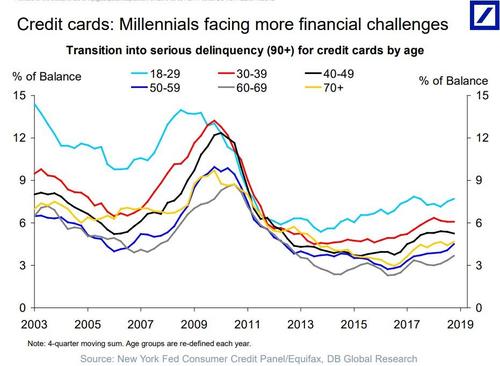
As usually happens, one generation is especially exposed to the
upcoming period of economic weakness: the millennials, whose delinquency
rate is already the highest among all age cohorts.
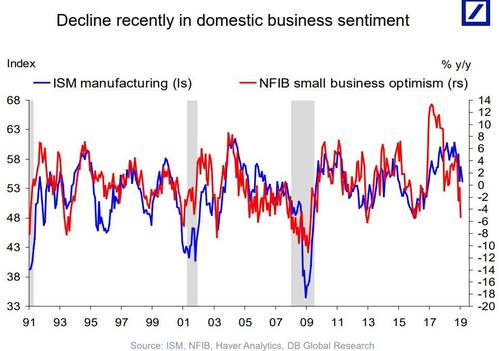
Finally, while all of the above have yet to hit the US economy where
GDP recently printed at a solid 2.6% in Q4, in Q1 GDP is expected to
plunge below 1% (Atlanta Fed has it at a paltry 0.3%); once that
happens, US small business confidence which is already plunging at the
fastest rate since the financial crisis after having soared higher after
the Trump election, will crater sending the US economy into a steep
recession if not worse.
How Are Gold And Money Supply Related? by Tyler Durden Sun, 06/14/2020 - 13:00 Authored by Mike Shedlock via MishTalk, M2 Money Supply is surging. Will gold follow? M2マネーサプライが急増している。ゴールドはこれを追従するだろうか? Let's investigate an alleged relationship between gold and M2, a measure of money supply in the US. よく言われるM2(米国のマネーサプライ指標)とゴールドの関係について調べてみよう。 "There’s a clear correlation between the annual growth rate in M2 money supply and the price of the yellow metal. " 「M2の年率増加速度とゴールド価格の間には明らかな相関がある。」 Clear Correlation? 明らかな相関? The Tweet claims something different than my lead chart depicts. So let's investigate the above idea in other time frames. このツイートの主張は私が示す最初のチャートが示すものとは異なる。というわけでこのtweetの主張を別の時間フレームで見てみよう。 Gold vs Rate of Change in M2 Money Supply ゴールド vs M2マネーサプライの変化率 If we look at longer time frames, the rate of increase in M2 theory falls flat on its face....
Is The Stock Market As Confused As You Are About A Recession? Written by Lance Roberts | Apr, 1, 2019 Last week, Barron’s ran an article entitled “The Stock Market Is Just As Confused About A Potential Recession As You Are?” To wit: 先週バロンズにこういう記事が掲載された「株式市場は景気後退を予感させるほどに混乱しているだろうか?」見てみよう: “Investors have long used where we are in the economic cycle to decide which stocks to buy and sell. New research from Nomura’s Joseph Mezrich flips that on its head by showing how investors can use stock performance to help determine where we are in the cycle. Too bad the market is sending mixed messages right now.” 長らく投資家は現在景気サイクルのどこに居るかを見てこの株式を売るか買うかを判断してきた。野村證券のJoseph Mezrichの最近の研究では、これが逆さで、投資家は株式のパフォーマンスを見て今景気サイクルのどこにいるかを判断している。最悪なことに現在相場は悪化改善混在のメッセージを送っている。」 But let’s be clear here; no one wants the party to end. So, despite a struggling stock market over the last year, slowing economic growth, and a collapsing yield curve, there are s...