And yet, Regan's less than prescient headline notwithstanding, he made an accurate point in his teaser, namely that "regular investors are leaving."
That, as we have pounded the table week after week after week, has been the real story of 2019 -
not the relentless, artificial melt-up in the market on the back of a
dovish reversal by central banks and the daily US-China trade talk
"optimism" which we now know is not happening.
Confirming that this trend continued for one more week, even as the
S&P hit new all time highs, Bank of America's strategist Jill Carey
Hall writes that last week, during which the S&P 500 was up +0.2%,
virtually everyone sold stocks, as "Institutional clients, hedge funds
and private clients sold the highs in equities last week." And yet,
somehow the S&P hit a new all time high. How? The answer: "Corporate buybacks ramped up."
このトレンドが更にもう一週続くことを確認して、S&Pが新高値となっても、BoAストラテジストのJill Carey Hallは先週こういう記事を書いた、S&P500が0.2%上昇しほとんど誰もが株式を売る中でこういう記事を書いたのだ、「法人顧客、ヘッジファンド、個人顧客は先週の高値で株式を売った」。それでもS&Pは新高値をつけた。どうしてか?その答えは:「自社株買いが積み上がった。」
As BofA elaborates, "buying was led by corporate buybacks, as
all other groups (hedge funds, institutional and retail clients) were
net sellers of equities for the second consecutive week." This
means that for one more week, traditional investors were - as Regan
noted above - boycotting stocks, and were delighted to sell stock back
to the companies that were once again aggressively buying back their own
stock with the S&P hitting all time highs, to wit:
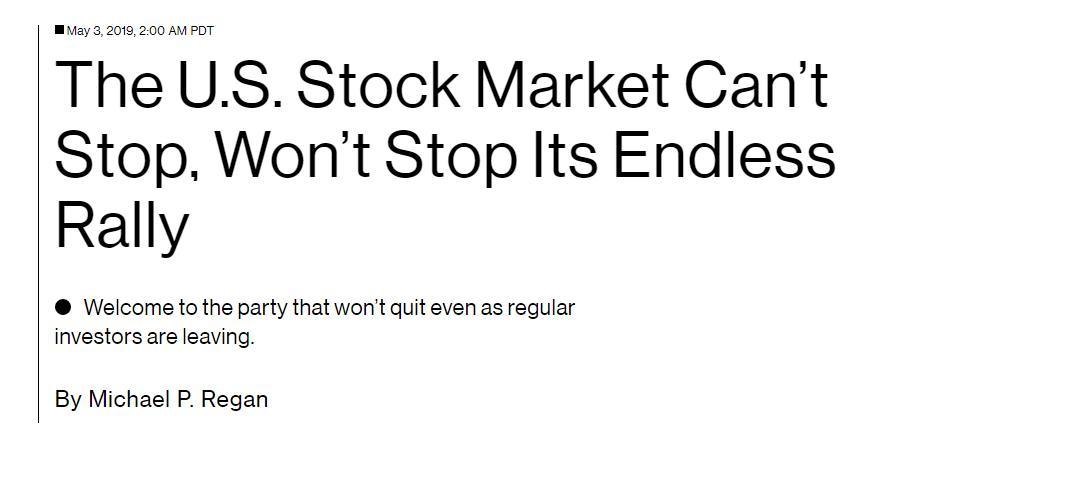
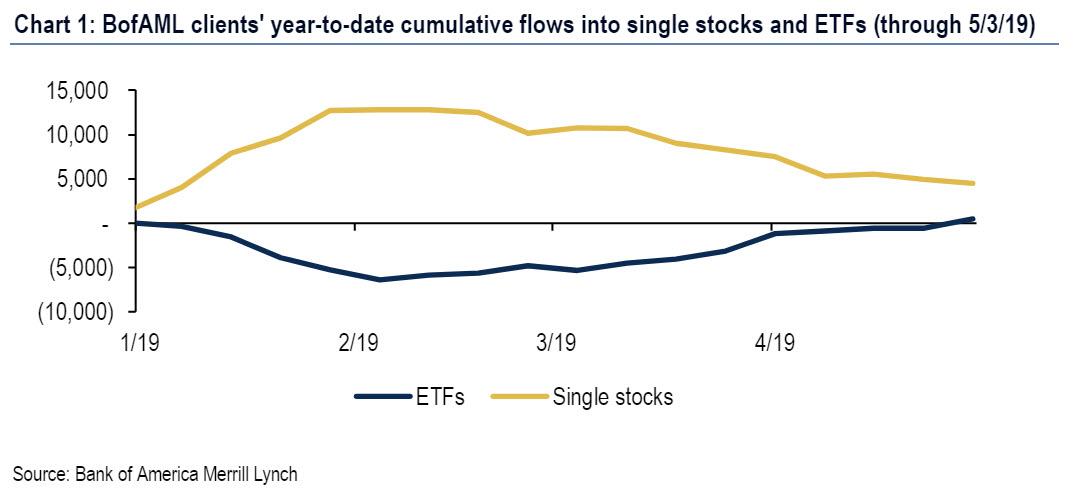
Clients were net sellers of single stocks (2nd straight week), but continued to buy ETFs (8th straight week). Cumulative flows into ETFs YTD turned positive, reversing outflows seen earlier this year (Chart 1).
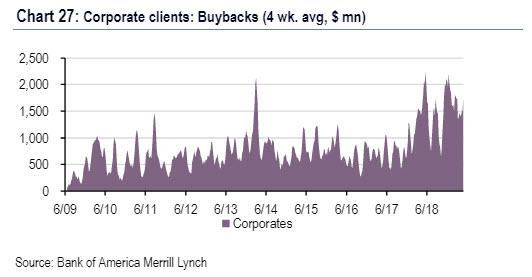
Buybacks last week were their highest since early Feb: they tend to
be strong during earnings seasons and seasonally peak in mid/late May. Buybacks YTD are +20% YoY, though the growth rate continues to decline.
But if everyone else was selling, how did buybacks offset the selling
avalanche? Simple: according to BofA's stock repurchase desk, "buybacks
last week were their highest since early Feb: they tend to be strong
during earnings seasons and seasonally peak in mid/late May. Buybacks YTD are +20% YoY, though the growth rate continues to decline."
While this means that we can once and for all forget about the
recurring lie of a buyback blackout period - which as we explained
before applies only to a very narrow subset of stock repurchases - it
also means that we have reached a level of market lethargy where stock
buybacks are powerful enough to offset all other selling. .
Is The Stock Market As Confused As You Are About A Recession? Written by Lance Roberts | Apr, 1, 2019 Last week, Barron’s ran an article entitled “The Stock Market Is Just As Confused About A Potential Recession As You Are?” To wit: 先週バロンズにこういう記事が掲載された「株式市場は景気後退を予感させるほどに混乱しているだろうか?」見てみよう: “Investors have long used where we are in the economic cycle to decide which stocks to buy and sell. New research from Nomura’s Joseph Mezrich flips that on its head by showing how investors can use stock performance to help determine where we are in the cycle. Too bad the market is sending mixed messages right now.” 長らく投資家は現在景気サイクルのどこに居るかを見てこの株式を売るか買うかを判断してきた。野村證券のJoseph Mezrichの最近の研究では、これが逆さで、投資家は株式のパフォーマンスを見て今景気サイクルのどこにいるかを判断している。最悪なことに現在相場は悪化改善混在のメッセージを送っている。」 But let’s be clear here; no one wants the party to end. So, despite a struggling stock market over the last year, slowing economic growth, and a collapsing yield curve, there are s...
How Are Gold And Money Supply Related? by Tyler Durden Sun, 06/14/2020 - 13:00 Authored by Mike Shedlock via MishTalk, M2 Money Supply is surging. Will gold follow? M2マネーサプライが急増している。ゴールドはこれを追従するだろうか? Let's investigate an alleged relationship between gold and M2, a measure of money supply in the US. よく言われるM2(米国のマネーサプライ指標)とゴールドの関係について調べてみよう。 "There’s a clear correlation between the annual growth rate in M2 money supply and the price of the yellow metal. " 「M2の年率増加速度とゴールド価格の間には明らかな相関がある。」 Clear Correlation? 明らかな相関? The Tweet claims something different than my lead chart depicts. So let's investigate the above idea in other time frames. このツイートの主張は私が示す最初のチャートが示すものとは異なる。というわけでこのtweetの主張を別の時間フレームで見てみよう。 Gold vs Rate of Change in M2 Money Supply ゴールド vs M2マネーサプライの変化率 If we look at longer time frames, the rate of increase in M2 theory falls flat on its face....
Amazonで買物をしてContrarianJを応援しよう Albert Edwards: This Was The Final Recessionary Shoe, And It Has Now Fallen by Tyler Durden Thu, 06/27/2019 - 12:45 Exactly three months ago, in late March, the 3 month-10 year spread inverted for the first time since 2007... ちょうど3か月前の3月遅くのことだ、3M10Yスプレッドが2007年以来初めて反転した・・・・ ... an event which sparked near-panic in the market as historically curve inversion has preceded the last 7 recessions. ・・・市場は準混乱状態になった、というのも歴史的に見てイールドカーブ反転が過去7回の景気後退の前兆となっているからだ。 However, while the inversion was certainly a memorable event, the question on everyone's lips is how do risk assets perform once the curve flattens and/or inverts. According to backtests from Goldman, since the mid-1980s, significant stock drawdowns (i.e. market crashes) began only when term slope started steepening after being inverted. ...
China Injects Gargantuan 1.1 Trillion In Liquidity This Week by Tyler Durden Wed, 01/16/2019 - 22:19 Following what Bloomberg calculated was a record net reverse repo liquidity injection on Wednesday, when the PBOC injected a whopping 560 billion yuan of liquidity into the financial system via open market operations, the Chinese central bank has done it again and in Thursday's open market operation, it sold 250BN yuan in 7 Day repos (slightly below yesterday's record 350BN), and 150BN in 28 Day repos, which net of maturities resulted in a whopping net 380BN yuan ($56.2BN) liquidity injection. ブルームバーグの算出によると水曜に記録的なリバースレポ流動性注入が行われた、PBOCがなんと公開市場操作で金融システムになんと560B人民元を注入した、中国中央銀行は再び木曜に公開市場操作を行った、250B人民元の7日決済レポを売却した(昨日の350B人民元よりも少し少ない)、そして28日決済のレポを150B人民元注入した、結果としてなんと380B人民元($56.2B)の流動性注入となる。 (訳注:なんか足し算すると辻褄が合いません、ブルーム...