With
the trade war between the US and China re-escalating once more,
investors are again casting frightened glances at declining global trade
volumes, which as Bloomberg writes today, "threaten to upend the global
economy’s much-anticipated rebound and could even throw its decade-long
expansion into doubt if the conflict spirals out of control."
"Just as tentative signs appeared that a recovery is taking hold,
trade tensions have re-emerged as a credible and significant threat to
the business cycle," said Morgan Stanley's chief economist, Chetan Ahya,
highlighting a “serious impact on corporate confidence" from the tariff
feud.
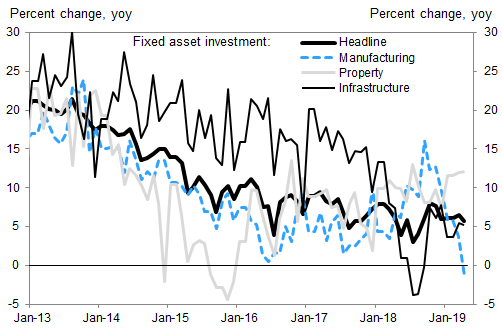
To be sure, even before the latest trade war round, global growth and trade were already suffering,
confirmed most recently by last night's dismal China economic data,
which showed industrial output, retail sales and investment all sliding
in April by more than economists forecast.
A similar deterioration was observed in the US, where retail sales
unexpectedly declined in April while factory production fell for the
third time in four months. Meanwhile, over in Europe even though
Germany’s economy emerged from stagnation to grow by 0.4% in the first
quarter, "the outlook remains fragile amid a manufacturing slump that
will be challenged anew by the trade war." As a result, investor
confidence in Europe’s largest economy unexpectedly weakened this month
for the first time since October.
Framing the threat, a study by Bloomberg Economics calculated that
about 1% of global economic activity is at stake in goods and services
traded between the US and China. Almost 4% of Chinese output is exported
to the U.S. and any hit to its manufacturers would reverberate through
regional supply chains with Taiwan and South Korea among those at risk.
U.S. shipments to China are more limited, though 5.1% of its
agricultural production heads there as does 3.3% of its manufactured
goods.
米国から中国への出荷がさらに制限されており、農業生産の5.1%、製造業の3.3%は中国向けだ。
The macro fears are once again trickling down to the micro level, and
last week chip giant Intel tumbled after it guided to a "more cautious
view of the year," and Italian drinks maker Davide Campari-Milano SpA
this month noted the “uncertain geopolitical and macro economic
environment.”
“The world economy has been in a significant slowdown for a period,’’
said James Bevan, chief investment officer at CCLA Investment
Management. “People just have to wake up and look at the trade data.’’
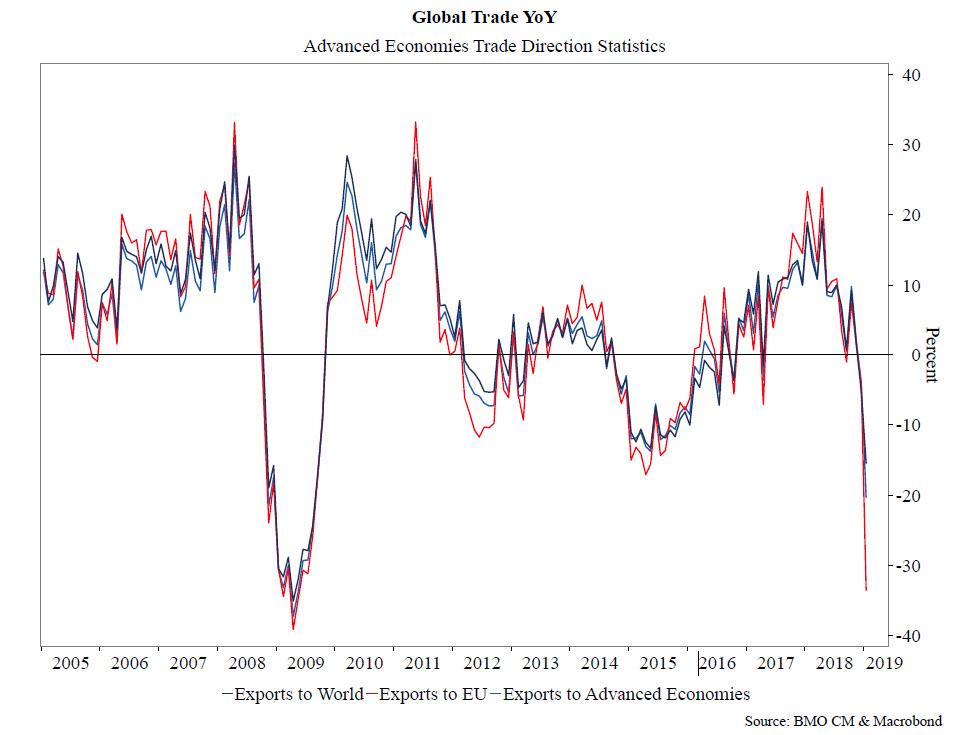
But the best way to visualize just how serious the threat to global
flow of trade, and the world economy in general, below is a chart on the
year-over-year changes in global trade as measured by the IMF's
Direction of Trade Statistics, courtesy of BMO's Ian Lyngern. It shows
the absolutely collapse in global exports as broken down into three
categories:
そこで世界貿易や世界経済がどれほど深刻であるかを目の当たりにする方法は、下のチャートのYoY世界貿易変化を見ることだ、IMFのDirection of Trade Sataisticsが発表したデータだ、BMOの Ian Lyngernが提供してくれた。これを見ると世界輸出が急落しており、その内訳を3分類している:
Exports to the world (weakest since 2009),
Exports to advances economies (also lowest since 2009), and
Exports to the European Union (challenging 2009 lows).
In short, even before the latest round of trade escalation,
global trade had tumbled to levels last seen during the financial crisis
depression. One can only wonder what happens to global trade after the
latest escalation in US-China trade war...
簡単に言うと、直近の貿易係争の高まり前に、すでに世界貿易は急落しており、前回の金融危機恐慌レベルにまで下落している。直近の米中貿易戦争の加熱を見ると世界貿易がどうなるかを誰でも心配するだろう・・・
Commenting on the chart above, Lyngen writs that "as estimates of the
fallout from the renewed Trade War begin to reflect the growing
apprehension in a variety of markets, we're struck by the extent of the
drop in exports."
On Wednesday, markets were clearly not struck by the drop in exports,
or any other negative news for that matter, with the Dow ripping,
reversing its entire morning drop, and trading over 100 points in the
green at last check.
How Are Gold And Money Supply Related? by Tyler Durden Sun, 06/14/2020 - 13:00 Authored by Mike Shedlock via MishTalk, M2 Money Supply is surging. Will gold follow? M2マネーサプライが急増している。ゴールドはこれを追従するだろうか? Let's investigate an alleged relationship between gold and M2, a measure of money supply in the US. よく言われるM2(米国のマネーサプライ指標)とゴールドの関係について調べてみよう。 "There’s a clear correlation between the annual growth rate in M2 money supply and the price of the yellow metal. " 「M2の年率増加速度とゴールド価格の間には明らかな相関がある。」 Clear Correlation? 明らかな相関? The Tweet claims something different than my lead chart depicts. So let's investigate the above idea in other time frames. このツイートの主張は私が示す最初のチャートが示すものとは異なる。というわけでこのtweetの主張を別の時間フレームで見てみよう。 Gold vs Rate of Change in M2 Money Supply ゴールド vs M2マネーサプライの変化率 If we look at longer time frames, the rate of increase in M2 theory falls flat on its face....
Is The Stock Market As Confused As You Are About A Recession? Written by Lance Roberts | Apr, 1, 2019 Last week, Barron’s ran an article entitled “The Stock Market Is Just As Confused About A Potential Recession As You Are?” To wit: 先週バロンズにこういう記事が掲載された「株式市場は景気後退を予感させるほどに混乱しているだろうか?」見てみよう: “Investors have long used where we are in the economic cycle to decide which stocks to buy and sell. New research from Nomura’s Joseph Mezrich flips that on its head by showing how investors can use stock performance to help determine where we are in the cycle. Too bad the market is sending mixed messages right now.” 長らく投資家は現在景気サイクルのどこに居るかを見てこの株式を売るか買うかを判断してきた。野村證券のJoseph Mezrichの最近の研究では、これが逆さで、投資家は株式のパフォーマンスを見て今景気サイクルのどこにいるかを判断している。最悪なことに現在相場は悪化改善混在のメッセージを送っている。」 But let’s be clear here; no one wants the party to end. So, despite a struggling stock market over the last year, slowing economic growth, and a collapsing yield curve, there are s...