Authored by Jesse Colombo via RealInvestmentAdvice.com, Market volatility has reared its ugly head once again in
recent weeks as the trade war with China took a turn for the worse and
global economic data continues to weaken. On Thursday, the Dow
lost 286.14 points, or 1.1%, the S&P 500 fell 34.03 points, or 1.2%,
and the Nasdaq Composite dropped 122.56 points, or 1.6%. From a
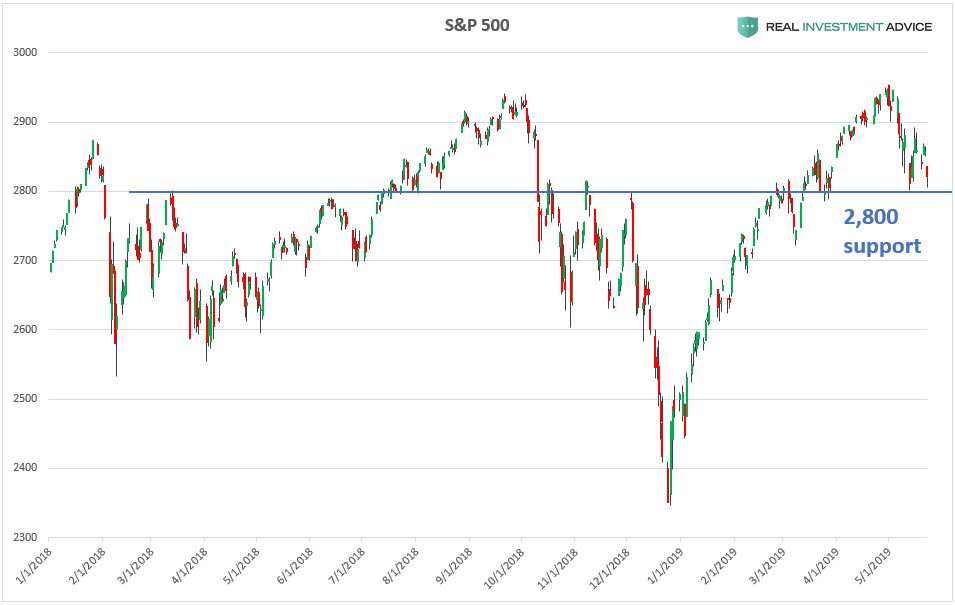
technical perspective, the S&P 500 is sitting just above a key
support level at 2,800. The S&P 500 has bumped its head or bounced
off of this levels quite a few times since early-2018. If the S&P
500 closes below 2,800 in a decisive manner, it would increase the
likelihood of further downside.
ここ数週で再び市場は醜い head パターンとなった、中国との貿易戦争が悪化しまた世界経済データが弱いからだ。火曜にDJIは1.1%相当の286.14ポイント下落し、S&P500は1.2%相当の34.03ポイント下落した、そしてNasdaq Compositeは1.6%相当の122.56ポイント下落だった。チャートテクニカルから見るとS&P500は2,800の重要なサポートレベルの少し上にいる。S&P500は2018年はじめ以来このレベルからの頭出しを何回か繰り返した。もしS&P500が終値で2,800を確実に下回るなら、さらなる下落が起きる可能性が高い。
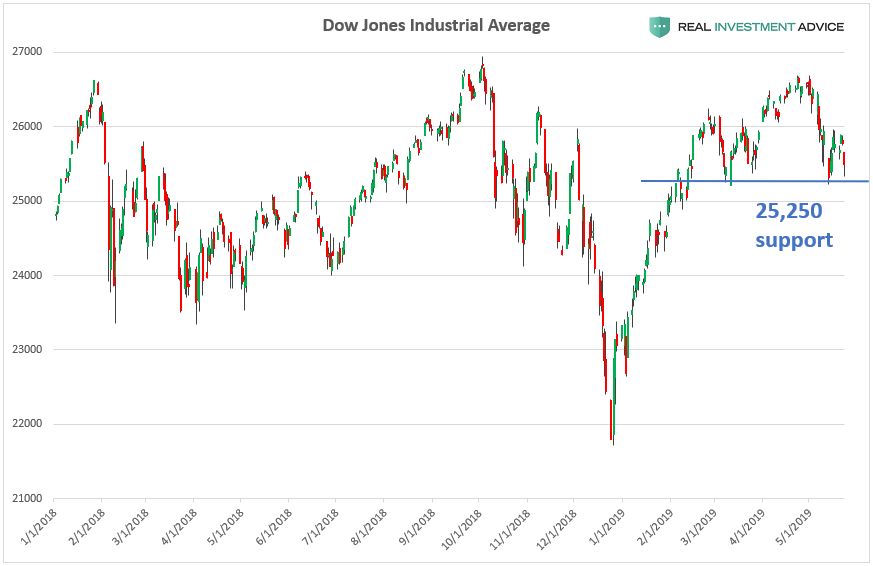
The Dow Jones Industrial Average is sitting just above its 25,250
support level that it has bounced off of in recent months. If the Dow
closes below this level in a convincing manner, it may foreshadow even
more downside action.
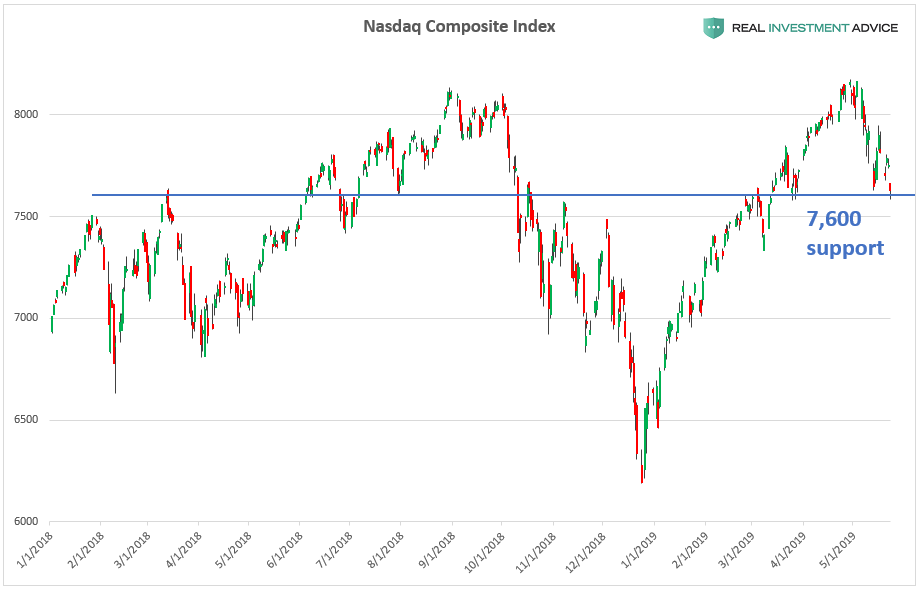
The tech-oriented Nasdaq Composite Index is just above its 7,600
support level that has come into play several times in the past year. If
the Nasdaq closes convincingly below 7,600, further bearish action is
likely.
テック銘柄の多いNasdaq Composite Indexは7,600のサポートの少し上だ、ここ数年で何度かこのレベルになった。もしNasdaq が終値で確実に7,600を下回るならさらなるベア傾向となるだろう。
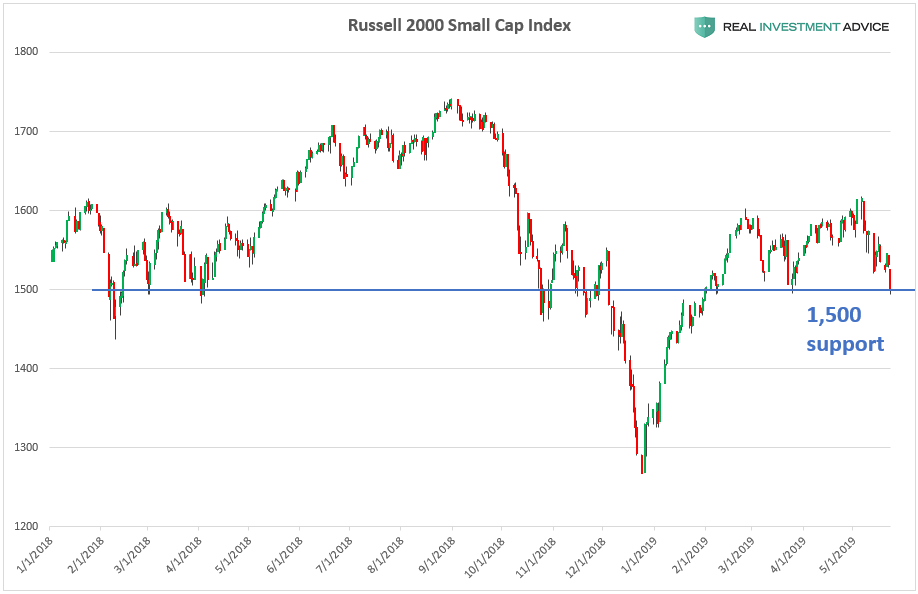
The Russell 2000 Small Cap Index closed just above its 1,500 support
level. If it closes below this level, further weakness is likely.
Russell 2000小型株指数は1,500のサポートの少し上だ。もし終値でこのレベルを下回るなら、さらなる下落となるだろう。
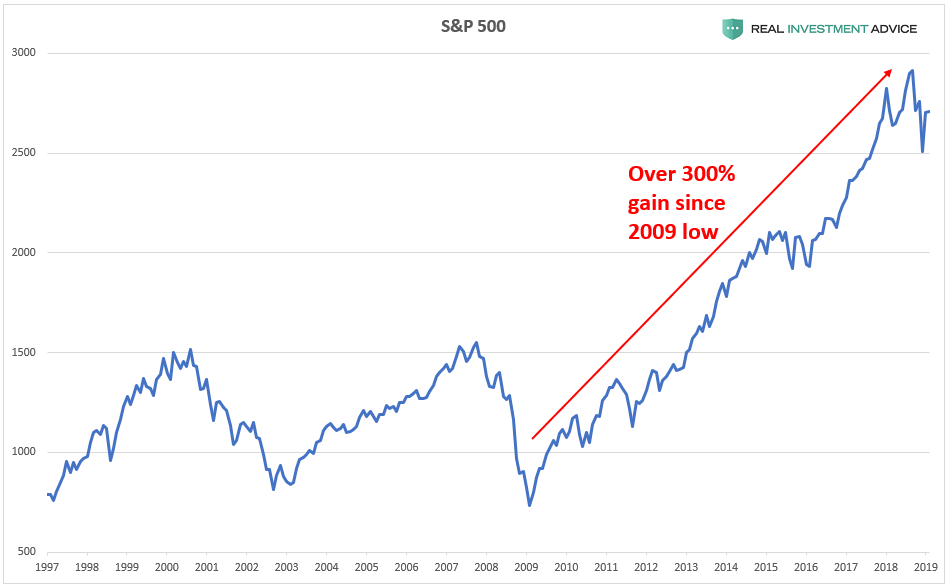
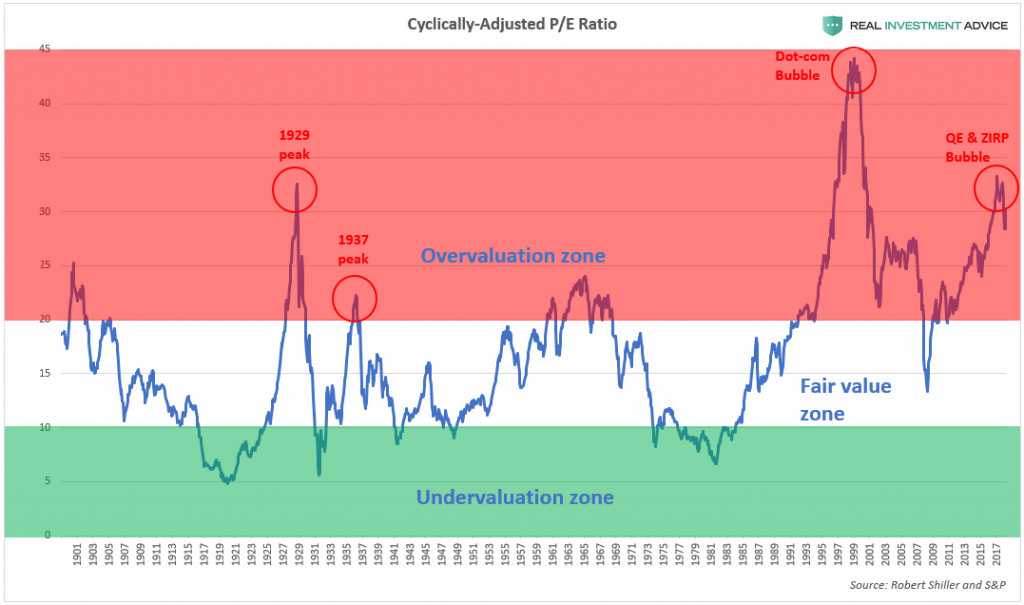
After the U.S. stock market’s 300% gain in the past decade (which is an unsustainable bubble), it is prudent to be aware of the risk of a sharp unwind:
The S&P 500 rose much faster than earnings and is now at
1929-like valuations, which means that a painful correction is
inevitable:
S&P500は収益以上に急速に上昇してきた、今や1929年ほどのバリエーションだ、ということは痛みの伴う調整が不可避だ:
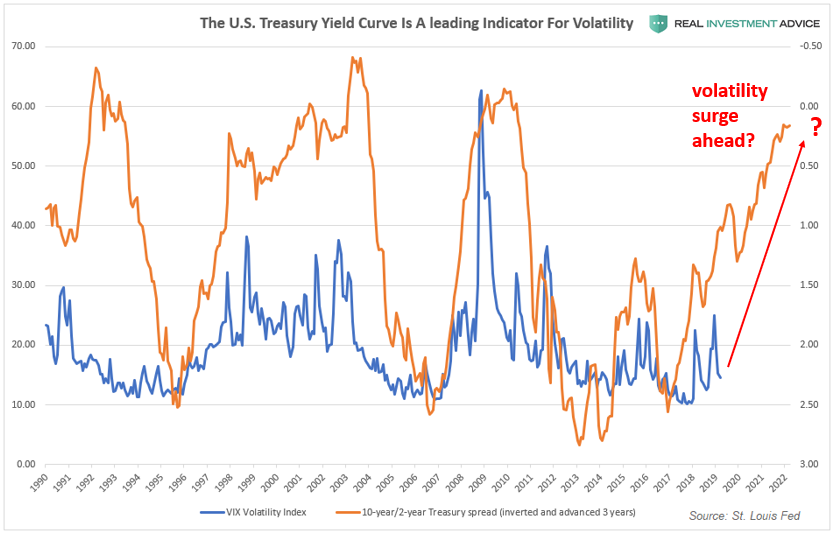
Another indicator that supports the “higher volatility ahead” thesis
is the 10-year/2-year Treasury spread. When this spread is inverted, it
leads the Volatility Index by approximately three years. If this
historic relationship is still valid, we should prepare for much higher
volatility over the next few years. A volatility surge of the magnitude
suggested by the 10-year/2-year Treasury spread would likely be the
result of a recession and a bursting of the massive asset bubble created
by the Fed in the past decade.
For now, I am watching how the major indices act at their key support
levels. If the indices break their supports at the same time that the
trade war worsens even further, we could see another sharp sell-off like
the one in late-2018.
Is The Stock Market As Confused As You Are About A Recession? Written by Lance Roberts | Apr, 1, 2019 Last week, Barron’s ran an article entitled “The Stock Market Is Just As Confused About A Potential Recession As You Are?” To wit: 先週バロンズにこういう記事が掲載された「株式市場は景気後退を予感させるほどに混乱しているだろうか?」見てみよう: “Investors have long used where we are in the economic cycle to decide which stocks to buy and sell. New research from Nomura’s Joseph Mezrich flips that on its head by showing how investors can use stock performance to help determine where we are in the cycle. Too bad the market is sending mixed messages right now.” 長らく投資家は現在景気サイクルのどこに居るかを見てこの株式を売るか買うかを判断してきた。野村證券のJoseph Mezrichの最近の研究では、これが逆さで、投資家は株式のパフォーマンスを見て今景気サイクルのどこにいるかを判断している。最悪なことに現在相場は悪化改善混在のメッセージを送っている。」 But let’s be clear here; no one wants the party to end. So, despite a struggling stock market over the last year, slowing economic growth, and a collapsing yield curve, there are s...
How Are Gold And Money Supply Related? by Tyler Durden Sun, 06/14/2020 - 13:00 Authored by Mike Shedlock via MishTalk, M2 Money Supply is surging. Will gold follow? M2マネーサプライが急増している。ゴールドはこれを追従するだろうか? Let's investigate an alleged relationship between gold and M2, a measure of money supply in the US. よく言われるM2(米国のマネーサプライ指標)とゴールドの関係について調べてみよう。 "There’s a clear correlation between the annual growth rate in M2 money supply and the price of the yellow metal. " 「M2の年率増加速度とゴールド価格の間には明らかな相関がある。」 Clear Correlation? 明らかな相関? The Tweet claims something different than my lead chart depicts. So let's investigate the above idea in other time frames. このツイートの主張は私が示す最初のチャートが示すものとは異なる。というわけでこのtweetの主張を別の時間フレームで見てみよう。 Gold vs Rate of Change in M2 Money Supply ゴールド vs M2マネーサプライの変化率 If we look at longer time frames, the rate of increase in M2 theory falls flat on its face....
China Injects Gargantuan 1.1 Trillion In Liquidity This Week by Tyler Durden Wed, 01/16/2019 - 22:19 Following what Bloomberg calculated was a record net reverse repo liquidity injection on Wednesday, when the PBOC injected a whopping 560 billion yuan of liquidity into the financial system via open market operations, the Chinese central bank has done it again and in Thursday's open market operation, it sold 250BN yuan in 7 Day repos (slightly below yesterday's record 350BN), and 150BN in 28 Day repos, which net of maturities resulted in a whopping net 380BN yuan ($56.2BN) liquidity injection. ブルームバーグの算出によると水曜に記録的なリバースレポ流動性注入が行われた、PBOCがなんと公開市場操作で金融システムになんと560B人民元を注入した、中国中央銀行は再び木曜に公開市場操作を行った、250B人民元の7日決済レポを売却した(昨日の350B人民元よりも少し少ない)、そして28日決済のレポを150B人民元注入した、結果としてなんと380B人民元($56.2B)の流動性注入となる。 (訳注:なんか足し算すると辻褄が合いません、ブルーム...