Authored by Jesse Colombo via RealInvestmentAdvice.com,
Last week, I wrote a detailed piece in which I explained that U.S. recession risk was rising quite rapidly and that the
coming recession is likely to be far more severe than most economists
expect because there are so many dangerous new bubbles inflating
currently and because the global debt burden is much worse today than it
was before the Great Recession. In the current piece, I will
show more warning signs of the coming recession as well as discuss
reliable recession indicators to keep an eye on as we get closer to the
recession.
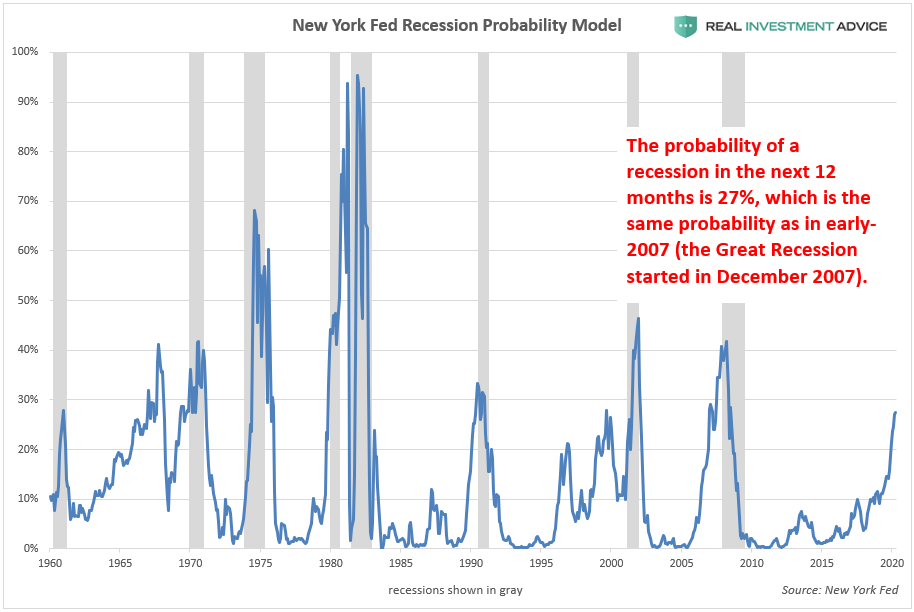
The first chart is of the New York Fed’s
recession probability model, which is warning that there is a 27%
probability of a U.S. recession in the next 12 months. The last time
that recession odds were the same as they are now was in early-2007,
which was shortly before the Great Recession officially started in
December 2007. This recession indicator has underestimated the
probability of recessions in the past several decades (it never rose
higher that 42% in 2008, when we were already in a recession), so the
probability of a U.S. recession in the next 12 months is likely even higher than 27%.
まず最初はNew York FEDの景気後退確率モデルだ、ここでは今後12か月で米国景気後退入りの確率は27%と警告している。この景気後退入り確率が現在と同様だったのは2007年始めのことだ、あの金融危機が公式に認定される2007年12月の少し前のことだ。過去何十年かを振り返るとこの景気後退入り確率は過小評価している(2008年でも42%を超えることはなかった、すでに景気後退入りしているにもかかわらずだ)、というわけで今後12か月以内に米国が景気後退入りする確率は27%よりももっと高い。
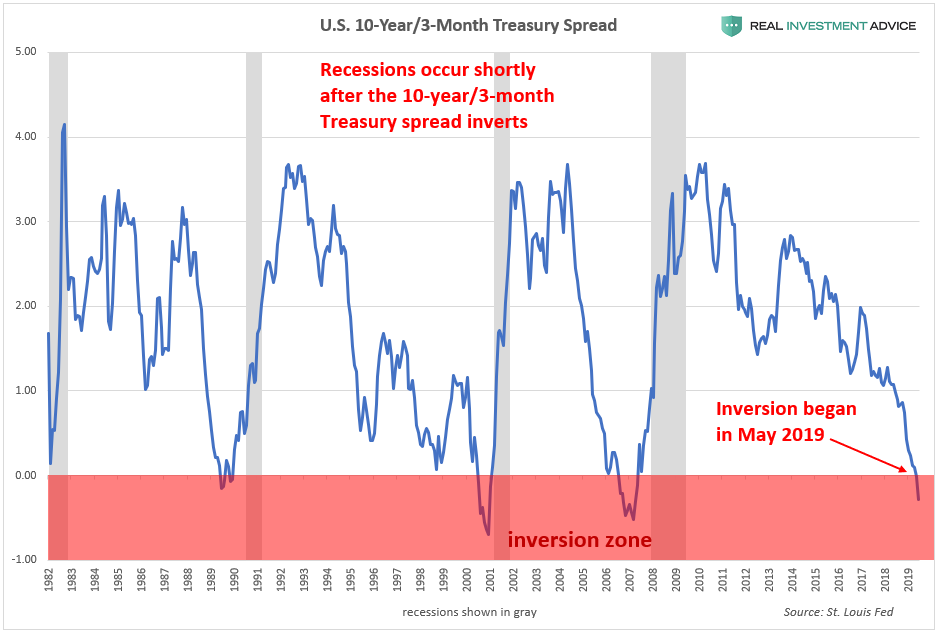
The New York Fed’s recession probability model is based on the
10-year and 3-month Treasury yield spread, which is the difference
between 10-year and 3-month Treasury rates. In normal economic
environments, the 10-year Treasury yield is higher than the 3-month
Treasury yield. Right before a recession, however, this spread inverts
as the 3-month Treasury yield actually becomes higher than the 10-year
Treasury rate – this is known as an inverted yield curve. As
the chart below shows, inverted yield curves have preceded all modern
recessions. The 10-year and 3-month Treasury spread inverted in May,
which started the recession countdown clock.
New York FEDの景気後退確率モデルは10Y3Mイールドカーブスプレッドに基づいている。通常の経済環境ならば、10年債の金利は3ヶ月もの金利よりも高い。しかしながら景気後退直前になると、このスプレッドが反転し3ヶ月物の金利のほうが10年物よりも高くなるーーこれはイールドカーブ反転として知られる。下のチャートでも分かるが近年のすべての景気後退前にイールドカーブが反転している。この5月に10Y3Mイールドカーブが反転した、ということは景気後退へのカウントダウンが始まったということだ。
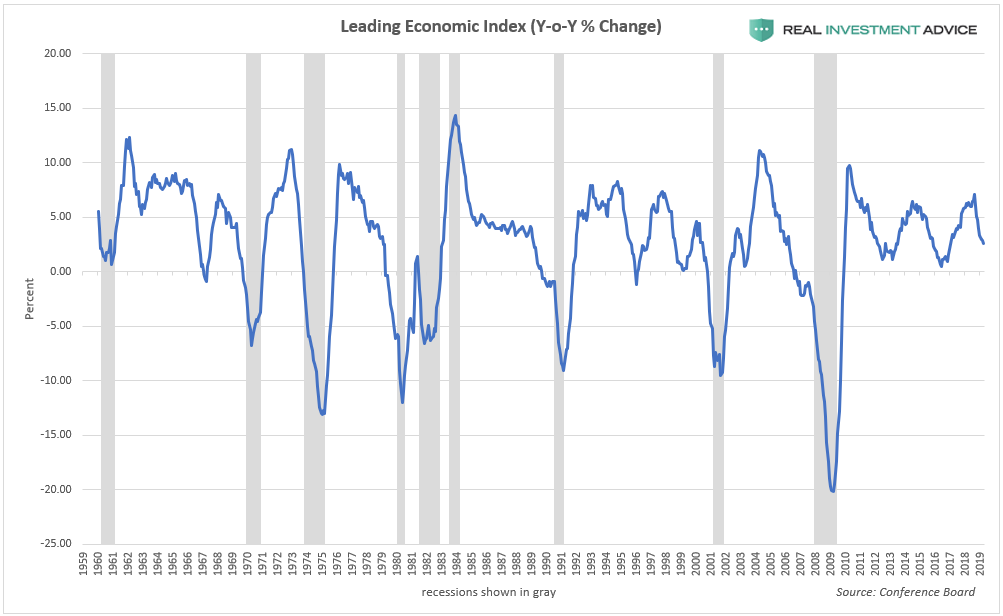
The Leading Economic Index (LEI), which is comprised of
economic indicators that lead the overall economy, has been slowing
down quite rapidly in recent months. When the year-over-year growth rate
of this index drops into negative territory, recessions typically occur
shortly after. While the current LEI slowdown hasn’t dipped into
negative territory yet, anyone who is interested in monitoring the risk
of a recession should keep an eye out for that scenario.
Leading Economic Index(LEI 経済先行指標)、景気全体を先行する各種経済指標から産出される指標、これがここ数か月急激に下落している。この指標がYoYでマイナス領域になると、すぐその後に景気後退を引き起こす。現在のLEIはまだマイナス領域までなっていないが、景気後退リスクに興味のある人はこの指数に注目すべきだ。
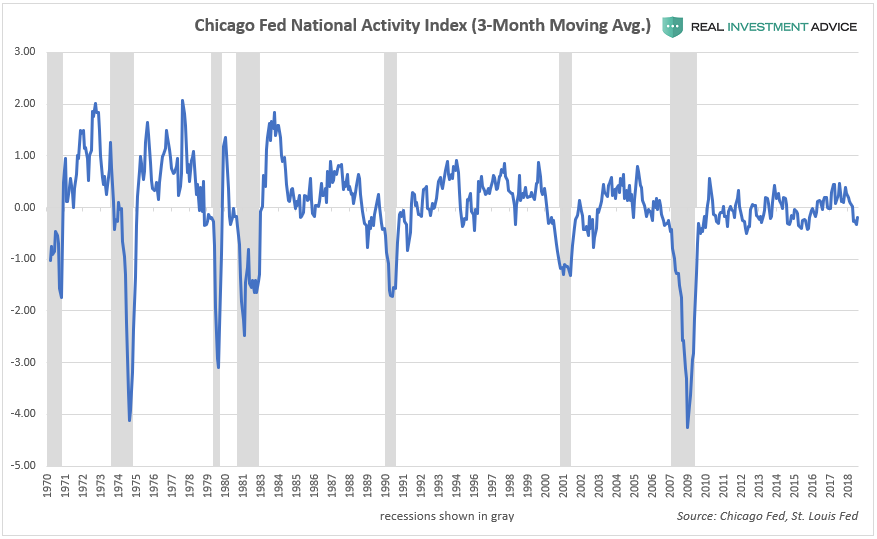
The Chicago Fed National Activity Index (CFNAI), which is comprised of 85 indicators of
national economic activity, has been contracting in recent months.
Sharp contractions of the CFNAI’s 3-month moving average typically
signal imminent recessions. The CFNAI’s contraction isn’t quite at
recessionary levels just yet, but if it drops it -0.5 or even lower,
that will provide further confirmation that a recession is imminent.
Chicago FED National Activity Index(CFNAI)、この指数は米国経済活動を示す85の指数から算出される、これもここ数か月収斂している。このCFNAIの3か月移動平均が急落すると景気後退が迫っている。今の所CFNAI下落を見る限りまだ景気後退が差し迫ってはいない、しかしこれが−0.5下落すると、景気後退が差し迫ることになる。
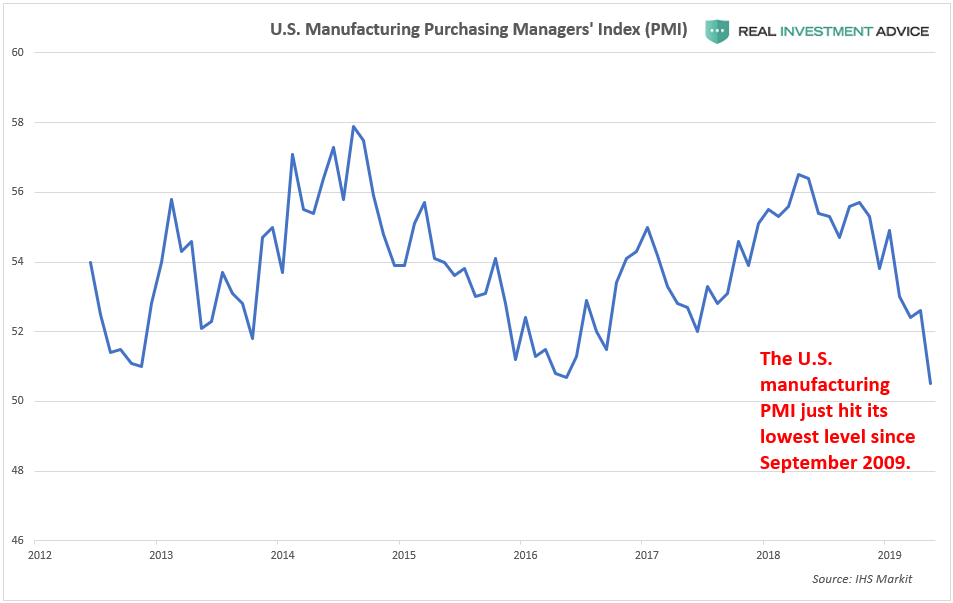
In May, the U.S. Manufacturing Purchasing Managers’ Index fell to its lowest level since September 2009:
5月には、米国製造業PMIが2009年以来の最低値になった:
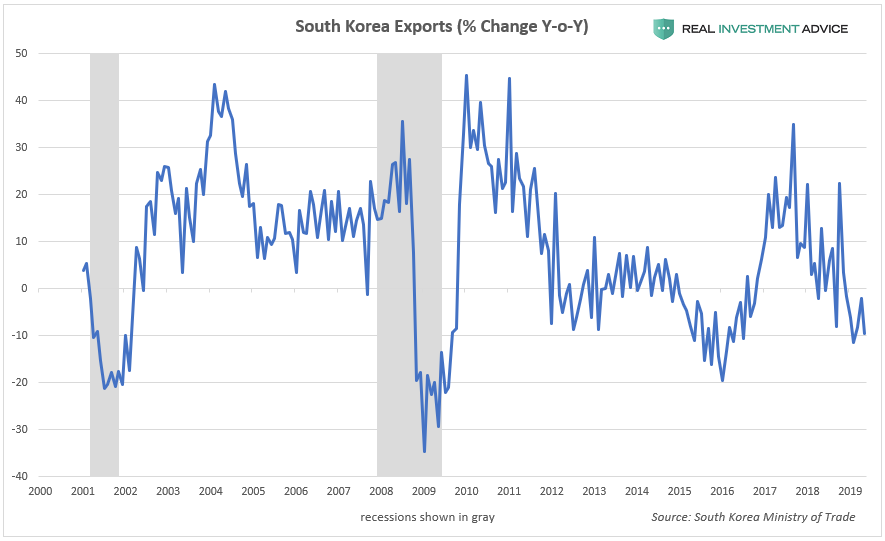
South Korean exports, which are seen as a barometer for the health of the global economy, have been falling in recent months:
韓国の輸出、これは世界経済の健全性を示すバロメータとみなされている、これがここ数か月下落している:
It’s not surprising that South Korea’s exports are falling as global trade plummets:
世界貿易量が下落する中で韓国輸出が下落するからと言って驚くことではない:
Major appliance shipments collapsed 17% in April, which is a recession warning sign:
主要な機器出荷が4月に17%下落した、これは景気後退への警告サインだ:
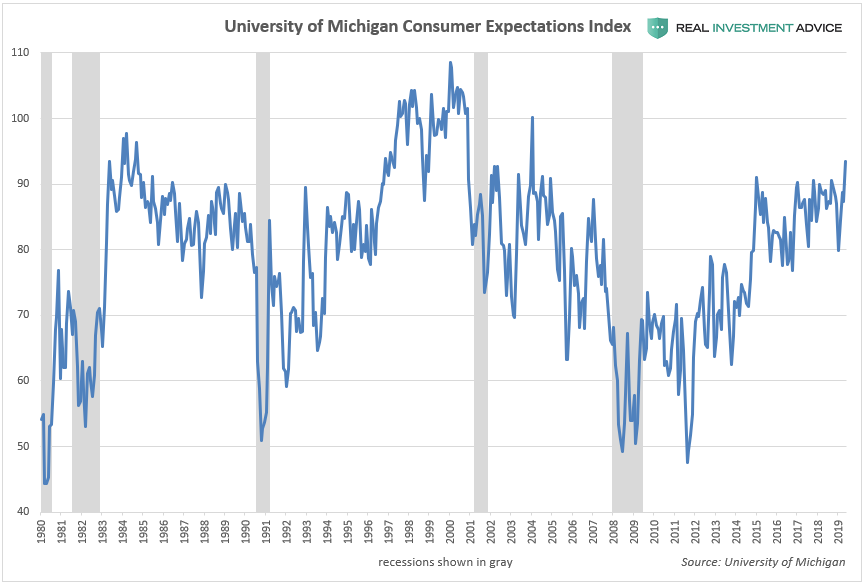
One popular indicator that is used to monitor recession risk, the University of Michigan Consumer Expectations Index,
shows no sign of an imminent recession – quite the opposite, actually.
Just beware when it starts to drop very sharply like it did before the
last several recessions.
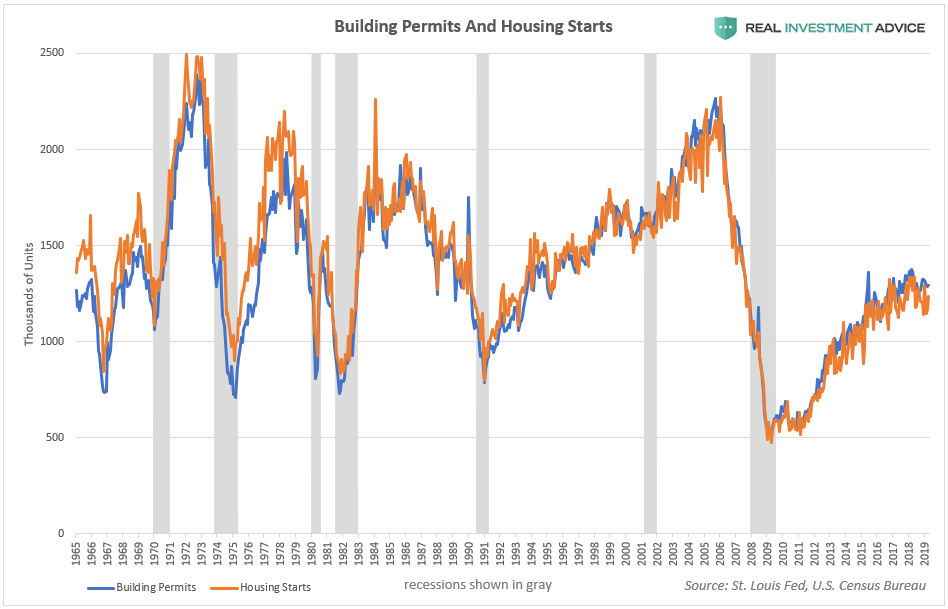
U.S. building permits and housing starts are
popular economic indicators that are used to monitor recession risk.
Right now, they are not warning of an imminent recession, thankfully.
But if building permits and housing starts weaken significantly in the
near future, it will provide further confirmation that a recession is
near.
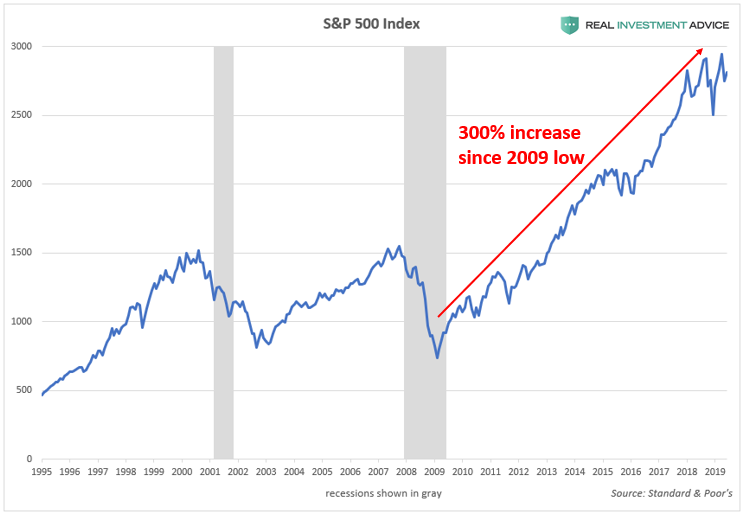
One of the most basic recession indicators is the stock market itself.
When the stock market experiences a bear market (a decline of 20% or
more), that is typically a sign that the economy is rolling over into a
recession. For now, the stock market is not warning of a recession, but
beware that it can unravel very quickly due to how inflated it currently is.
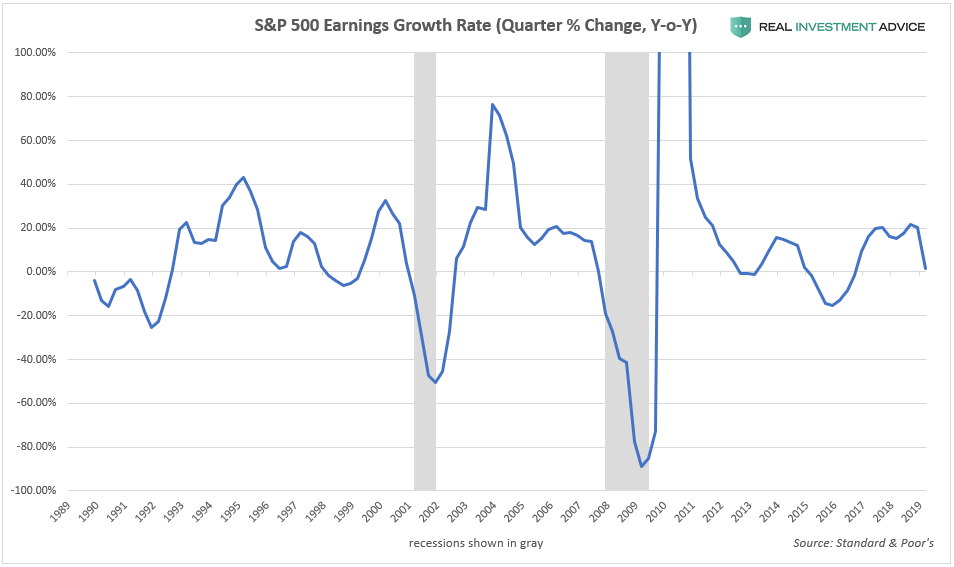
Corporate earnings growth is another valuable recession indicator to
watch. Corporate earnings growth drops significantly and turns negative
when the economy rolls over into a recession. After growing at a nearly
20% annualized rate in 2017 and 2018, Q1 2019 earnings growth hit a wall,
growing only 1.5%. If corporate earnings start to contract in the next
few quarters, that would confirm that a recession is near.
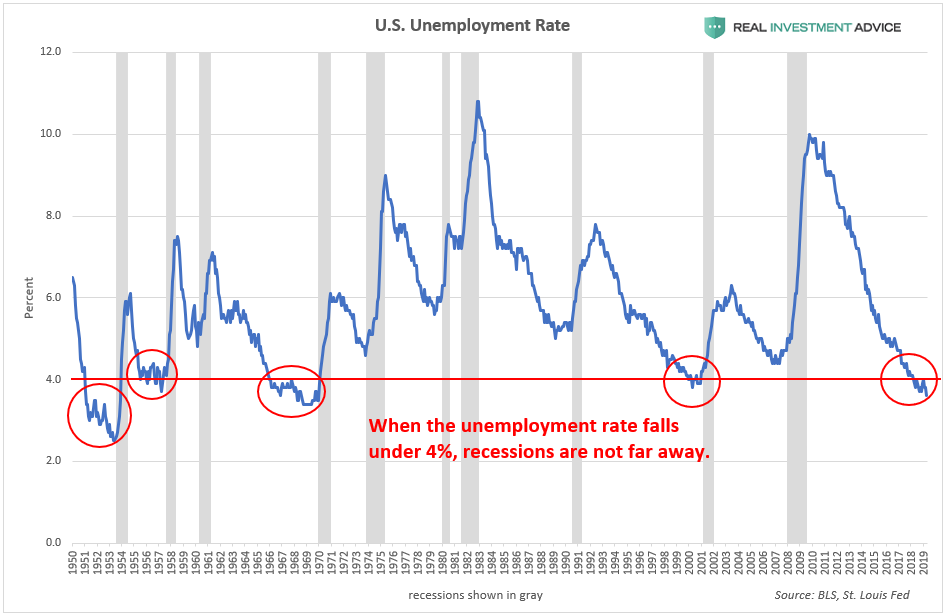
As I have explained in
the past, sub-4% unemployment is a sign that the economic cycle is
quite mature and that a recession is not far off. The U.S. unemployment
rate has been under 4% since early-2018. When the unemployment rate
abruptly increases from such low levels, that is a tell-tale sign that a
recession has started.
以前に私が解説したが、失業率が4%を下回ると、これは景気サイクルがもう満を持しており景気後退が遠くないことを示している。米国の失業率は2018年始め以来4%以下だ。この低レベルから失業率が急に増えると、すでに景気後退が始まったサインだ。
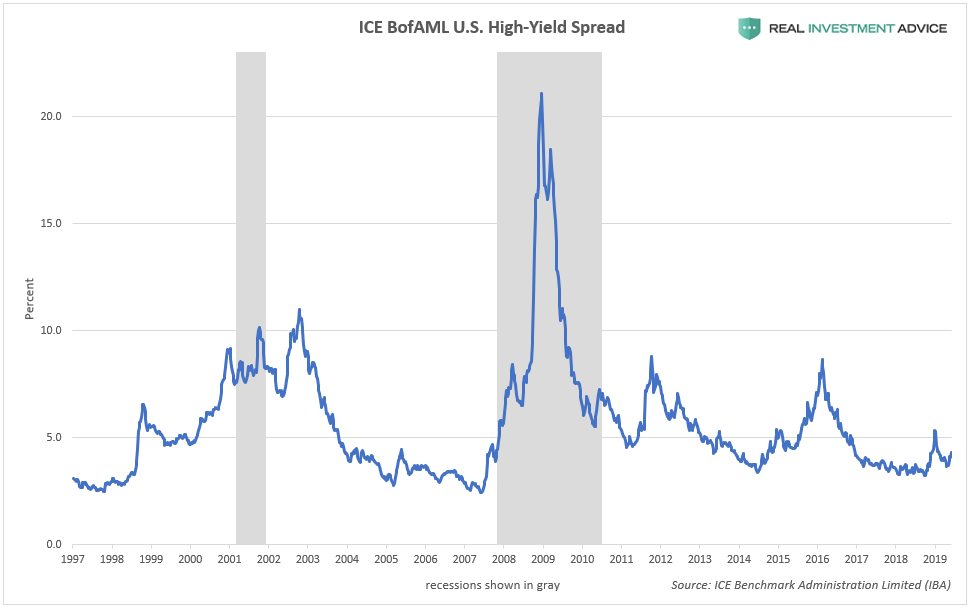
Though technically not a recession indicator, it is worth paying attention to the high-yield bond spread as
a measure of how much stress there is in the credit market. The spread
tends to increase leading up to and during recessions as investors
jettison riskier high-yield bonds in favor of less risky Treasury bonds.
Credit market stress is still low at the moment, but can change on a
dime.
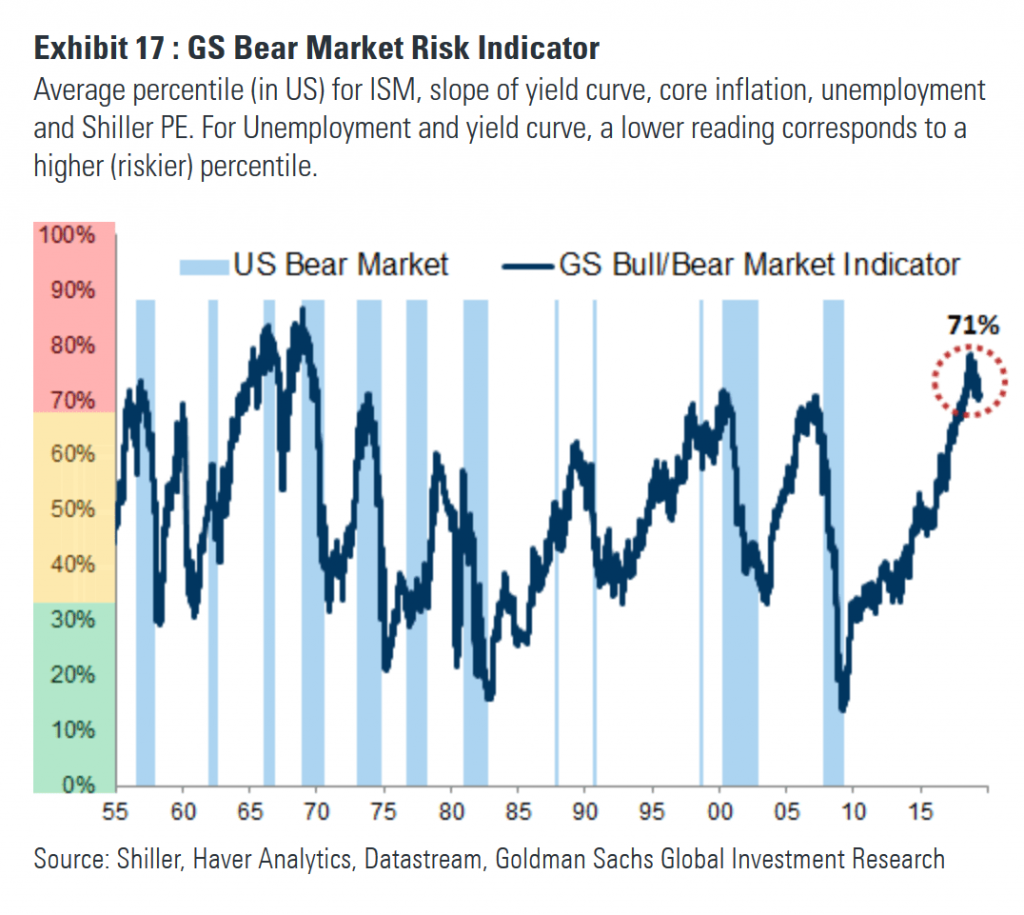
In the past year or so, Goldman Sachs’ Bear Market Risk Indicator has been has been at its highest level since the early-1970s:
昨年すでに、ゴールドマン・サックスのベア相場リスク指数は1970年以降で最大のレベルになっている:
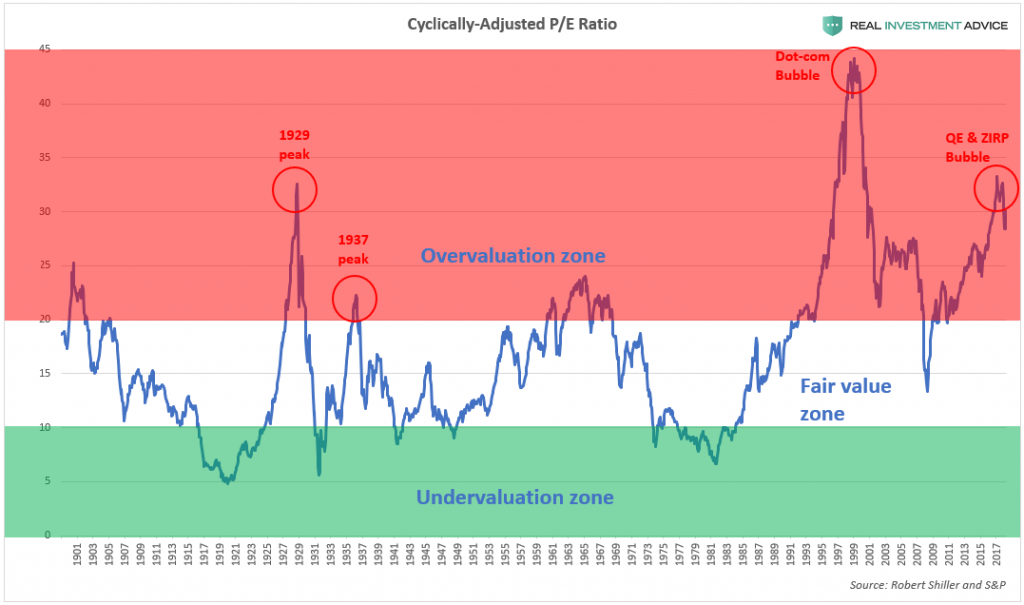
The high probability of a recession and bear market in the next year
or so is very concerning because of how inflated the U.S. stock market
currently is. The Fed’s aggressive inflation of the U.S. stock market in
the past decade caused stocks to rise at a faster rate than their
underlying earnings, which means that the market is extremely overvalued
right now. Whenever the market becomes extremely overvalued, it’s just a
matter of time before the market falls to a more reasonable valuation
again. As the chart below shows, the U.S. stock market is nearly as
overvalued as it was in 1929, right before the stock market crash that
led to the Great Depression.
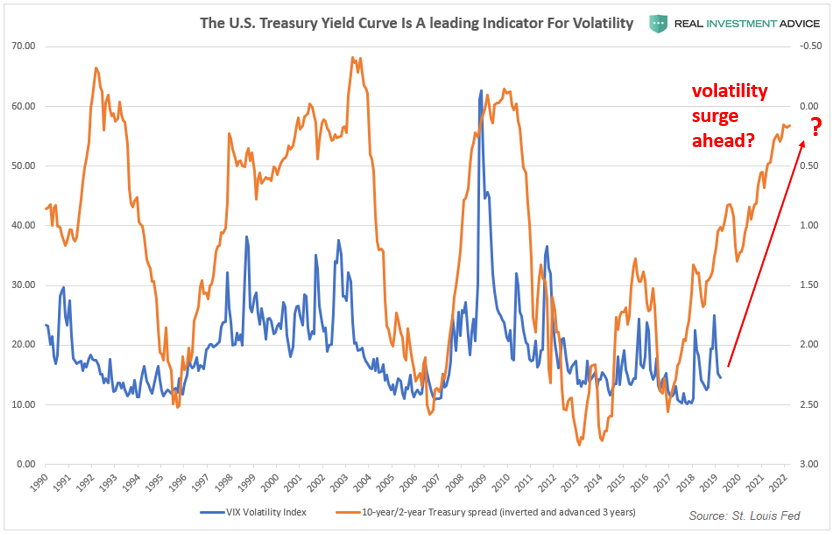
Another indicator that supports the “higher volatility ahead” thesis
is the 10-year/2-year Treasury spread. When this spread is inverted, it
leads the Volatility Index by approximately three years. If this
historic relationship is still valid, we should prepare for much higher
volatility over the next few years. A volatility surge of the magnitude
suggested by the 10-year/2-year Treasury spread would likely be the
result of a recession and a bursting of the massive asset bubble created
by the Fed in the past decade.
Amazonで買物をしてContrarianJを応援しよう Albert Edwards: This Was The Final Recessionary Shoe, And It Has Now Fallen by Tyler Durden Thu, 06/27/2019 - 12:45 Exactly three months ago, in late March, the 3 month-10 year spread inverted for the first time since 2007... ちょうど3か月前の3月遅くのことだ、3M10Yスプレッドが2007年以来初めて反転した・・・・ ... an event which sparked near-panic in the market as historically curve inversion has preceded the last 7 recessions. ・・・市場は準混乱状態になった、というのも歴史的に見てイールドカーブ反転が過去7回の景気後退の前兆となっているからだ。 However, while the inversion was certainly a memorable event, the question on everyone's lips is how do risk assets perform once the curve flattens and/or inverts. According to backtests from Goldman, since the mid-1980s, significant stock drawdowns (i.e. market crashes) began only when term slope started steepening after being inverted. ...
Powell Keeps The Bond Bull Kicking Written by Lance Roberts | Mar, 21, 2019 In a widely expected outcome, the Federal Reserve announced no change to the Fed funds rate but did leave open the possibility of a rate hike next year. Also, they committed to stopping “Quantitative Tightening (or Q.T.)” by the end of September. 多くの人が予想したとおり、FEDはFFR変更をしないだけでなく来年も不明とした。さらには、QTを9月末に終えると約束した。 The key language from yesterday’s announcement was: 昨日の発表の重要な部分はこういう具合だ: “ Information received since the Federal Open Market Committee met in January indicates that the labor market remains strong but that growth of economic activity has slowed from its solid rate in the fourth quarter . Payroll employment was little changed in February, but job gains have been solid, on average, in recent months, and the unemployment rate has remained low. 「1月のFOMC以来の情報を分析すると、労働市場は強いがQ4に比べると経済成長は鈍化している。2月の雇用環境にほとんど変化がなかった、ここ数ヶ月確実に雇用は増えている、そして失業率は低いままだ。 Recent indicators point to s...
Amazonで買物をしてContrarianJを応援しよう "On The Precipice" by Tyler Durden Mon, 06/24/2019 - 14:30 Authored by Kevin Ludolph via Crescat Capital, Dear Investors: The US stock market is retesting its all-time highs at record valuations yet again. We strongly believe it is poised to fail. The problem for bullish late-cycle momentum investors trying to play a breakout to new highs here is the oncoming freight train of deteriorating macro-economic conditions. 米国株式は記録的バリエーションのもとで再度過去最高を試している。私どもはこれが失敗すると強く信じている。景気拡大終盤で強気のモメンタム投資家が新高値を試そうとしていることの問題は、マクロ経済条件の悪化にある。 US corporate profit growth, year-over-year, for the S&P 500 already fully evaporated in the first quarter of 2019 and is heading toward outright decline for the full year based on earnings estimate revision trends. Note the alligator jaws divergence in the chart be...