Commercial and industrial (C&I) loan activity is watched
closely by economists to gauge the strength of the economy and estimate
where we are in the business cycle. C&I loans are used to
finance capital expenditures or increase the borrower’s working capital.
The C&I loan cycle often takes up to a couple of years to turn
positive after a recession, but provides even more confirmation that an
economic expansion is underway. For example, the U.S. Great Recession
officially ended in June 2009, but the C&I loan cycle didn’t turn
positive until late-2010. C&I loans also help to warn when the economic cycle is approaching its end (as they are now).
C&I ローン(企業の設備投資や運転資金に利用するローン)動向がエコノミストに注視されている、経済の強さや景気サイクルで今どこにいるかを判断するためにだ。C&Iローンは設備投資や運転資金に用いられる。景気後退後にC&Iローンが上昇するのは2年ほどの遅れがある、しかしこういう状況のときには経済拡大が起きていることが確実だ。たとえば、米国のGreat Recessionは2009年6月に終わったが、C&Iローンが増えるのは2010年遅くだった。C&Iローンはまた景気拡大終焉の警告ともなる(まさにいまがそうだ)。
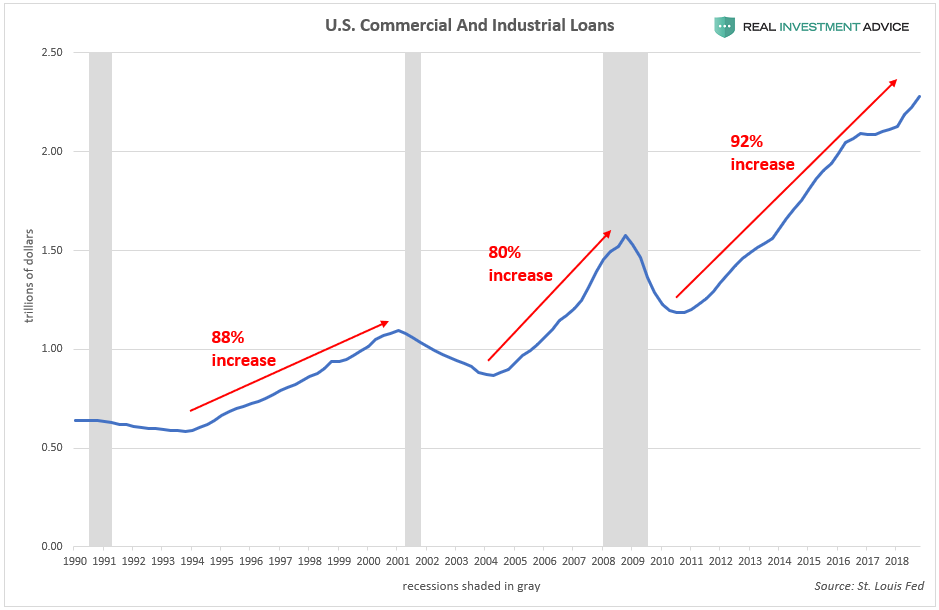
Total outstanding U.S. commercial and industrial loans have increased
by 92% in the current cycle, which surpasses the 80% increase during
the mid-2000s cycle and the 88% increase during the late-1990s cycle:
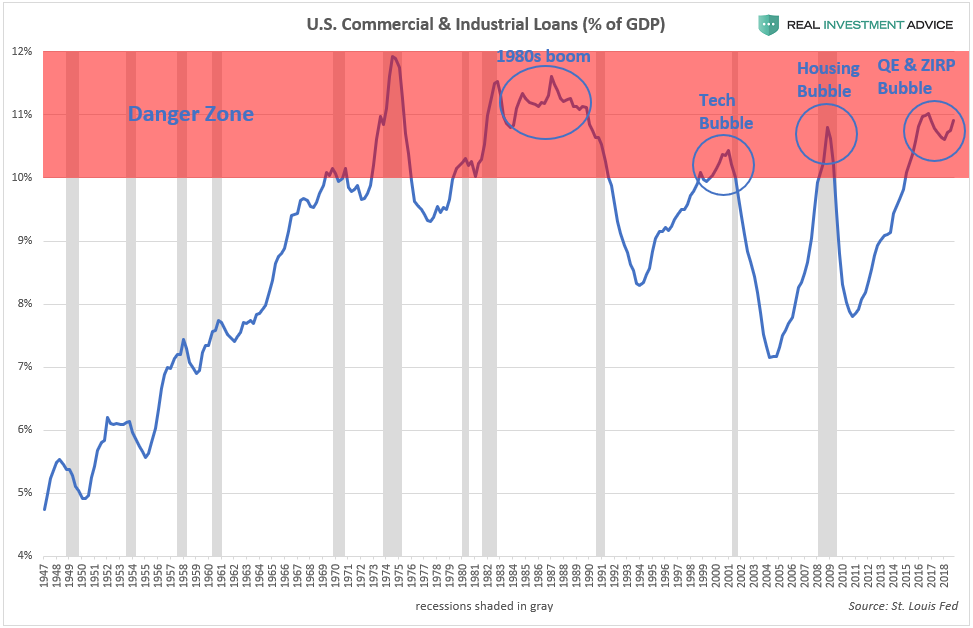
One way of determining when the C&I loan cycle (and,
therefore, the overall economic cycle) is nearing its end is by charting
total outstanding commercial and industrial loans as a percentage of
GDP. When C&I loans are at 10% of GDP or higher (the
“Danger Zone”), that is typically a sign that the cycle is long in the
tooth and about to tip over into a recession. According to the chart
below, recessions occurred shortly after C&I loans peaked within the “Danger Zone.” C&I
loans are currently in that zone, which I see as further confirmation
that we are in a Fed-driven economic bubble that will end badly.
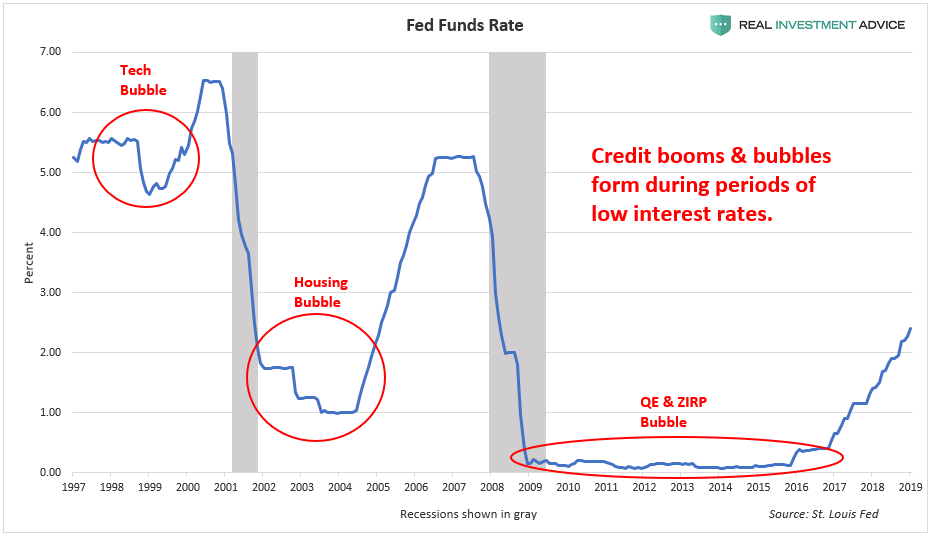
The current C&I loan cycle has been more powerful and
longer-lasting than the prior two cycles because the Fed has held
interest rates at record low levels for a record length of time. As the
chart below shows, credit booms and bubbles form during low interest
rate periods (low interest rates encourage borrowing):
現在のC&Iローンサイクルは過去二回のものよりも力強く長期に渡るものだった、というのも、FEDが金利を記録的低位にかつ記録的長期に渡り維持したためだ。下のチャートに示すが、与信ブームとバブルが見て取れる、低金利が借金しやすくするためだ:
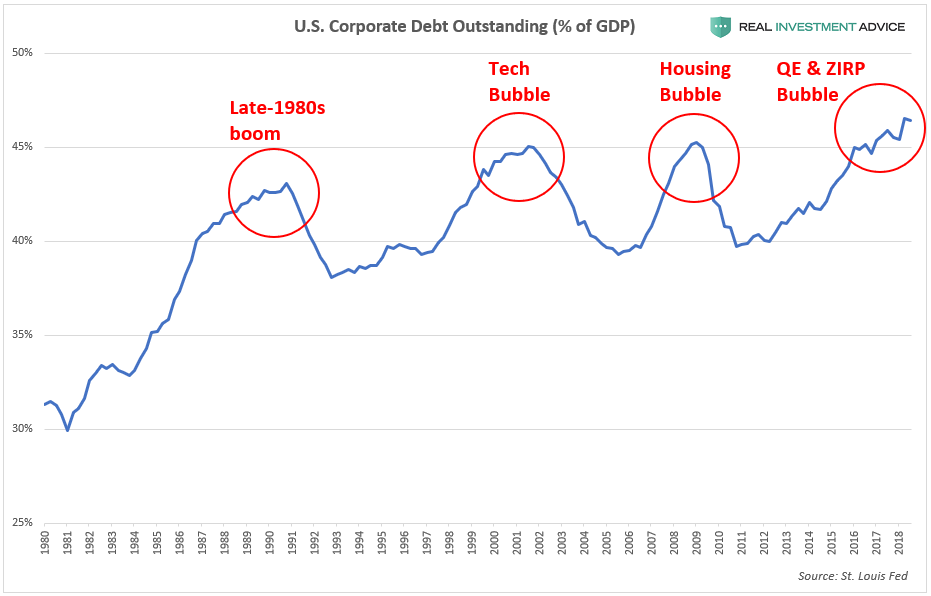
The U.S. corporate debt market (which is mostly in the form of bonds
instead loans) is telling a similar message as commercial and industrial
loans, as I recently discussed.
To summarize, ultra-low bond yields over the past decade have
encouraged a corporate borrowing bubble that has also been funding the
stock buyback boom. As a result, total outstanding U.S.
corporate debt has increased by $3 trillion or 45% since the last peak
in 2008. U.S. corporate debt is now at an all-time high of over 46% of
GDP, which is even worse than the levels reached during the dot-com bubble and mid-2000s housing bubble.
I am fully aware that both C&I loans and corporate debt
may reach a higher percentage of GDP in this cycle due to how low
interest rates are. Still, it is important to be aware of the risks that
are building up and not be complacent. When the Fed and other
central banks hold interest rates at low levels, they create market
distortions and encourage malinvestment or unwise lending decisions that
would not otherwise occur in a normal interest rate environment. These
malinvestments are revealed once interest rates are raised and the
economic cycle turns (read my piece about this in Forbes). A
tremendous amount of malinvestment has accumulated after a decade of
artificially low interest rates, which is going to result in serious
pain when the cycle inevitably turns – make no mistake about that. 今回の景気サイクルでC&Iローンも企業債務もともに対GDPでみると最悪なのは低金利のためだと私は分かっている。FEDや世界中の中央銀行が低金利政策をとったために、市場をゆがめmalinvestmentを増やし、通常の金利なら起こりえない馬鹿げた貸出判断をしてしまった。今後金利が上昇し景気サイクルが変わると、これらのmalinvestmentsが明らかになる(私のForbsの記事を読むが良い)。人工的に低金利を10年も続けたため意にとんでもない数のmalinvestmentが積み上がっている、景気サイクルが変わると深刻な痛みを伴うだろうーー決してこの件で投資判断を間違ってはいけない。
Class 8 Heavy Truck Orders Crash 68% in January by Tyler Durden Wed, 02/06/2019 - 17:25 Among the latest dismal news about the strength of the US economy, on Tuesday ACT Research released preliminary truck orders for January 2019 which showed that Class 8 truck orders collapsed an astounding 68% for January. The decline is being attributed to a 300,000+ vehicle backlog potentially prompting fleets to halt purchases in the near term. 米国経済に関し最近憂鬱なニュースが多い中で、火曜にACT researchが2019年1月のトラック発注を開示した、1月にClass 8のトラック発注がなんと68%も急落した。この発注減は短期的に300,000台超の潜在在庫を生み出す。 Specifically, in January Class 8 net orders were 15,800 units (14,700 SA; 176,400 SAAR), down 68% YoY and down 26% MoM. Class 5- 7 January net orders were 23,400...
Amazonで買物をしてContrarianJを応援しよう Silver Outperforming Gold 2 Adam Hamilton July 26, 2019 3232 Words Silver has blasted higher in the last couple weeks, far outperforming gold. This is certainly noteworthy, as silver has stunk up the precious-metals joint for years. This deeply-out-of-favor metal may be embarking on a sea-change sentiment shift, finally returning to amplifying gold’s upside. Silver is not only radically undervalued relative to gold, but investors are aggressively buying. Silver’s upside potential is massive. ここ2週シルバーは急騰した、ゴールドを遥かに凌ぐものだ。これは注目すべきことだ、もう何年もシルバーはひどいものだった。この極端に嫌われた金属が大きく心理を買えている、とうとうゴールド上昇を増幅するに至った。シルバーは対ゴールドで極端に過小評価されているだけでなく、投資家は積極的に買い進んでいる。シルバーの潜在上昇力は巨大なものだ。 Silver’s performance in recent years has been brutally bad, repelling all but the most fanatical contrarians. Historically silver prices have been mostly ...
Amazonで買物をしてContrarianJを応援しよう "On The Precipice" by Tyler Durden Mon, 06/24/2019 - 14:30 Authored by Kevin Ludolph via Crescat Capital, Dear Investors: The US stock market is retesting its all-time highs at record valuations yet again. We strongly believe it is poised to fail. The problem for bullish late-cycle momentum investors trying to play a breakout to new highs here is the oncoming freight train of deteriorating macro-economic conditions. 米国株式は記録的バリエーションのもとで再度過去最高を試している。私どもはこれが失敗すると強く信じている。景気拡大終盤で強気のモメンタム投資家が新高値を試そうとしていることの問題は、マクロ経済条件の悪化にある。 US corporate profit growth, year-over-year, for the S&P 500 already fully evaporated in the first quarter of 2019 and is heading toward outright decline for the full year based on earnings estimate revision trends. Note the alligator jaws divergence in the chart be...
中国が債務増加していることはたしかです。ただ日本の例を日銀資金循環報告でみると家計、320兆円、民間非金融機関1,785兆円、一般政府 1,284兆円となります。合算すると3,300兆円にもなり、GDPの600%を超えています。 https://www.boj.or.jp/statistics/sj/sjexp.pdf この記事の統計と同じ考え方で数値を採用しているのかどうか気になります。 加えて、この資金循環報告に書かれている海外資産というのが内数なのか外数なのか?私にはよくわかりません。当然海外債務も結構な額になります。一度日銀資金循環 図表1を見てください。詳しい方に教えていただければ。 この中国のたどる道は昔のソ連とかMMTと同様で、自国通貨ならいくら発行しても倒産はしない、というか為政者が痛みに耐えることができず緩和を続けるというものです。でも最終的には限界点に達します。ソ連は建国から崩壊まで70年かかりました。 自由主義経済なら立ち行かなくなった企業は退場してもらうというのが減速なのですが、これがうまくゆかないわけです。 でも日本は中国のはるか先を言っているように見えます。ちょっと検索したのですが、日本の債務に関しては政府債務に言及したものばかりで、この記事のように民間、個人まで総合的に記載しているのは日銀の資金循環統計しか見つけることができませんでした。 China Continues To Pile Debt On Top Of More Debt Written by Jesse Colombo | Feb, 27, 2019 Like many countries, China attempted to rein in its debt growth over the past couple years, but ultimately gave up and is now back to piling on even more debt. Bloomberg reports – 多くの国と同様に、中国もここ2年ほど債務増加を抑えようとしてきた、しかし結局の所諦めてしまい、今や更に債務を積み上げている。ブルームバーグ記事ーー For almost two years,...