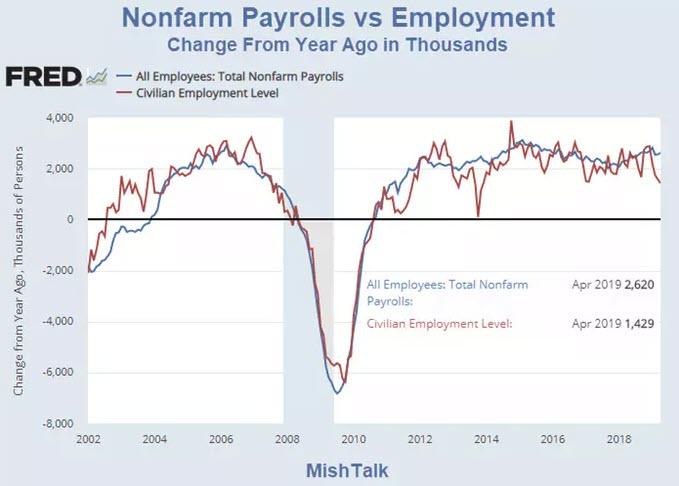
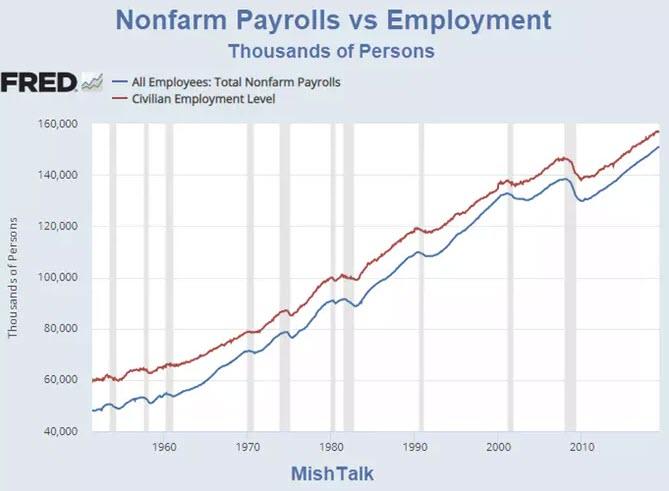
Authored by Mike Shedlock via MishTalk, In the past year, the BLS says the number of jobs rose by 2.62 million. Employment rose by 1.429 million. 昨年、BLS労働統計局によるとjobs 雇用 が2.62M増えた。Employment 就労の増加は1.429Mだった。
The discrepancy between the increase in jobs and the increase in employment is 1,191,000. On average, over the past year, that's a discrepancy of 99,250 every month, in favor of jobs. jobs増加とemployment増加の間の乖離は1,191,000だ。昨年の場合、平均して毎月99.250の乖離がある、jobsのほうが改善が良好だ。
Household Survey vs. Payroll Survey
Household Survey 家計調査 vs. Payroll Survey 機関調査
The payroll survey (sometimes called the establishment survey) is the
headline jobs number, generally released the first Friday of every
month. It is based on employer reporting.
Payroll survey(機関調査とも言われる)は毎月第一金曜に jobs number として開示される。この数字は雇用主の従業員名簿調査報告に基づいている。
The household survey is a phone survey conducted by the BLS. It measures unemployment and many other factors.
家計調査はBLSが電話で行う。この電話調査では失業やその他多くの調査を行う。
Numbers in Perspective
数字をどうみるか
In the household survey, if you work as little as 1 hour a week, even selling trinkets on eBay, you are considered employed.
If you don’t have a job and fail to look for one, you are not
considered unemployed, rather, you drop out of the labor force.
Searching want-ads or looking online for jobs does not count. You need
to submit a resume or talk to a prospective employer or agency.
In the payroll survey, three part-time jobs count as three jobs. The
BLS attempts to factor this in, but they do not weed out duplicate
Social Security numbers. The potential for double-counting jobs in the
payroll survey is large.
These distortions and discrepancies artificially lower the
unemployment rate, artificially boost full-time employment, and
artificially increase the payroll jobs report every month.
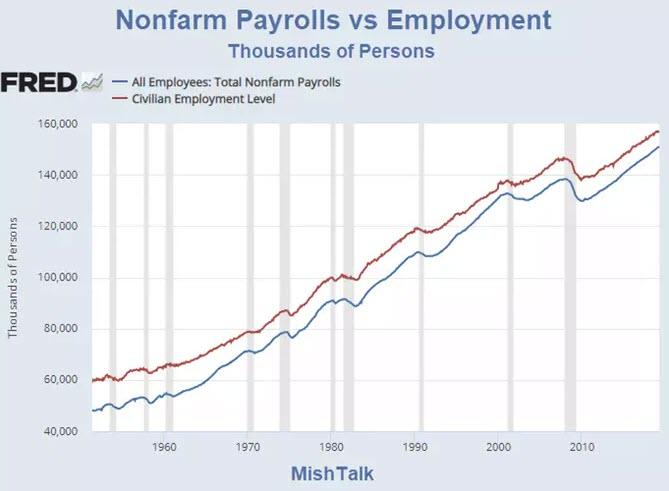
Over time, the numbers move in sync. There is no clear pattern around
recessions. In many years the levels converge before a recession, but
ahead of the great recession the numbers diverged.
長期に渡ってみると、これら2つの数字の変動は同期している。景気後退期近傍で明らかなパターンがあるわけではない。景気後退前には何年かかけてこの数字が収束する傾向にある、しかしながらあの the great recession に向けては2つの数字が乖離に向かっていた。
Nonfarm Payrolls vs Employment Detail
非農業雇用統計 vs 就労数の詳細
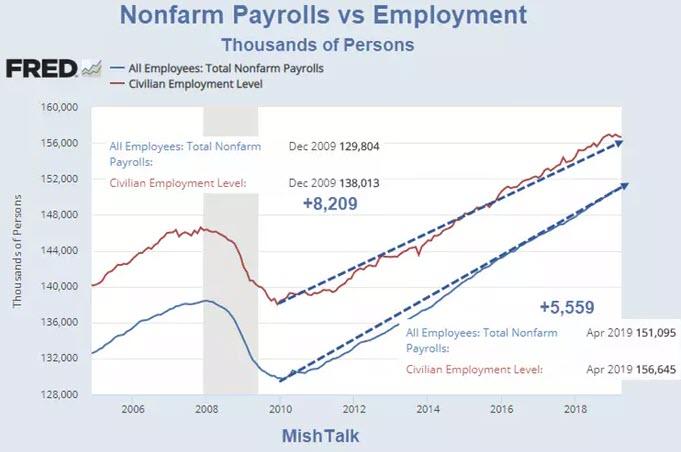
In December of 2009 the difference between payrolls and employment was 8.21 million. This month, the difference is 5.56 million. 2009年12月時点で、雇用統計と就労数の乖離は8.21Mだった。今月時点でこの乖離は5.56Mだ。
Since the lows in December of 2009, the BLS tells us employment rose
by 18,632,000. The number of jobs rose by 21,291,000. That's a
difference of 2,659,000.
In the past year alone, the difference between jobs and employment is
a whopping 1,191,000. That's a discrepancy of 99,250 every month, in
favor of jobs.
I strongly suggest double-counting of jobs by the BLS when people take extra part-time jobs or shift jobs. 私は強くこう示唆する、人々がパートタイムの仕事を追加したり転職したとき、BLS調査のjobsが二重計上されている。 For a closer look at today's jobs report please see Jobs +263,000 vs. Employment -103,000: Unemployment Rate 3.6% Lowest Since 1969. 今日、第一金曜の雇用統計をよく理解するために、これを確認するが良い、Jobs +263,000 vs 就労数 -103,000: 失業率3.6% 1969年以来の最低値。
Amazonで買物をしてContrarianJを応援しよう 記事を紹介しようと訳を入れている間にFOMCが過ぎてしまいタイミングを逸してしまいました、前半は読み飛ばしてください。後半部分に関して、日本では一般会計と特別会計が別れていて政府財政がわかりにくいですが、米国は分離されておらず年金会計がより鮮明になります。$70Tって邦貨でいうと約7000兆円ですからね。 Whistling Past The $70 Trillion Debt Graveyard 07-26-19 Written by Lance Roberts | Jul, 27, 2019 Last week, we discussed the setup for a near-term mean reversion because of the massive extension above the long-term mean. To wit: 先週には、私どもは短期的な平均回帰のし掛けが出来上がっていることを議論した、というのも現在長期的な平均から極端に乖離しているからだ。見てみよう: “There is also just the simple issue that markets are very extended above their long-term trends, as shown in the chart below. A geopolitical event, a shift in expectations, or an acceleration in economic weakness in the U.S. could spark a mean-reverting event which would be quite the norm of what we have seen in recent years.” 「とてもかんたんなことだが、市場は長期的なトレンドからあまりに極端に上方乖離している、それは下のチャートを見れば明らかだ。地政学的出来事、期待値の変化、もしくは米国経済の弱さが加速するなら、平均回帰を引き起こすだろう、それは過去数年でみた典型的な相場の動きだ。」 This analysis is ...
Productivity: What It Is & Why It Matters Written by Michael Lebowitz | Jan, 16, 2019 The Kansas City Federal Reserve posted the Twitter comment and graph below highlighting a very important economic theme. Although productivity is a basic building block of economic analysis, it is one that few economists and even fewer investors seem to appreciate. Kansas 市FEDがツイッターにコメントを投稿した、そのグラフを下に示す、とても重要な経済テーマだ。経済分析においては生産性というのはとても重要な要素だが、ほとんどのエコノミストがこの件に言及しない、投資家は更にこのことを忘れ去っている。 The Kansas City Fed’s tweet is 100% correct in that wages are stagnating in large part due to low productivity growth. As the second chart shows, it is not only wages. The post financial-crisis economic expansion, despite being within months of a record for duration, is by far the weakest since WWII. Kansas City FEDのツイートは100%正しい、給与が停滞している原因の主要因は生産性成長が低いからだ。二番目のチャートを見ても判るように、成長鈍化は給与だけではない。あの金融危機後の経済拡大は、第二次世界大戦後で記録的長期の拡大期間だが、とても弱い拡大だ。 Productivity growth over the last 350+ years is ...
米国はよく理解してませんが、日本の場合では量的緩和で日銀が国債買い上げした資金は日銀当座預金にそのままです、市中には流れていません。でもNHKのニュース等では「ジャブジャブ」という表現をアナウンサーが使い、さらに丁寧に水道の蛇口からお金が吐き出される画像まで示してくれます。これって心理効果が大きいですよね。量的緩和とは何かを7時のニュースや新聞でこれ以上丁寧に解説するのはそう簡単ではありません。一般の人も株式をやっている人も「イメージ」で捉える以上はそう簡単にできません。多くの人は量的緩和とはなにか、を理解していないと私は想像しています。 ただし、国債を買い上げるので長期金利が低下し住宅ローン金利等が下がったのは確実な効果です。一方で長短金利差が少なくなると銀行のビジネスモデルが成り立たなくなりますが。 This Is The One Chart Every Trader Should Have "Taped To Their Screen" by Tyler Durden Sat, 01/19/2019 - 18:55 After a year of tapering, the Fed’s balance sheet finally captured the market’s attention during the last three months of 2018. 一年間のテーパリング後、FEDバランスシートがとうとう市場の注目をあびることになった、2018年の最後の3ヶ月だ。 By the start of the fourth quarter, the Fed had finished raising the caps on monthly roll-off of its balance sheet to the full $50bn per month (peaking at $30bn USTs, $20bn MBS...
Amazonで買物をしてContrarianJを応援しよう この長文記事をRay Dalioが発表し、ゴールドは$1400から$1420へと急騰しました。GLD保持高に変化はないのでたぶん先物ポジションが進んでいます。 Ray Dalio Warns A "New Paradigm" Is Coming: "Buy Gold, Sell Stocks" by Tyler Durden Wed, 07/17/2019 - 14:44 Authored by Ray Dalio via LinkedIn, One of my investment principles is: 私の投資原則はこういうものだ: Identify the paradigm you’re in, examine if and how it is unsustainable, and visualize how the paradigm shift will transpire when that which is unsustainable stops. 現在のパラダイムを認識し、それがどの程度持続可能かどうか判断する、そしてパラダイムシフトがどのように起きるか、そしてその着地点を思い描く。 Over my roughly 50 years of being a global macro investor, I have observed there to be relatively long of periods (about 10 years) in which the markets and market relationships operate in a certain way (which I call “paradig...