Submitted by Joseph Carson, Former Chief Economist, AllianceBernstein,
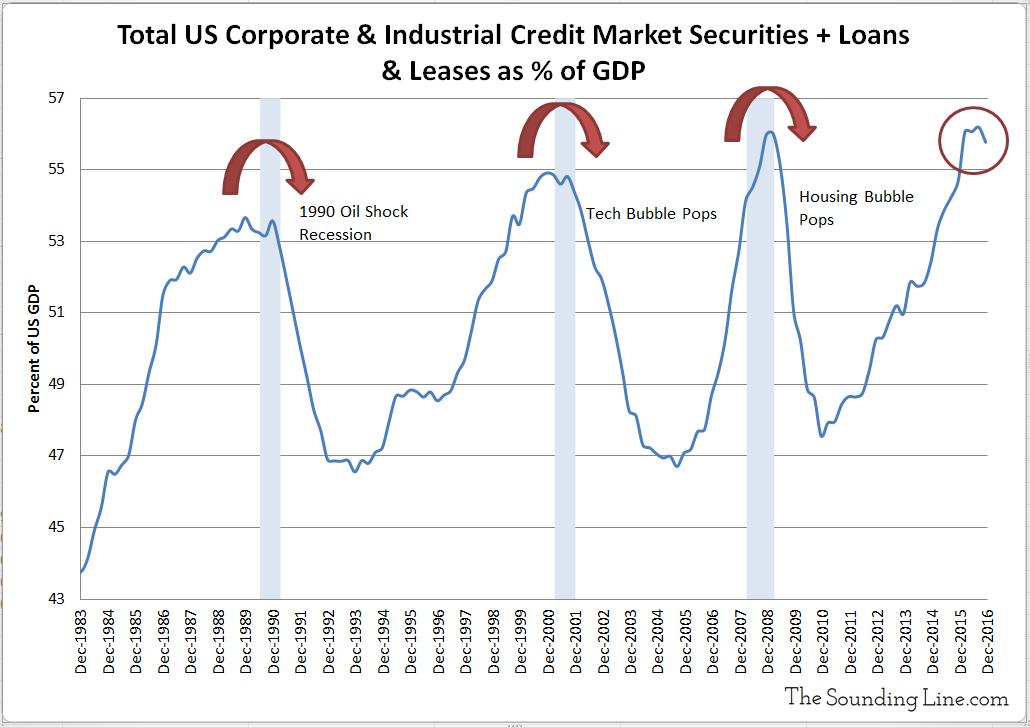
Decisions to change official rates can no longer be made exclusively on economic growth and price considerations as the dynamics of business cycles have changed. The new business cycle consists of growth and financial leverage (debt), replacing the old cycle of growth and price leverage.
As such, decisions to provide more monetary accommodations to
sustain growth or lift inflation to the preferred target has to be
weighed against growing financial vulnerabilities associated with the
sharp rise in private sector debt. Promises by policymakers to
provide additional monetary accommodation to sustain the growth cycle is
more likely to do more long-term harm than good as it will only
increase the scale of financial vulnerabilities.
In recent decades, monetary policy through its adjustments and control of short-term interest rates has had more influence on financial transactions than economic ones
as individuals and nonfinancial corporations have engaged in active
management of the liability side of their balance sheet, taking on
record amounts of debt at relatively low rates, elevating real and
financial asset prices in the process, while providing only modest
benefits to overall economy.
For example, since 2011 nonfinancial corporations have added to $5.2
trillion in debt to their balance sheets. Corporations used this debt
for a variety of purposes, such as acquiring other companies, purchasing
real estate, buying back their own stock, while also investing in plant
and equipment to run their regular business operations. Yet, the
incremental growth in nonresidential investment has been a little more
than $1 trillion. In other words, for every $5 borrowed by nonfinancial
corporations only $1 has found itself redeployed in the real economy.
In the 2000s cycle, households also went on a borrowing binge, adding
over $7 trillion in new debt over the span of seven years. Most of the
new debt was invested in real estate. Over the course of the 2000's
growth cycle households added $2 of debt for every $1 increase in
consumer spending and investment in housing. Much higher ratios of debt
to new investment occurred during the dot.com boom of the late 1990s and the the commercial real estate boom of the late 1980s.
All of these episodes highlight the new linkages and tradeoffs between monetary policy and financial activities. Yet,
the failure to adapt, and even recognize, the changing linkages caused
policymakers to miss, or downplay, the buildup of financial
vulnerabilities in the system and the adverse shocks to the economy and
the financial system were repeated time and again.
Each period of excessive credit and financial leverage was
followed by a long bout of debt-deleveraging forcing the Fed to engage
in a "financial engineering" campaign to cushion the economy and bring
stability to the financial system. Following the commercial
real estate crash of the early 1990s the Federal Reserve lowered
official rates 650 basis points; 550 basis points following the dot-com
bubble; and 500 basis points (and probably an extra 200 basis points of
easing occurred with the Fed’s asset purchase program) after the housing
bubble.
Today, even though the current environment has similar
characteristics---large increases in debt and elevated asset
prices--that preceded each of the past three recessions policymakers do
not seem to be concerned about the growing buildup of financial
vulnerabilities. Yet, the financial markets with Treasury yields
out to 10 years trading well below the target on the federal funds rate
suggests that the limits of the Fed's "financial engineering" have been
reached and additional monetary accommodation will have a negative
trade-off between costs and benefits. 今日では、現在の環境はそれらとよく似たものだがーー債務が大きく増え資産価格が大きく上昇しているーー過去三回の景気後退前に政策立案者は積み上がる金融システム脆弱性を懸念していなかったように見える。ただ、金融市場を見ると、10年債金利はすでにFFRよりも低くなっており、FEDの「金融工学」も限界に達し、さらなる金融緩和策はコスト・ベネフィットを考えるとマイナストレードオフとなるだろう。
In fact, it would not be a surprise if market yields stay near
current levels even if the Fed decides to lower official rates since
encouraging more debt growth would only tip the scale more so to a bad outcome down the road.
Amazonで買物をしてContrarianJを応援しよう この長文記事をRay Dalioが発表し、ゴールドは$1400から$1420へと急騰しました。GLD保持高に変化はないのでたぶん先物ポジションが進んでいます。 Ray Dalio Warns A "New Paradigm" Is Coming: "Buy Gold, Sell Stocks" by Tyler Durden Wed, 07/17/2019 - 14:44 Authored by Ray Dalio via LinkedIn, One of my investment principles is: 私の投資原則はこういうものだ: Identify the paradigm you’re in, examine if and how it is unsustainable, and visualize how the paradigm shift will transpire when that which is unsustainable stops. 現在のパラダイムを認識し、それがどの程度持続可能かどうか判断する、そしてパラダイムシフトがどのように起きるか、そしてその着地点を思い描く。 Over my roughly 50 years of being a global macro investor, I have observed there to be relatively long of periods (about 10 years) in which the markets and market relationships operate in a certain way (which I call “paradig...
Amazonで買物をしてContrarianJを応援しよう Silver Outperforming Gold 2 Adam Hamilton July 26, 2019 3232 Words Silver has blasted higher in the last couple weeks, far outperforming gold. This is certainly noteworthy, as silver has stunk up the precious-metals joint for years. This deeply-out-of-favor metal may be embarking on a sea-change sentiment shift, finally returning to amplifying gold’s upside. Silver is not only radically undervalued relative to gold, but investors are aggressively buying. Silver’s upside potential is massive. ここ2週シルバーは急騰した、ゴールドを遥かに凌ぐものだ。これは注目すべきことだ、もう何年もシルバーはひどいものだった。この極端に嫌われた金属が大きく心理を買えている、とうとうゴールド上昇を増幅するに至った。シルバーは対ゴールドで極端に過小評価されているだけでなく、投資家は積極的に買い進んでいる。シルバーの潜在上昇力は巨大なものだ。 Silver’s performance in recent years has been brutally bad, repelling all but the most fanatical contrarians. Historically silver prices have been mostly ...