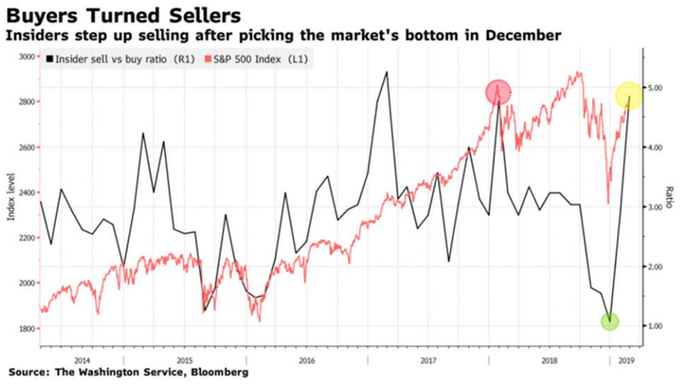
Last week, one of the most confounding features of the post-Christmas rally was resolved,
when following a 4 month boycott, bearish investors finally threw in
the towel and after pulling money from equity funds for 13 weeks, bought
a whopping $27.3Bn of US stock funds and ETFs in the week ending on
March 13th. This was the second largest inflow on record, behind
$38.30bn from March of last year, and contrasts with a mix of small
inflows and outflows earlier this year, including a $5.83bn outflow in
the prior week.
先週のことだが、クリスマス後のラリーでもっとも混乱してきたことが解決した、4か月ポジションを取っていなかったが、とうとうベア派がタオルを投げて諦めた、市場から13週に渡り資金を引き上げていたが、なんと$27.3Bもの資金を米国株とETFに投じた、3月13日までの一週間の出来事だ。この買いは米国史上二番目のものだ、一番は$38.30Bで昨年3月のものだ、今年の薄商いでの売り買い交錯が今年になって続いていたがこれまでの動きとは大きく異なるものだ、その前の週は$5.83Bの資金流出だった。
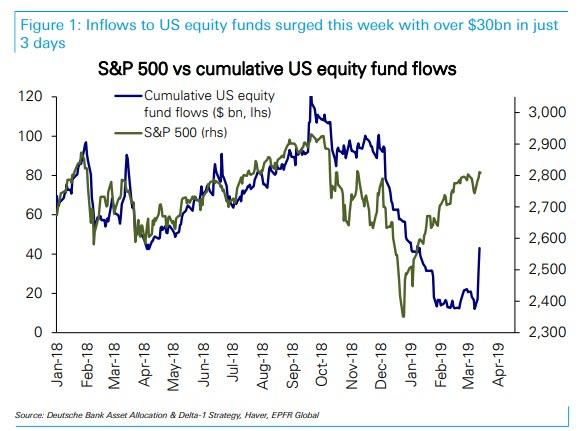
The topic of reversing equity flows was also the key focus in the latest note from DB's Parag Thatte, who writes that following
large outflows of over $100bn since October, US equity funds this week
saw inflows surge with over $31bn in the first 3 days, helping drive the S&P 500 back to the top of its recent range.
What to make of this sudden fund flow reversal? As Thatte explains,
there have been only a handful of episodes (9) in the last few years
when US equities saw inflows at such a strong pace. These episodes were
of two types:
In a majority of episodes surging inflows were a contrarian indicator.
6 out of the 9 episodes saw the S&P 500 fall an average of -5.9%
over the course of the following one month, accompanied by outflows.
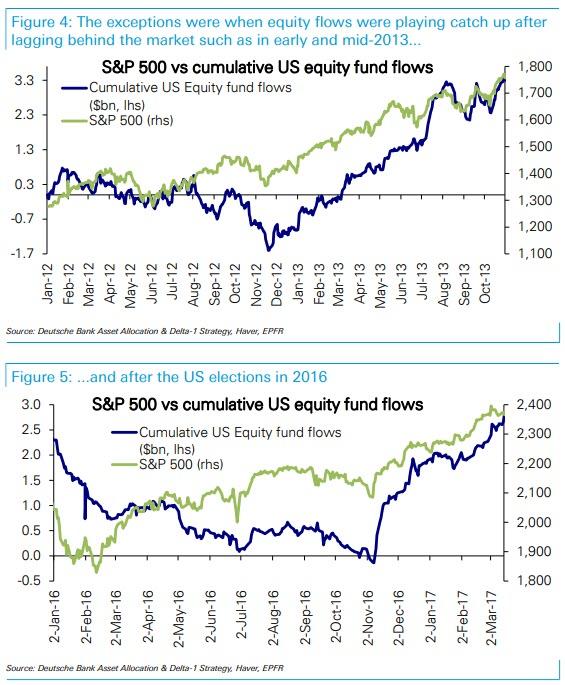
Exceptions were when inflows were just catching up after lagging the market.
In early- and mid-2013 and in late 2016 following the US elections,
strong equity inflows continued for an extended period of time after the
initial surge, driving the market even higher. These exceptions are
instructive in that they all occurred when inflows were playing catch up
after lagging far behind a market rally, which may be the case now.
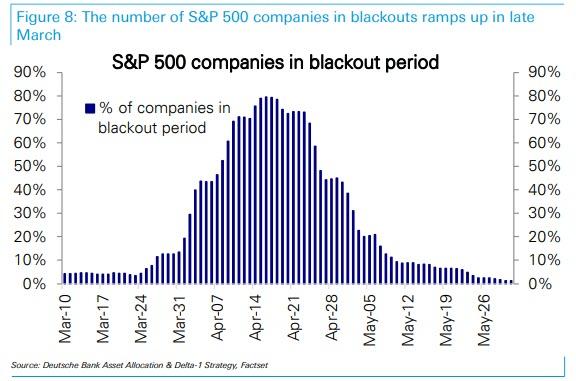
However, arguing for the former, less cheerful take on the fund flow
timing reversal is an additional downside risk that has emerged this
week: according to Deutsche, the number of S&P 500 companies
in blackouts will ramp up sharply starting in the last week of March
and peak mid-April, implying a reduced pace of buybacks. As
Thatte warns, "the outsized role played by buybacks in driving the rally
in this recovery cycle as well as investor attention focused on the
blackout period recently adds to the risks highlighted above."
So as companies are about to go cold turkey on what has been another
year of record buybacks, who will be buying - or selling? The answer, as
Thatte explains in laying out the various flows expected from
systematic strategies, is mixed:
The Risk from Vol Control is to the downside. Vol
Control funds were quiet this week. VIX dropped from 16 to 13.5 over
the week as the market rebounded, while 1M realized vol was flat at 9. Vol Control funds are near full equity allocations, so risk is to the downside if volatility spikes.
Vol Controlからのリスクを見ると下落傾向だ。Vol Control ファンドは今週おとなしかった。VIXはこれまでの16から今週13.5に下落した、市場のリバウンドによるものだ、一方で一月のボラティリティは変わらずの9だった。Vol Control ファンドは目一杯株式露出している、そのためもしボラティリティが急上昇すると下落リスクは大きい。
CTAs are poised to buy in the next 7-10 days if a sell-off does not materialize. CTAs
are in aggregate net long S&P 500 and other equity indices, however
with lighter positioning than in 2017-2018. With S&P 500's 50d MA
rising and only -1.7% below the 200d MA, expect more buying if those
technical triggers cross. That is likely to occur within the next 7-10 trading days if a sell-off doesn't materialize. In other words, they will buy unless they sell.
Risk Parity continues to buy equities providing a tailwind. Equity
allocations for Risk Parity are still low relative to their historical
range. Risk Parity managers started buying equities a few weeks ago and
will continue to be incremental buyers in the coming weeks as long as
cross asset volatility continues to decline.
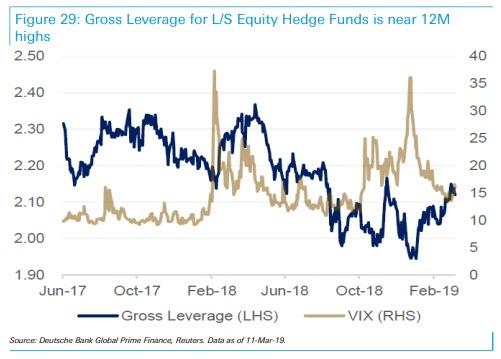
Finally, as the market stormed higher so did hedge fund Gross
Leverage for Equity L/S Hedge Funds, which is now near 12M highs, after
managers slowly added risk YTD. Equity L/S Hedge Funds had a strong
week bringing YTD returns to +6% on average. Top $-longs continue to
outperform top $-shorts, although PMs trimmed net exposure slightly.
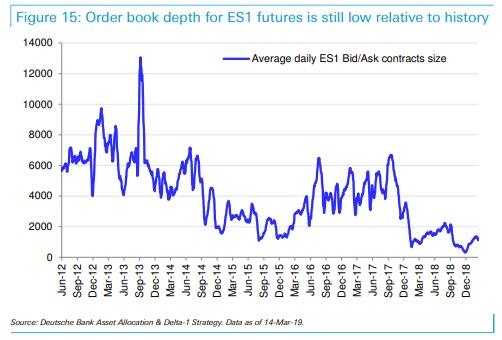
One last observation: Emini (S&P futs) liquidity remains abysmal,
with the average ES bid/ask contracts size just above 1,000 and toughly
where it average for much of the fourth quarter. This means that any
abrupt and sustained reversal will likely lead to sharp and violent drop
in the market, as multiple bid levels are taking out in a rerun of what
happened in December.
How Are Gold And Money Supply Related? by Tyler Durden Sun, 06/14/2020 - 13:00 Authored by Mike Shedlock via MishTalk, M2 Money Supply is surging. Will gold follow? M2マネーサプライが急増している。ゴールドはこれを追従するだろうか? Let's investigate an alleged relationship between gold and M2, a measure of money supply in the US. よく言われるM2(米国のマネーサプライ指標)とゴールドの関係について調べてみよう。 "There’s a clear correlation between the annual growth rate in M2 money supply and the price of the yellow metal. " 「M2の年率増加速度とゴールド価格の間には明らかな相関がある。」 Clear Correlation? 明らかな相関? The Tweet claims something different than my lead chart depicts. So let's investigate the above idea in other time frames. このツイートの主張は私が示す最初のチャートが示すものとは異なる。というわけでこのtweetの主張を別の時間フレームで見てみよう。 Gold vs Rate of Change in M2 Money Supply ゴールド vs M2マネーサプライの変化率 If we look at longer time frames, the rate of increase in M2 theory falls flat on its face....
Is The Stock Market As Confused As You Are About A Recession? Written by Lance Roberts | Apr, 1, 2019 Last week, Barron’s ran an article entitled “The Stock Market Is Just As Confused About A Potential Recession As You Are?” To wit: 先週バロンズにこういう記事が掲載された「株式市場は景気後退を予感させるほどに混乱しているだろうか?」見てみよう: “Investors have long used where we are in the economic cycle to decide which stocks to buy and sell. New research from Nomura’s Joseph Mezrich flips that on its head by showing how investors can use stock performance to help determine where we are in the cycle. Too bad the market is sending mixed messages right now.” 長らく投資家は現在景気サイクルのどこに居るかを見てこの株式を売るか買うかを判断してきた。野村證券のJoseph Mezrichの最近の研究では、これが逆さで、投資家は株式のパフォーマンスを見て今景気サイクルのどこにいるかを判断している。最悪なことに現在相場は悪化改善混在のメッセージを送っている。」 But let’s be clear here; no one wants the party to end. So, despite a struggling stock market over the last year, slowing economic growth, and a collapsing yield curve, there are s...