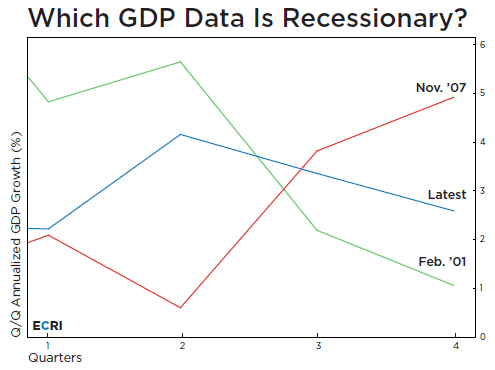
On the verge of the 2001 recession, in February 2001, the real-time
data showed GDP growth declining to 1.1% (green line). But with the Fed
cutting rates, the S&P 500 saw a one-and-a-half-month 19% spurt in
April-May, even as the recession tightened its grip.
And in November 2007, on the cusp of the Great Recession, real-time
data showed GDP growth surging to 4.9% (red line). Only in the years
following the recession did revisions cut it down to less than half that
initial reading.
The point is that, at least in real time, the strength of GDP growth
does not tell us whether a recession is about to hit. It is only long
after the fact, following repeated revisions, that the GDP data becomes
more informative about the timing of the recession.
While the current cycle’s recent 2.6% GDP growth print – tracking
right in-between the 2001 and 2007 trajectories – was well received by
many economic prognosticators (blue line), by no means does it rule out a
looming recession.
In principle, GDP is a coincident indicator of the economy, with no real predictive value. But because more than half of
the initial GDP estimate is based on survey data and the extrapolation
of recent trends, the initial vintages of GDP are often misleading,
especially around business cycle turning points.
This helps explain why it is often only well after a recession has
begun that revisions to GDP data show an economic contraction in
progress. Until then, the consensus may be wrongly persuaded that the
coast is clear.
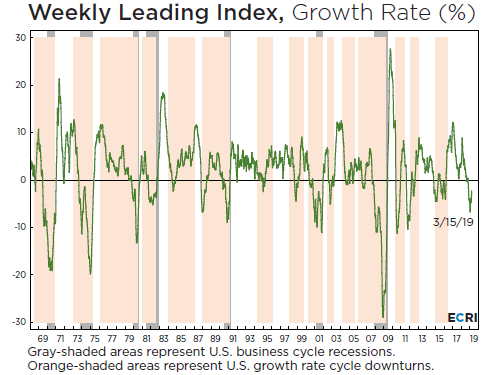
This is a key reason why good leading indexes are so valuable. Unlike
GDP, ECRI’s leading indexes avoid major revisions over time, most
crucially with regard to their cyclical timing and directional calls.
Consequently, we were able to call the 2001 recession and Great
Recession on a timely basis.
最後の二段落だけ訳しておきます。 Stock Euphoria Stunts Gold Adam Hamilton April 19, 2019 3257 Words The great euphoria emanating from these near-record-high stock markets is breathtaking. Traders are again convinced stocks do nothing but rally indefinitely. That everything-is-awesome mindset has stunted gold’s latest upleg, since there’s no perceived need for prudently diversifying stock-heavy portfolios. But that psychology can change fast, as we saw a half-year ago. Gold investment roars back as stocks roll over. The word “euphoria” is widely misunderstood, often confused with “mania”. The latter is when stocks rocket vertically in blowoff tops, and is defined as “an excessively intense enthusiasm, interest, or desire”. The US stock markets certainly aren’t in a mania. At its latest high last Friday, the flagship US S&P 500 broad-market s...
The Message From The Jobs Report – The Economy Is Slowing Written by Lance Roberts | Apr, 8, 2019 Last week, the Bureau of Labor Statistics (BLS) published the March monthly “employment report” which showed an increase in employment of 196,000 jobs. As Mike Shedlock noted on Friday: 先週、BLSが3月の月例「雇用統計」を発表した、雇用が196,000増えたという。Mike Shedlockは金曜にこう書いた: “The change in total non-farm payroll employment for January was revised up from +311,000 to +312,000, and the change for February was revised up from +20,000 to +33,000. With these revisions, employment gains in January and February combined were 14,000 more than previously reported. After revisions, job gains have averaged 180,000 per month over the last 3 months. 「1月全非農業雇用は+311,000から+312,000に改定された、2月のデータは+20,000から+33,000に改定された。これらの改定で1月と2月を合算した雇用増は以前の報告よりも14,000多くなった。改定後でみると、雇用増は直近三ヶ月で平均180,000/月となる。 BLS Jobs Statistics at a Glance BLS 雇用統計概観 Nonfarm Payroll : +196,000 – Establishment Survey Emp...