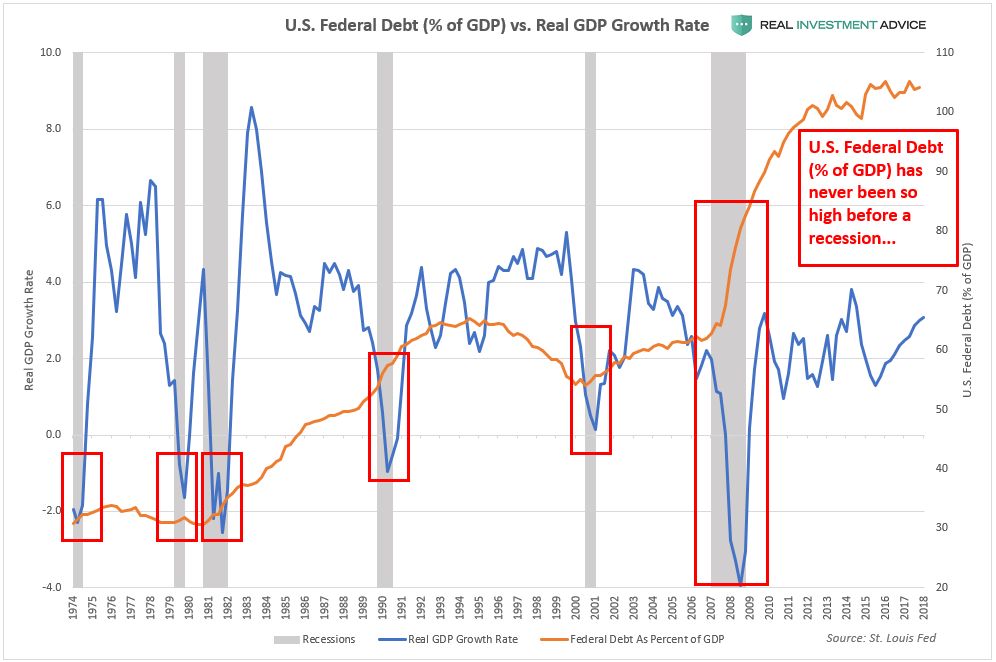
As the current economic cycle becomes increasingly long-in-the-tooth and macroeconomic and earnings data deteriorate, it is time to start thinking about the next recession. In particular, I wanted to point out that the U.S. federal debt burden has never been so high before a recession, as the chart below shows (hat tip to my Twitter follower @grimacemcdonald
for the idea). In past recessions (see gray bars on chart), the U.S.
federal government ramped up spending in order to help support the
economy. With federal debt at over 100% of the GDP (vs. 62% before the
Great Recession), however, it will be a much greater challenge to keep
the economy afloat in the coming recession.
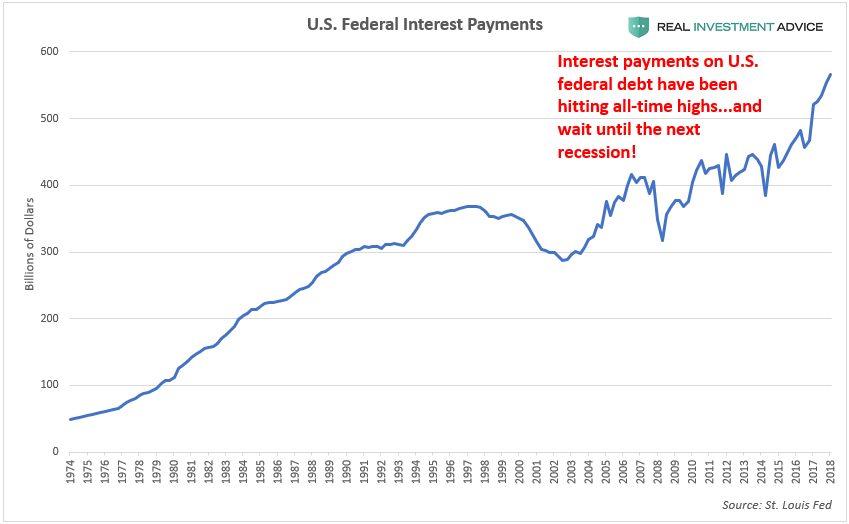
Though interest rates have been at ultra-low levels for the past
decade, the sheer amount of U.S. federal debt (over $22 trillion) is the
reason why interest payments have spiked over the past couple years. To
make matters worse, this debt will eventually need to be refinanced at
higher interest rates, which means that interest payments will rise even
more. Another recession combined with another ramp-up of federal debt
will cause these payments to rise even more. This is how sovereign debt
crises happen.
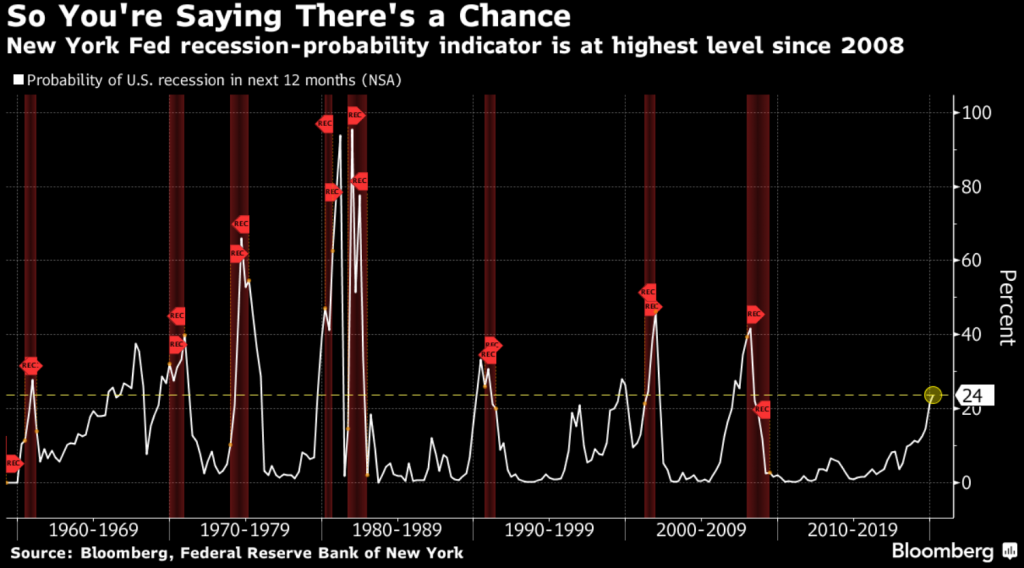
Think another U.S. recession is unlikely any time soon? As Lance Roberts has been saying,
the odds are much higher than most people think. For example, the
extremely accurate New York Federal Reserve recession indicator is now
at its highest level since 2008:
米国景気後退はまだ遠いと思うだろうか? Lance Rovertsがずっと言っているが、多くの人が思っているよりもその可能性は大きい。たとえば、これまでとても正確に予想実績のあるNew York FEDの景気後退指数は今や2008年以来で最高になっている:
Though the stock market has been rallying in the face of deteriorating data, now is not the time for complacency. In my view,
the fact that the stock market has been rallying for the past two
months is a sign of an extremely unhealthy market in which the
Fed/central banks are panicking and doing whatever they can to prop it
up as recession odds increase.
Please follow me on LinkedIn and Twitter to keep up with my updates. Please click here to sign up for our free weekly newsletter to learn how to navigate the investment world in these risky times.
Amazonで買物をしてContrarianJを応援しよう Albert Edwards: This Was The Final Recessionary Shoe, And It Has Now Fallen by Tyler Durden Thu, 06/27/2019 - 12:45 Exactly three months ago, in late March, the 3 month-10 year spread inverted for the first time since 2007... ちょうど3か月前の3月遅くのことだ、3M10Yスプレッドが2007年以来初めて反転した・・・・ ... an event which sparked near-panic in the market as historically curve inversion has preceded the last 7 recessions. ・・・市場は準混乱状態になった、というのも歴史的に見てイールドカーブ反転が過去7回の景気後退の前兆となっているからだ。 However, while the inversion was certainly a memorable event, the question on everyone's lips is how do risk assets perform once the curve flattens and/or inverts. According to backtests from Goldman, since the mid-1980s, significant stock drawdowns (i.e. market crashes) began only when term slope started steepening after being inverted. ...
Powell Keeps The Bond Bull Kicking Written by Lance Roberts | Mar, 21, 2019 In a widely expected outcome, the Federal Reserve announced no change to the Fed funds rate but did leave open the possibility of a rate hike next year. Also, they committed to stopping “Quantitative Tightening (or Q.T.)” by the end of September. 多くの人が予想したとおり、FEDはFFR変更をしないだけでなく来年も不明とした。さらには、QTを9月末に終えると約束した。 The key language from yesterday’s announcement was: 昨日の発表の重要な部分はこういう具合だ: “ Information received since the Federal Open Market Committee met in January indicates that the labor market remains strong but that growth of economic activity has slowed from its solid rate in the fourth quarter . Payroll employment was little changed in February, but job gains have been solid, on average, in recent months, and the unemployment rate has remained low. 「1月のFOMC以来の情報を分析すると、労働市場は強いがQ4に比べると経済成長は鈍化している。2月の雇用環境にほとんど変化がなかった、ここ数ヶ月確実に雇用は増えている、そして失業率は低いままだ。 Recent indicators point to s...
Amazonで買物をしてContrarianJを応援しよう "On The Precipice" by Tyler Durden Mon, 06/24/2019 - 14:30 Authored by Kevin Ludolph via Crescat Capital, Dear Investors: The US stock market is retesting its all-time highs at record valuations yet again. We strongly believe it is poised to fail. The problem for bullish late-cycle momentum investors trying to play a breakout to new highs here is the oncoming freight train of deteriorating macro-economic conditions. 米国株式は記録的バリエーションのもとで再度過去最高を試している。私どもはこれが失敗すると強く信じている。景気拡大終盤で強気のモメンタム投資家が新高値を試そうとしていることの問題は、マクロ経済条件の悪化にある。 US corporate profit growth, year-over-year, for the S&P 500 already fully evaporated in the first quarter of 2019 and is heading toward outright decline for the full year based on earnings estimate revision trends. Note the alligator jaws divergence in the chart be...