Authored by Erik Lytikainen via RealInvestmentAdvice.com,
Mark Twain once said, “history doesn’t repeat itself, but it often rhymes.”
Since President Nixon removed the gold standard in the early 1970s,
gold has seen several significant rallies, all of which have similar
wave characteristics. Gold rallies seem to rhyme.
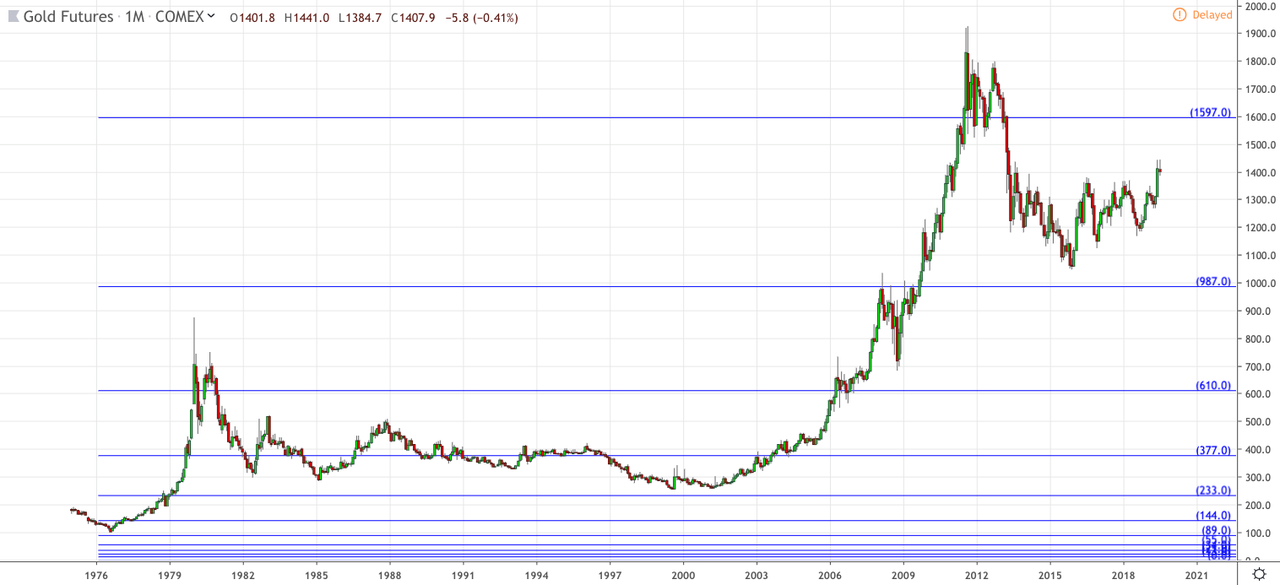
The first two price rallies began in 1971 and 1977, during and after
the de-linking of the U.S. dollar from gold. The most recent price rally
has its seeds in the dot-com bubble in the early 2000s. The chart
below shows two long-term monthly gold rallies, with the second rally
appearing to be an amplified but similar version of the first. I have
overlaid Fibonacci sequence numbers to demonstrate how the price of gold
has spiked upward in expanding, fractal waves during these prior
surges.
In the 1970s, gold traveled through four Fibonacci levels (by this
measure) in less than a decade after the removal of the gold standard.
From 2000 through 2012, amid the dot-com and housing bubbles, gold also
traveled through four Fibonacci levels on the way to $1,900.
If history rhymes again, and I believe it will, then the price of
gold will again spike upward through three or four Fibonacci extensions
to the upside, but then re-trace 50% to 70% of that upward move. If so, then the next upward spike could peak in the range between $7,000 and $11,000 per ounce. もし歴史がまたもや韻を踏むと言うなら、私はそれを信じているが、ゴールド価格はまたもや3度か4度フィボナッチレベルを超えて上昇するだろう、しかしその後その上昇も50%から70%後退するだろう。もしそうなるなら、次の上昇スパイクは$7,000から$11,000の間ということになる。
Investors tend to make rash decisions based on fear and greed. These
emotions are typically amplified during times of financial stress. It is
during such times that gold solicits fear and greed motivated buyers.
During a crisis, fear investors will rotate into gold to hold value, and
greed investors see the upward momentum and jump on the train. The
upward momentum of the next gold rally might feel like the Bitcoin surge
in 2017.
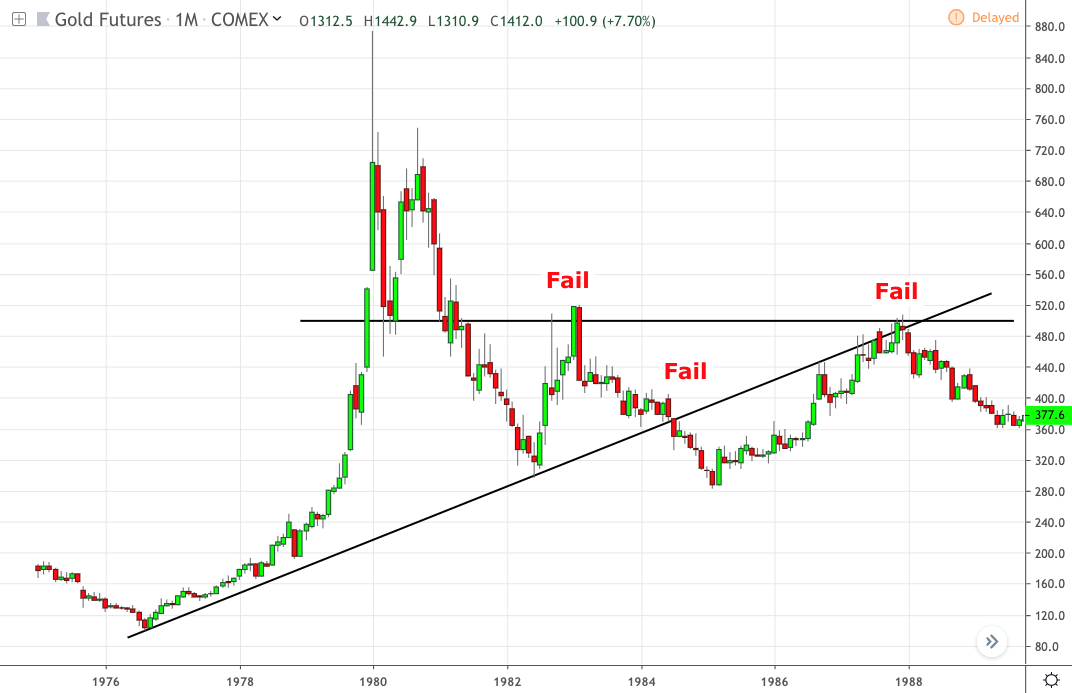
In baseball, its “three strikes and you’re out.” After the 1970’s
surge and blow-off top in 1980, gold failed three key technical tests.
After these failures, the gold market floundered for another decade.
Let’s take a closer look at those three technical failures.
First, in early 1983, gold failed to retake and hold the
psychologically important $500/oz price level. This rejection resulted
in sideways to lower movement for another year before gold failed again,
breaking below its upward trend line near $360/oz. After falling to a
low in early 1985, gold moved higher over the next three years, only to
fail a third key resistance test near $500/oz in late 1987. After
“striking out” in the 1980s, gold fell throughout the next decade back
to $250/oz.
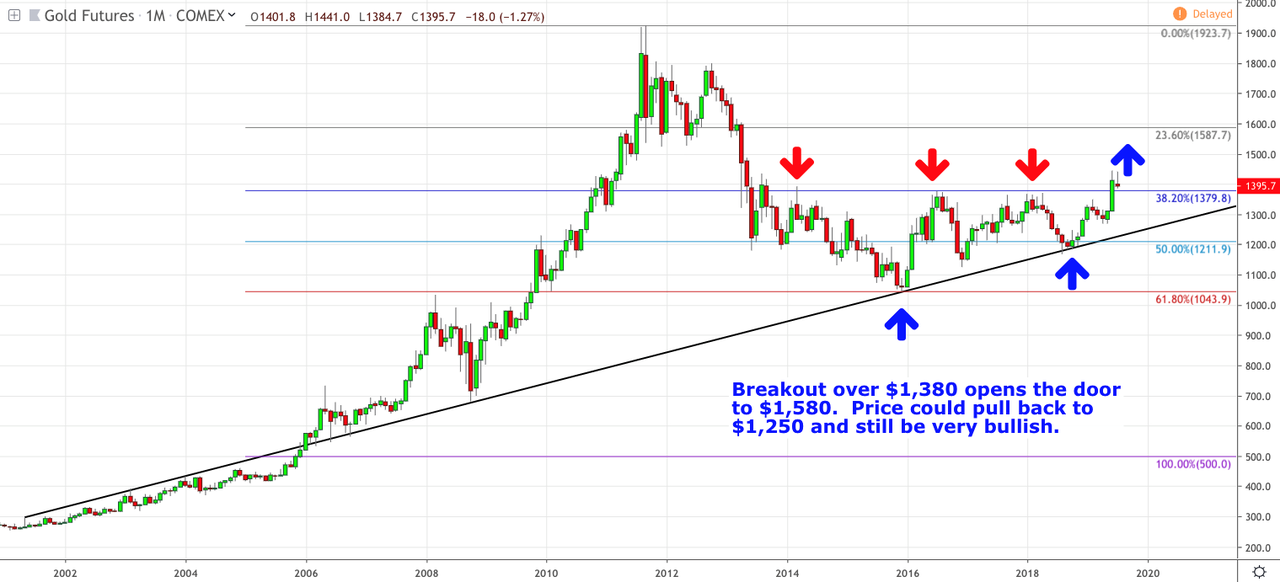
Unlike the gold bear market of the 1980s, gold has been passing
periodic tests of support and resistance since its sharp decline in
2013. Gold’s price retracement from a high above $1,900 to a low near
$1,040 kept the price above a 61.8% Fibonacci retracement level as well
as the psychologically important $1,000 per ounce level.
The monthly wave structure of gold is bullish, and the price is now
trading above key resistance levels, with solid support at $1,379 and
$1,250. Even if the price of gold falls back to support at $1,250 per
ounce, the long term technical picture remains bullish. I view the
recent breakout over $1,380 to be significant and has likely opened the
door towards the $1,580 resistance area.
To the downside, technical breakdowns below $1,250 could lead the way
to $1,211 and $1,043. If history does indeed rhyme, a breakdown below
$1,043 could lead to another decade of futility. This downside scenario
does not appear likely, especially not with the uber-accommodative
interest rate policies worldwide. High U.S. dollar interest rates broke
the back of the gold rally in the 1980s, and there does not appear to
be any such risk of this happening again anytime soon.
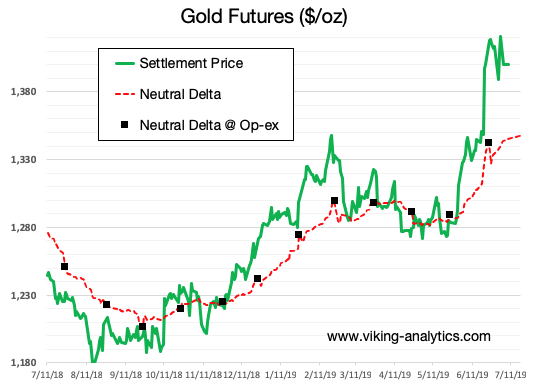
In addition to my longer-term view on gold, I also track shorter-term
price signals to locate areas of accumulation and/or hedging. An
indicator I developed shows a mean-reversion relationship between price
and the point of Neutral Delta in the options market. Essentially, the
point of Neutral Delta shows where the options market participants have
placed their bets and hedges. At the moment, Neutral Delta is near
$1,345 per ounce for the options which expire on July 25th.
When the price is over-bought in relation to Neutral Delta (as it is
now), we tend to see headwinds for further price increases.
Interpreting the current data, I am led to believe that the price of
gold will re-test the $1,380 price level before July 25th, and this will
give the options hedgers an opportunity to optimize their hedge book
ahead of the next few option expirations. A lower probability event
would be a price spike again towards $1,450 which would like force a
short-covering rally by the call option sellers who may already be
out-of-the-money.
If we are in the opening innings of a new rally in gold, a retest of
$1,380 or even $1,250 will represent great opportunities to buy or add
to your gold positions. You can learn more about my research by clicking this link: Introduction to Options Sentiment.
Gold can be best viewed as financial insurance. If you believe that
you should own insurance, then you should also own gold. In terms of
investment performance, gold will do best during times of international
financial stress. In the past, the price of gold has moved
exponentially higher during these periods as demand for the ultimate
safe haven goes viral.
The world is slowly but steadily transitioning from a U.S.
dollar-backed financial system to a multi-currency, multi-polar system.
One day, the leaders of our world will let the rest of us know the plan
for a modified financial system, and we will have to admit that we were
warned many times in advance. I expect that the gold price spike will
happen before, during, and after a new Bretton Woods-type conference.
While there are many signs that a new financial order is imminent, the
transition to this new financial order could take more time than many
have been led to believe.
From a short-term perspective, I use gold puts to protect my current
precious metal allocations. This is like purchasing insurance on the
value of my current insurance policy. It also helps preserve my wealth
allowing me to buy more gold if prices do in fact, drop to $1,380 or
$1,250.
How Are Gold And Money Supply Related? by Tyler Durden Sun, 06/14/2020 - 13:00 Authored by Mike Shedlock via MishTalk, M2 Money Supply is surging. Will gold follow? M2マネーサプライが急増している。ゴールドはこれを追従するだろうか? Let's investigate an alleged relationship between gold and M2, a measure of money supply in the US. よく言われるM2(米国のマネーサプライ指標)とゴールドの関係について調べてみよう。 "There’s a clear correlation between the annual growth rate in M2 money supply and the price of the yellow metal. " 「M2の年率増加速度とゴールド価格の間には明らかな相関がある。」 Clear Correlation? 明らかな相関? The Tweet claims something different than my lead chart depicts. So let's investigate the above idea in other time frames. このツイートの主張は私が示す最初のチャートが示すものとは異なる。というわけでこのtweetの主張を別の時間フレームで見てみよう。 Gold vs Rate of Change in M2 Money Supply ゴールド vs M2マネーサプライの変化率 If we look at longer time frames, the rate of increase in M2 theory falls flat on its face....
Is The Stock Market As Confused As You Are About A Recession? Written by Lance Roberts | Apr, 1, 2019 Last week, Barron’s ran an article entitled “The Stock Market Is Just As Confused About A Potential Recession As You Are?” To wit: 先週バロンズにこういう記事が掲載された「株式市場は景気後退を予感させるほどに混乱しているだろうか?」見てみよう: “Investors have long used where we are in the economic cycle to decide which stocks to buy and sell. New research from Nomura’s Joseph Mezrich flips that on its head by showing how investors can use stock performance to help determine where we are in the cycle. Too bad the market is sending mixed messages right now.” 長らく投資家は現在景気サイクルのどこに居るかを見てこの株式を売るか買うかを判断してきた。野村證券のJoseph Mezrichの最近の研究では、これが逆さで、投資家は株式のパフォーマンスを見て今景気サイクルのどこにいるかを判断している。最悪なことに現在相場は悪化改善混在のメッセージを送っている。」 But let’s be clear here; no one wants the party to end. So, despite a struggling stock market over the last year, slowing economic growth, and a collapsing yield curve, there are s...