Proving
that higher prices aren't always better news, housing in Manhattan may
finally be catching a bid after a nearly yearlong slump in prices has
plunged far enough to finally attract buyers. Additionally, inventory
growth finally looks to be slowing down.
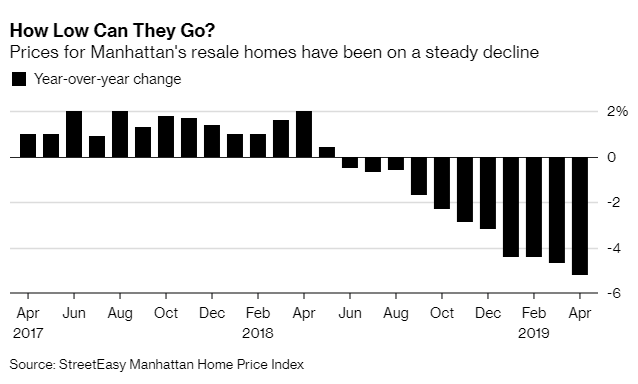
Manhattan home prices were thrashed again in April, falling the most since 2010
- but this time, there may be somewhat of a silver lining. The falling
prices caused buyers to "pounce", resulting in 1,193 homes under
contract during the month - more than any month since April of 2015,
according to data provided by Bloomberg and StreetEasy. Perhaps deflation is not so evil after all.
マンハッタン住宅価格が再び4月に下落した、2010年以来の大きな下落だーーしかし今回は希望の兆しが起きているかもしれない。価格下落で買い手が「殺到」している、結果として4月に1,193戸が契約に至ったーー2015年4月以来の成約数だ、ブルームバーグとStreetEasyのデータによるものだ。デフレも悪いものではない。
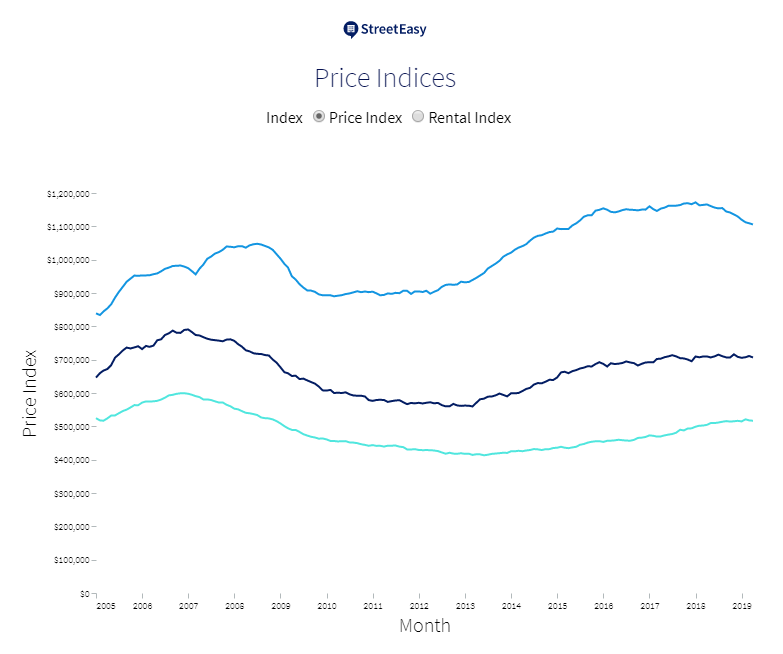
StreetEasy's price index fell 5.2% from a year ago to $1.11 million.
The index measures change in resale prices for the same properties over
time. It was the largest decline in the index since April 2010, when the index dropped 6.1%. StreetEasyの価格指数は一年前から5.2%下落し$1.11Mになった。この指数は同一不動産の再度の売り出し価格変化を追跡している。2010年4月以来の大幅下落だ、当時この指数は6.1%下落した。
The newfound bid for homes could be a sign that Manhattan's market
may be emerging from a drought of buyers, who had been previously been
sitting on the sidelines, scared of overpaying for properties. As prices
move toward more realistic buyer expectations, capital has been put to
work.
Grant Long, senior economist at StreetEasy said: “Sellers are finally
getting that many of their price expectations were not realistic.
They’re lowering their prices to a point that’s attractive to buyers.”
StreetEasy の上級エコノミストGrant Longが言うには:「予想価格が現実的でないことに売り手が気づき始めた。買い手の興味を引くまで値を下げ始めた。」
Here are some of StreetEasy's additional findings:
さらにStreetEasyはこういう点を指摘する:
The most homes went into contract since 2015. The
number of pending sales in Manhattan increased 26.6% from last year, up
by more than 250. The number of homes entering contract in Upper
Manhattan doubled year over year, from 66 to 132.
Inventory growth slowed. While sales inventory
growth remained in the double digits at 10.8%, it still moved at the
slowest pace in 13 months. The volume of new inventory hitting the
market shrank by 9.6% over last year.
As sellers priced homes more strategically from the start, fewer made price cuts. The
share of homes with a price cut fell slightly for the first time in 13
months. Some 14.1% of Manhattan homes saw a price decrease in April —
down 0.6 percentage points from last year. The share of price cuts fell
the most in the Upper West Side — down 2.1 percentage points to 14.2%.
年初より売値は戦略的になっており、値下げをする売りてもいる。値下げする住宅の割合はこの13か月で初めて少し減った。4月に値下げしたマンハッタン住宅は14.1%だったーー昨年から0.6%減っている。値下げ割合が減ったのはおもに Upper West Sideだーー2.1ポイント減って14.2%となった。
Luxury home inventory dropped slightly. The number
of homes for sale priced within the top 20% of the market fell by 0.3%,
the first year-over-year decrease in inventory since February 2018.
Recall, in early May, we wrote that inflated and overpriced retail real estate in Manhattan was turning the city into a "wasteland". Later, the Post wrote an article confirming our writeup from late March which pointed out that high prices were driving businesses out of town:
The total number comes to precisely one — a tiny shop to buy drones.
That’s right: On a nine-block stretch of what’s arguably the world’s
most famous avenue, steps south of the bustling Time Warner Center and
the planned new Nordstrom department store, lies a shopping wasteland.
開いている店は一軒だけだーードローン買い取りの小さな店だけだ。まさにそのとおり:この9ブロックは世界で最も有名なとおりだ、Time Warner Centerの賑わいから南へ、そしてNordstormが新規店舗を計画している、これがシャッター街となっている。
It appears that, despite what central bankers think, the only
logical, and natural, response to high prices is, gasp, low prices.
Unfortunately, while the Federal Reserve may be willing to ease back on
US home prices, it has so far refused to do the same to the stock
market. And just like unsustainably high prices resulted in the bursting
of the housing bubble in 2007, so the inability of the market to
deflate to a fair value will be the reason behind the next great bubble
burst.
How Are Gold And Money Supply Related? by Tyler Durden Sun, 06/14/2020 - 13:00 Authored by Mike Shedlock via MishTalk, M2 Money Supply is surging. Will gold follow? M2マネーサプライが急増している。ゴールドはこれを追従するだろうか? Let's investigate an alleged relationship between gold and M2, a measure of money supply in the US. よく言われるM2(米国のマネーサプライ指標)とゴールドの関係について調べてみよう。 "There’s a clear correlation between the annual growth rate in M2 money supply and the price of the yellow metal. " 「M2の年率増加速度とゴールド価格の間には明らかな相関がある。」 Clear Correlation? 明らかな相関? The Tweet claims something different than my lead chart depicts. So let's investigate the above idea in other time frames. このツイートの主張は私が示す最初のチャートが示すものとは異なる。というわけでこのtweetの主張を別の時間フレームで見てみよう。 Gold vs Rate of Change in M2 Money Supply ゴールド vs M2マネーサプライの変化率 If we look at longer time frames, the rate of increase in M2 theory falls flat on its face....
Is The Stock Market As Confused As You Are About A Recession? Written by Lance Roberts | Apr, 1, 2019 Last week, Barron’s ran an article entitled “The Stock Market Is Just As Confused About A Potential Recession As You Are?” To wit: 先週バロンズにこういう記事が掲載された「株式市場は景気後退を予感させるほどに混乱しているだろうか?」見てみよう: “Investors have long used where we are in the economic cycle to decide which stocks to buy and sell. New research from Nomura’s Joseph Mezrich flips that on its head by showing how investors can use stock performance to help determine where we are in the cycle. Too bad the market is sending mixed messages right now.” 長らく投資家は現在景気サイクルのどこに居るかを見てこの株式を売るか買うかを判断してきた。野村證券のJoseph Mezrichの最近の研究では、これが逆さで、投資家は株式のパフォーマンスを見て今景気サイクルのどこにいるかを判断している。最悪なことに現在相場は悪化改善混在のメッセージを送っている。」 But let’s be clear here; no one wants the party to end. So, despite a struggling stock market over the last year, slowing economic growth, and a collapsing yield curve, there are s...