And yet, Regan's less than prescient headline notwithstanding, he made an accurate point in his teaser, namely that "regular investors are leaving."
That, as we have pounded the table week after week after week, has been the real story of 2019 -
not the relentless, artificial melt-up in the market on the back of a
dovish reversal by central banks and the daily US-China trade talk
"optimism" which we now know is not happening.
Confirming that this trend continued for one more week, even as the
S&P hit new all time highs, Bank of America's strategist Jill Carey
Hall writes that last week, during which the S&P 500 was up +0.2%,
virtually everyone sold stocks, as "Institutional clients, hedge funds
and private clients sold the highs in equities last week." And yet,
somehow the S&P hit a new all time high. How? The answer: "Corporate buybacks ramped up."
このトレンドが更にもう一週続くことを確認して、S&Pが新高値となっても、BoAストラテジストのJill Carey Hallは先週こういう記事を書いた、S&P500が0.2%上昇しほとんど誰もが株式を売る中でこういう記事を書いたのだ、「法人顧客、ヘッジファンド、個人顧客は先週の高値で株式を売った」。それでもS&Pは新高値をつけた。どうしてか?その答えは:「自社株買いが積み上がった。」
As BofA elaborates, "buying was led by corporate buybacks, as
all other groups (hedge funds, institutional and retail clients) were
net sellers of equities for the second consecutive week." This
means that for one more week, traditional investors were - as Regan
noted above - boycotting stocks, and were delighted to sell stock back
to the companies that were once again aggressively buying back their own
stock with the S&P hitting all time highs, to wit:
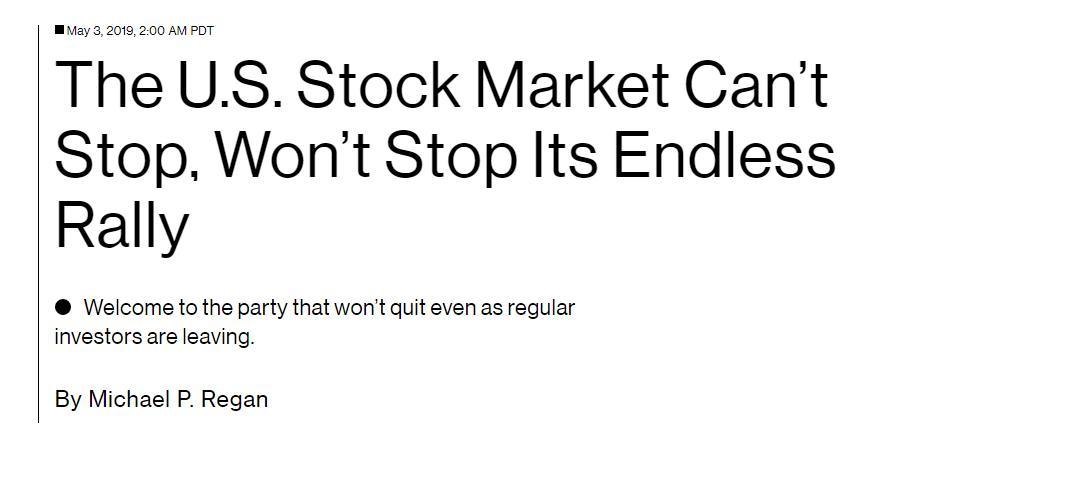
Clients were net sellers of single stocks (2nd straight week), but continued to buy ETFs (8th straight week). Cumulative flows into ETFs YTD turned positive, reversing outflows seen earlier this year (Chart 1).
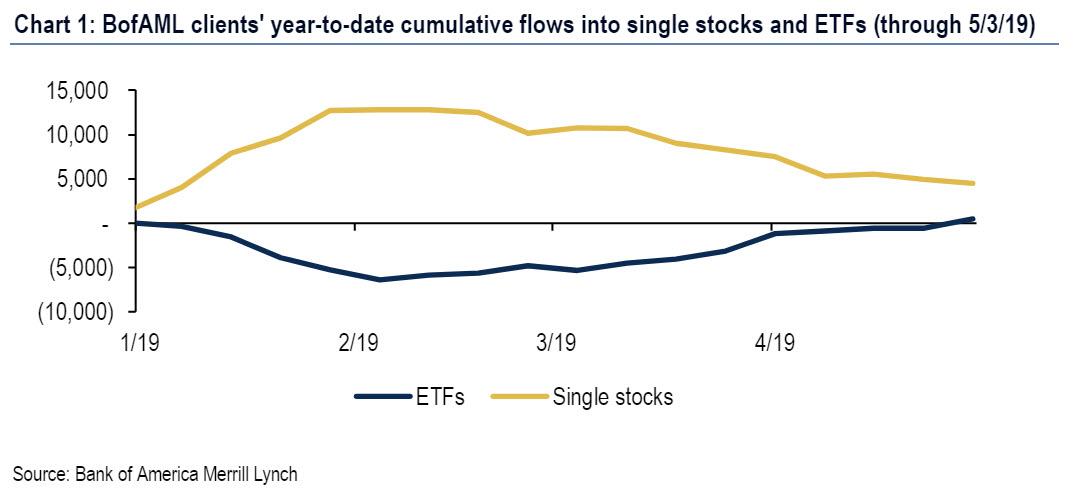
Buybacks last week were their highest since early Feb: they tend to
be strong during earnings seasons and seasonally peak in mid/late May. Buybacks YTD are +20% YoY, though the growth rate continues to decline.
But if everyone else was selling, how did buybacks offset the selling
avalanche? Simple: according to BofA's stock repurchase desk, "buybacks
last week were their highest since early Feb: they tend to be strong
during earnings seasons and seasonally peak in mid/late May. Buybacks YTD are +20% YoY, though the growth rate continues to decline."
While this means that we can once and for all forget about the
recurring lie of a buyback blackout period - which as we explained
before applies only to a very narrow subset of stock repurchases - it
also means that we have reached a level of market lethargy where stock
buybacks are powerful enough to offset all other selling. .
Amazonで買物をしてContrarianJを応援しよう "On The Precipice" by Tyler Durden Mon, 06/24/2019 - 14:30 Authored by Kevin Ludolph via Crescat Capital, Dear Investors: The US stock market is retesting its all-time highs at record valuations yet again. We strongly believe it is poised to fail. The problem for bullish late-cycle momentum investors trying to play a breakout to new highs here is the oncoming freight train of deteriorating macro-economic conditions. 米国株式は記録的バリエーションのもとで再度過去最高を試している。私どもはこれが失敗すると強く信じている。景気拡大終盤で強気のモメンタム投資家が新高値を試そうとしていることの問題は、マクロ経済条件の悪化にある。 US corporate profit growth, year-over-year, for the S&P 500 already fully evaporated in the first quarter of 2019 and is heading toward outright decline for the full year based on earnings estimate revision trends. Note the alligator jaws divergence in the chart be...
中国が債務増加していることはたしかです。ただ日本の例を日銀資金循環報告でみると家計、320兆円、民間非金融機関1,785兆円、一般政府 1,284兆円となります。合算すると3,300兆円にもなり、GDPの600%を超えています。 https://www.boj.or.jp/statistics/sj/sjexp.pdf この記事の統計と同じ考え方で数値を採用しているのかどうか気になります。 加えて、この資金循環報告に書かれている海外資産というのが内数なのか外数なのか?私にはよくわかりません。当然海外債務も結構な額になります。一度日銀資金循環 図表1を見てください。詳しい方に教えていただければ。 この中国のたどる道は昔のソ連とかMMTと同様で、自国通貨ならいくら発行しても倒産はしない、というか為政者が痛みに耐えることができず緩和を続けるというものです。でも最終的には限界点に達します。ソ連は建国から崩壊まで70年かかりました。 自由主義経済なら立ち行かなくなった企業は退場してもらうというのが減速なのですが、これがうまくゆかないわけです。 でも日本は中国のはるか先を言っているように見えます。ちょっと検索したのですが、日本の債務に関しては政府債務に言及したものばかりで、この記事のように民間、個人まで総合的に記載しているのは日銀の資金循環統計しか見つけることができませんでした。 China Continues To Pile Debt On Top Of More Debt Written by Jesse Colombo | Feb, 27, 2019 Like many countries, China attempted to rein in its debt growth over the past couple years, but ultimately gave up and is now back to piling on even more debt. Bloomberg reports – 多くの国と同様に、中国もここ2年ほど債務増加を抑えようとしてきた、しかし結局の所諦めてしまい、今や更に債務を積み上げている。ブルームバーグ記事ーー For almost two years,...
Powell Keeps The Bond Bull Kicking Written by Lance Roberts | Mar, 21, 2019 In a widely expected outcome, the Federal Reserve announced no change to the Fed funds rate but did leave open the possibility of a rate hike next year. Also, they committed to stopping “Quantitative Tightening (or Q.T.)” by the end of September. 多くの人が予想したとおり、FEDはFFR変更をしないだけでなく来年も不明とした。さらには、QTを9月末に終えると約束した。 The key language from yesterday’s announcement was: 昨日の発表の重要な部分はこういう具合だ: “ Information received since the Federal Open Market Committee met in January indicates that the labor market remains strong but that growth of economic activity has slowed from its solid rate in the fourth quarter . Payroll employment was little changed in February, but job gains have been solid, on average, in recent months, and the unemployment rate has remained low. 「1月のFOMC以来の情報を分析すると、労働市場は強いがQ4に比べると経済成長は鈍化している。2月の雇用環境にほとんど変化がなかった、ここ数ヶ月確実に雇用は増えている、そして失業率は低いままだ。 Recent indicators point to s...
Class 8 Heavy Truck Orders Crash 68% in January by Tyler Durden Wed, 02/06/2019 - 17:25 Among the latest dismal news about the strength of the US economy, on Tuesday ACT Research released preliminary truck orders for January 2019 which showed that Class 8 truck orders collapsed an astounding 68% for January. The decline is being attributed to a 300,000+ vehicle backlog potentially prompting fleets to halt purchases in the near term. 米国経済に関し最近憂鬱なニュースが多い中で、火曜にACT researchが2019年1月のトラック発注を開示した、1月にClass 8のトラック発注がなんと68%も急落した。この発注減は短期的に300,000台超の潜在在庫を生み出す。 Specifically, in January Class 8 net orders were 15,800 units (14,700 SA; 176,400 SAAR), down 68% YoY and down 26% MoM. Class 5- 7 January net orders were 23,400...