Since the post-financial
crisis era began more than a decade ago, record low-interest rates and the
Fed’s acquisition of $4 trillion of the highest quality fixed-income assets has
led investors to scratch and claw for any asset, regardless of quality,
offering returns above the rate of inflation.
Financial media
articles and Wall Street research discussing this dynamic are a dime-a-dozen.
What we have not heard a peep about, however, are the inherent risks within the
corporate bond market that have blossomed due to the way many corporate debt
investors are managed and their somewhat unique strategies, objectives, and legal
guidelines.
This article
offers insight and another justification for moving up in credit within the
corporate bond market. For our prior recommendation to sell junk debt based on
yields, spreads, and the economic cycle, we suggest reading our subscriber-only
article Time To Recycle Your Junk. If
you would like access to that article and many others, you can sign up for RIA Pro and
enjoy all the site has to offer with a 30-day free trial period.
By and large,
equity investors do not have guidelines regulating whether or not they can buy companies
based on the strength or weakness of their balance sheets and income statements.
Corporate bond investors, on the other hand, are typically handcuffed with legal
and/or self-imposed limits based on credit quality. For instance, most bond
funds and ETFs are classified and regulated accordingly by the SEC as
investment grade (rated BBB- or higher) or as high yield (rated BB+ or lower). Most
other institutions, including endowments and pension funds, are limited by
bylaws and other self-imposed mandates. The large majority of corporate bond
investors solely traffic in investment grade, however, there is a contingency
of high-yield investors such as certain mutual funds, ETFs (HYG/JNK), and other
specialty funds.
Often
overlooked, the bifurcation of investor limits and objectives makes an analysis
of the corporate bond market different than that of the equity markets. The
differences can be especially interesting if a large number of securities
traverse the well-defined BBB-/BB+ “Maginot” line, a metaphor for expensive
efforts offering a false line of security.
The U.S. corporate
bond market is approximately $6.4 trillion in size. Of that, over 80% is currently
rated investment grade and 20% is junk-rated.This number does not include bank loans, derivatives, or other
forms of debt on corporate balance sheets.
Since 2000,
the corporate bond market has changed drastically in size and, importantly, in credit
composition. Over this period, the corporate bond market has grown by 378%,
greatly outstripping the 111% growth of GDP.
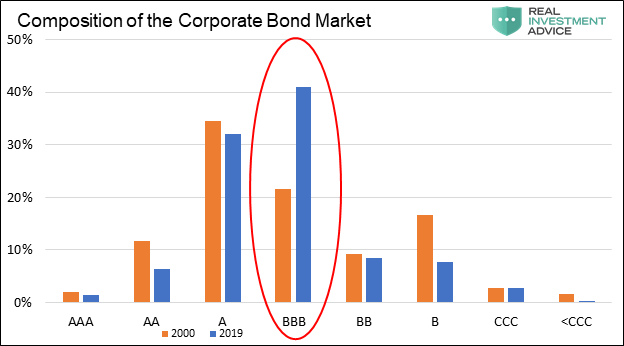
The bar chart below shows how the credit composition of the corporate
bond market shifted markedly with the surge in debt outstanding.
As circled,
the amount of corporate bonds currently rated BBB represents over 40% of corporate
bonds outstanding, doubling its share since 2000. Every other rating category constitutes
less of a share than it did in 2000. Over that time period, the size of the BBB
rated sector has grown from $294 billion to $2.61 trillion or 787%.
To recap, there
is a large proportion of investment grade investors piled into securities that are
rated BBB and one small step away from being downgraded to junk status. Making
this situation daunting, many investment grade investors are not allowed to
hold junk-rated securities. If only 25% of the BBB-rated bonds were downgraded
to junk, the size of the junk sector would increase by $650 billion or by over
50%. Here are some questions to ponder in the event downgrades on a
considerable scale occur to BBB-rated corporate bonds:
If
a recession causes BBB to BB downgrades, as is typical, will junk investors
retain their current holdings, let alone buy the new debt that has entered
their investment arena?
Will
retail investors that are holding the popular junk ETFs (HYG and JNK) and not
expecting large losses from a fixed income investment, continue to hold these
ETFs?
Will
forced selling from ETF’s, funds, and other investment grade holders result in
a market that essentially temporarily shuts down similar to the sub-prime
market in 2008?
We pose
those questions to help you appreciate the potential for a liquidity issue,
even a bond market crisis, if enough BBB paper is downgraded. If such an event were
to occur, we have no doubt someone would eventually buy the newly rated junk
paper. What concerns us is, at what
price will buyers step up? 私どもはこういう疑念を示し皆さんに潜在的な流動性の問題として捉えてほしい、BBB債権の多くが格下げとなると債券市場でも流動性問題が顕在化する。こういう状況になっても、疑いなくやがて誰かが新規格下げ債権を買うことだろう。ただし、我々の懸念は、どの価格で買い手が現れるかということだ。
Implied Risk 積み上がるリスク
Given that downgrades are a real and present danger and there is real
potential for a massive imbalance between the number of buyers and
sellers of junk debt, we need to consider how close we may be to such an
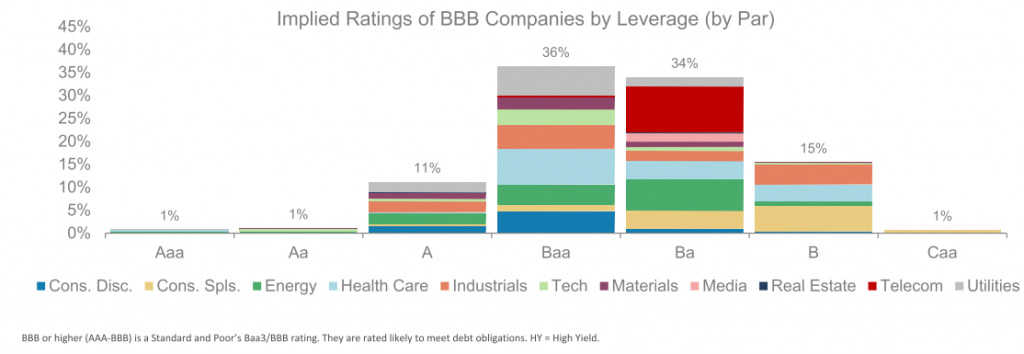
event. To provide perspective, we present a graph courtesy of Jeff
Gundlach of DoubleLine.
The graph shows
the implied ratings of all BBB companies based solely on the amount of leverage
employed on their respective balance sheets. Bear in mind, the rating agencies
use several metrics and not just leverage. The graph shows that 50% of BBB companies,
based solely on leverage, are at levels typically associated with lower rated
companies.
If 50% of
BBB-rated bonds were to get downgraded, it would entail a shift of $1.30
trillion bonds to junk status. To put
that into perspective, the entire junk market today is less than $1.25 trillion,
and the subprime mortgage market that caused so many problems in 2008 peaked at
$1.30 trillion. Keep in mind, the subprime mortgage crisis and the ensuing
financial crisis was sparked by investor concerns about defaults and resulting
losses.
As mentioned,
if only a quarter or even less of this amount were downgraded we would still
harbor grave concerns for corporate bond prices, as the supply could not easily
be absorbed by traditional buyers of junk.
Investors
should stay ahead of what might be a large event in the corporate bond market.
We recommend corporate bond investors focus on A-rated or solid BBB’s that are less
likely to be downgraded. If investment grade investors are forced to sell, they
will need to find replacement bonds which should help the performance of better
rated corporate paper. What makes this recommendation particularly easy is the
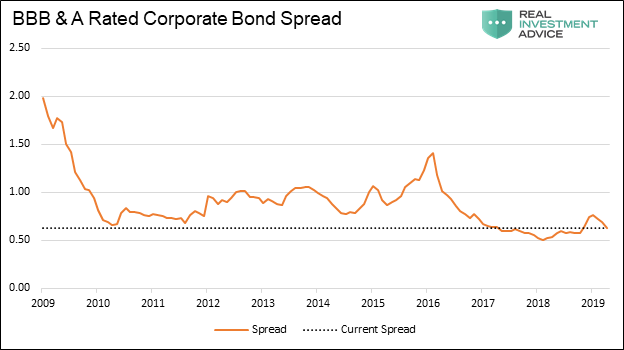
fact that the current yield spread between BBB and A-rated bonds are so tight. The
opportunity cost of being wrong is minimal. At the same time, the benefits of
avoiding major losses are large.
With the current
spread between BBB and A-rated corporate bonds near the tightest level since
the Financial Crisis, the yield “give up” for moving up in credit to A or
AA-rated bonds is a low price to pay given the risks. Simply, the market is begging
you not to be a BBB hero.
Data Courtesy St. Louis Federal
Reserve Summary 要約
The most
important yet often overlooked aspect of investing is properly recognizing and
quantifying the risk and reward of an investment. At times such as today, the
imbalance between risk and reward is daunting, and the risks and/or
opportunities beg for action to be taken.
We believe
investors are being presented with a window to sidestep risk while giving up
little to do so. If a great number of BBB-rated corporate bonds are downgraded,
it is highly likely the prices of junk debt will plummet as supply will
initially dwarf demand. It is in these
types of events, as we saw in the sub-prime mortgage market ten years ago, that
investors who wisely step aside can both protect themselves against losses and
set themselves up to invest in generational value opportunities. 私どもはこう信じている、投資家にとってリスクを回避する余地は十分にある、一方でそれを諦めることはない。もしBBB格付け債権の多くが格下げとなると、ジャンクボンドの価格は急落するだろう、当初供給が需要を圧倒するからだ。こういう出来事を、我々は10年前にサブプライム住宅再建で目の当たりにした、懸命にも回避した投資家は自らの資産を損失から守るだけでなく人生で一度の投資機会を得ることもできる。
While the
topic for another article, a large reason for the increase in corporate debt is
companies’ willingness to increase leverage to buy back stock and pay larger
dividends. Investors desperate for “safer but higher yielding” assets are more
than willing to fund them. Just as the French were guilty of a false confidence
in their Maginot Line to prevent a German invasion, current investors gain
little at great expense by owning BBB-rated corporate bonds.
The
punchline that will be sprung upon these investors is that the increase of debt,
in many cases, was not widely used for productive measures which could have
strengthened future earnings making the debt easier to pay off. Instead, the
debt has weakened a great number of companies.
Michael Lebowitz, CFA is an Investment Analyst and Portfolio Manager for Clarity Financial, LLC. specializing in macroeconomic research, valuations, asset allocation, and risk management. RIA Contributing Editor and Research Director. CFA is an Investment Analyst and Portfolio Manager; Co-founder of 720 Global Research. Follow Michael on Twitter or go to 720global.com for more research and analysis.
Amazonで買物をしてContrarianJを応援しよう Silver Outperforming Gold 2 Adam Hamilton July 26, 2019 3232 Words Silver has blasted higher in the last couple weeks, far outperforming gold. This is certainly noteworthy, as silver has stunk up the precious-metals joint for years. This deeply-out-of-favor metal may be embarking on a sea-change sentiment shift, finally returning to amplifying gold’s upside. Silver is not only radically undervalued relative to gold, but investors are aggressively buying. Silver’s upside potential is massive. ここ2週シルバーは急騰した、ゴールドを遥かに凌ぐものだ。これは注目すべきことだ、もう何年もシルバーはひどいものだった。この極端に嫌われた金属が大きく心理を買えている、とうとうゴールド上昇を増幅するに至った。シルバーは対ゴールドで極端に過小評価されているだけでなく、投資家は積極的に買い進んでいる。シルバーの潜在上昇力は巨大なものだ。 Silver’s performance in recent years has been brutally bad, repelling all but the most fanatical contrarians. Historically silver prices have been mostly ...
結局、中国は隣国日本で20年前に起きたことを学んでいなかったということでしょう、というかどの国もどの政府も十分成熟するまでは「わかっちゃいるけどやめられない」ということでしょうね、きっと。 Spooked By Apple? Wait ‘Til China’s Bubble Bursts Written by Jesse Colombo | Jan, 3, 2019 Apple stock plunged nearly 10% on Thursday after the company cut its revenue forecast due to slowing iPhone sales in China. Apple’s woes dragged U.S. stock indices lower by more than 2% as fears of a more extensive China-driven slowdown spread. アップルの株価は火曜に約10%下落した、同社が中国でのiPhone売上原則を予想したためだ。アップルの弱さが米国株式指数を2%以上押し下げた、中国主導でさらなる原則が広がるのではという懸念からだ。 From the New York Times : ニューヨークタイムスによると: For years, no matter what was happening elsewhere, global companies bet billions upon billions of dollars that China’s consumers would keep spending money. 長年、他国で何が起きようとも多国籍企業は中国消費は巨額を維持することに賭けてきた。 Now, just when the world economy could use their financial firepower, they are no longer so quick to open their wallets. 今や、世界経済が金融弾薬を用いてももはや彼らの財布を緩めることはできない。 The latest sign of a slowdown in...
Gold Stocks Surge Higher Adam Hamilton February 22, 2019 2932 Words The gold miners’ stocks surged strongly this week, blasting to new upleg highs. The mounting gains are naturally driving more interest in this small contrarian sector, shifting sentiment towards bullish. Despite their accelerating rally, gold stocks still remain fairly low technically and deeply undervalued relative to gold. So their strengthening upleg likely has plenty of room to run considerably higher in coming months. 今週金鉱株は力強く上昇し新高値となった。上昇が積み上がりこの小さなコントラリアンセクターはさらに注目を集めている、これが心理を強気なものにする。ラリーが加速するが、金鉱株はテクニカル的にはまだ安値で、対ゴールドでとても過小評価されている。というわけで力強い上昇は今後数ヶ月まだかなりな上昇余地がある。 The gold miners’ stocks are ultimately leveraged plays on gold, which overwhelmingly drives their profits. The much-maligned yellow metal has enjoyed a strong upleg since mid-August, when record gold-futures s...
Amazonで買物をしてContrarianJを応援しよう Junk Bond Bubble In Pictures: Deflation Up Next by Tyler Durden Fri, 07/19/2019 - 14:37 Authored by Mike Shedlock via MishTalk, The widely discussed "everything bubble" is, in reality, a corporate junk bond bubble on steroids sponsored by the Fed ... 幅広く議論されている「everything bubble」は実際に企業ジャンク・ボンドバブルにも言えることであり、これはFEDによりドーピング注入されている・・・ The highest grade AAA corporate bonds yield 2.75%. BBB-rated corporate bonds, just one step above junk, 3.5%. BB-rated bonds yield just 4.28%. 最高級ランクAAA企業債権の金利は2.75%だ。あとひとランク悪化でジャンク・ボンド入りするBBB債権金利は3.5%。BB格付け債権の金利でもわずか4.28%でしかない。 Corporate Bond Spreads 企業債権金利のスプレッド The spread between Prime AAA bonds and lower-medium grade bonds (see chart below) is just 0.77 percentage points. 最上位AAA債権と低中ランク債権のスプレッドがわずか0.77%しかない。 The spre...
最後の2段落だけ訳をいれておきました。 Fed’s Risky QE4 Stock Ramp Adam Hamilton January 31, 2020 3567 Words The US stock markets dramatically surged mostly in a straight line since mid-October. This extraordinary rally started when the Federal Reserve announced it would resume expanding its balance sheet for the first time in years. The deluge of new liquidity from that quantitative-easing bond buying has again acted like rocket fuel for stock markets. After shooting vertically they are in real trouble when the Fed pulls back. In early October the flagship US S&P 500 stock index (SPX) slumped to 2888. That was a mild 4.6% pullback from late July’s latest record high. The SPX was still having a great year though, up 15.2% year-to-date at that point thanks to extreme Fed easing . After the SPX had plunged 19.8% mostly in Q4’18 in a severe near-bear cor...