Preliminary Class 8 order data for September is starting to trickle in and, like the data preceding it so far this year - it's ugly. クラス8トラック発注がことしのこれまでと同様にひどい。 Class 8 orders were crushed 71% in September, reaching 12,600 units, according to Baird and Morgan Stanley. 9月にクラス8トラック発注が71%下落し、12,600台となった、Baird and Morgan Stanleyのデータだ。
This follows a 79% plunge in August.
8月の79%下落に次ぐ悪さだ。
This makes September the 11th consecutive month of YOY order declines and the 9th consecutive month of orders below 20,000. この9月で11か月連続でYoY発注が下落している、また9か月連続で20,000台を下回った。
Class 8 orders are often seen as a pulse on the U.S. economy. Morgan
Stanley analyst Courtney Yakavonis wrote in a note that she expects YOY
order declines to continue into the year's end. But Baird analyst David
Leiker said he was gaining "increased confidence" that a bottom in
declines was likely near - but that's a story we have heard from ACT Research analysts all year and orders just continue to collapse. クラス8トラックの発注は米国経済の脈動と見られることが多い。モルガン・スタンレーのアナリストCourtney Yakavonis によるとYoY下落は年末まで続くだろうということだ。しかしBairdのアナリストDavid Leikerが言うには、底打ちが近いというーーしかしACT Researchのアナリストは年内は下落は続くという。
The blame continues to fall on the trade war.
その原因は貿易戦争だ。
"Little has changed since August with respect to the
freight market and freight rates, while uncertainties surrounding trade
and tariffs continue to weigh on truck buyers' psyches," said Steve Tam, ACT vice president, according to FreightWaves.
「8月以来貨物輸送にほとんど変化は見られない、しかしながら貿易と関税に関する不確実性がトラック買い手の心理に のしかかっている」とSteve Tamは言う、かれはACTの副社長だ、FreightWavesからの引用だ。
Don Ake, FTR vice president of commercial vehicles simply said: "Class 8 orders are stuck at the bottom of the cycle." Don Ake,FTRの商用車部門副社長だ、彼が言うには:「クラス8の発注はサイクルの底にある。」
As of September, the rolling 12-month average for orders is about 214,000.
"All the orders needed for 2019 were placed months ago and fleets are
now adjusting delivery dates and finalizing requirements," Ake
continued.
If there's one silver lining, it is that the slowdown
continues to wear away at the backlog of trucks that are awaiting
assembly. ACT predicts that the number of unbuilt trucks has fallen to 135,000, down from 151,000 in August.
The number of available used trucks continues to rise, leading to
lower prices in that sector. Volvo trucks and Mack trucks are both
taking two down weeks at their Virginia and Pennsylvania factories this
quarter.
Donald Broughton, principal and managing partner of research firm Broughton Capital, told FOX Business in September that in 1H19 nearly 640 trucking firms failed. That equates to 20,000 trucks have been pulled off the road.
In 2018, only 310 trucking companies failed, which points to an
accelerating trend that could transform into a major bust cycle for the
industry in 2020.
"This has to do with the spot market," American Trucking Associations
chief economist Bob Costello told FOX Business. "Those fleets that are
primarily in the spot market are facing volumes that are down nearly 50%
and rates that are down nearly 20%."
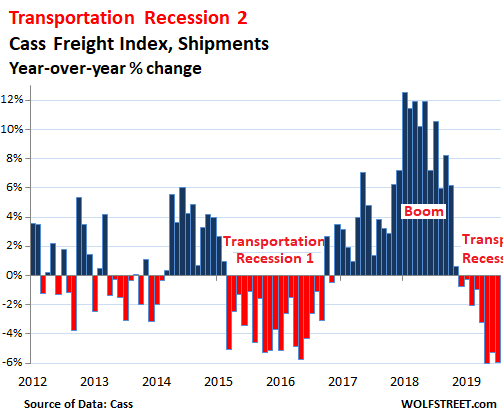
As previously reported, we've detailed how a freight recession continues to gain momentum through the end of summer, likely to continue through fall into 1H20.
最後の二段落だけ訳しておきます。 Stock Euphoria Stunts Gold Adam Hamilton April 19, 2019 3257 Words The great euphoria emanating from these near-record-high stock markets is breathtaking. Traders are again convinced stocks do nothing but rally indefinitely. That everything-is-awesome mindset has stunted gold’s latest upleg, since there’s no perceived need for prudently diversifying stock-heavy portfolios. But that psychology can change fast, as we saw a half-year ago. Gold investment roars back as stocks roll over. The word “euphoria” is widely misunderstood, often confused with “mania”. The latter is when stocks rocket vertically in blowoff tops, and is defined as “an excessively intense enthusiasm, interest, or desire”. The US stock markets certainly aren’t in a mania. At its latest high last Friday, the flagship US S&P 500 broad-market s...
Worst Start To A Year For Jobless In A Decade by Tyler Durden Thu, 03/28/2019 - 15:27 Something's not quite right... 何か全くおかしい・・・ With economic data disappointing en masse and US equity earnings expectations plummeting, talking heads have one last leg left on the stool of buy-and-hold - jobs, jobs, jobs! The unemployment rate (low), participation rate (people coming back into the workforce), wage growth (rising at fastest pace in 10 years), initial jobless claims (back near multi-decade lows), and JOLTS (more jobs offered than people available). 経済データは大きく失望するものであり、米国株式予想収益は下落している、皆が buy-and-holdで気になるのは、雇用、雇用、雇用だ! 失業率(これは低い)、労働参加率(労働力に戻り始めている)、給与(この10年でもっとも急速に増えてる)、新規失業率申請数(ここ数十年来の低位だ)、そしてJOLTS求人労働異動調査(求職よりも求人が多い)。 ...