史上最強の経済?マイナス改定を無視しているにすぎない
Amazonで買物をしてContrarianJを応援しよう
毎月の雇用統計もその修正値はあまり重視されず、みな一喜一憂するでしょう。でもこれは昔からのものではありません。だれもが自分の判断の拠り所を求めているだけで、かつてはそれが金利だっったり物価指数だったりしました。
ゴールド先物投機筋が米ドル指数を重視するのも近年のことです。昔のデータを見ると今ほどの相関はありません。
経済成長と財政赤字の関係ですが、日本では毎年GDPが2%程度の成長をしています。名目GDPは500兆円程度ですので、2%とは10兆円相当です。でも一方で政府の財政赤字30兆円がほとんど恒常化しています。借金して成長しているはずなのに、借金額よりも成長額の方が小さい。これが持続可能なはずがありません。財政赤字を考慮すると、日本はこの20年ずっとマイナス4%成長ということになります。
Authored by Lance Roberts via RealInvestmentAdvice.com,
Over the last 18-months, there has been a continual drone of political punditry touting the success of “Trumponomics” as measured by various economic data points. Even the President himself has several times taken the opportunity to tweet about the “strongest economy ever.”
これまで18か月、政治アナリストは口うるさく「Trumponomics」を褒め称えてきた、各種経済指標を見てのことだ。大統領自身も自ら「過去最強の経済」とツイートすることも何度かあった。
But if it is the “strongest economy ever,” then why the need for aggressive rate cuts which are “emergency measures” to be utilized to offset recessionary conditions?
しかし、もしこれが「過去最強の経済」なら、どうして積極的な金利引下げが必要なのだろう、金利引下げは景気後退を和らげるための「緊急措置」ではないか?
First, it is hard to have an “aggressive rate-cutting cycle” when you only have 2.4% to work with.
最初に、現状の金利2.4%から「積極的な金利引下げサイクル」を作り出すことは難しい。
Secondly, I am not sure we want to be like China or Europe economically speaking, and running a $1.5 Trillion deficit during an expansion, suspending the debt ceiling, and expanding spending isn’t that much different.
第二に、我々h中国や欧州のような経済状態になることを望んでいるのだろうか、そして景気拡大のために$1.5Tの財政赤字を続けてきた、債務上限を停止し、そして歳出拡大するのもそう変わりはない。
Nonetheless, I have repeatedly cautioned about the risk of taking credit for the economic bump, or the stock market, as a measure of fiscal policy success. Such is particularly the case when you are a decade into the current economic cycle.
Economic growth is more than just a reported number. The economy has been “in motion” following the last recession due to massive liquidity injections, zero interest rates, and a contraction in the labor force. Much like a “snowball rolling downhill,” the continuation of economic momentum should have been of little surprise.
ほかでもなく、景気下落に与信供与で対応するリスクに、私は繰り返し警告を発してきた、これを財政政策の成功とみなしている。現在の景気サイクルを10年も引き伸ばしてきたやり方だ。経済成長は言われる数字ほどのものではない。前回の景気後退から経済を「推し進めている」のは巨額の流動性注入、ゼロ金利、そして労働力の縮小によるものだ。これは「雪だるまが坂を転がり落ちる」ようなものであり、経済モメンタムの持続性は驚くようなものではない。
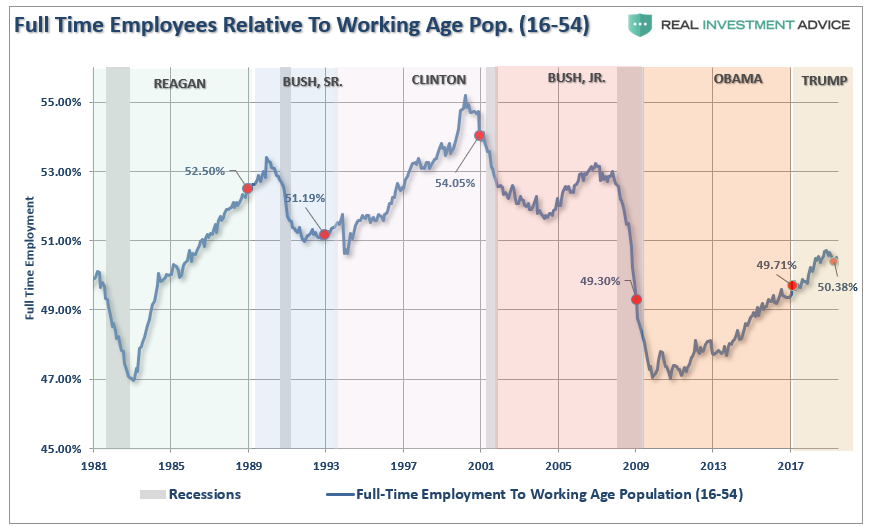
As an example, we can look at full-time employment (as a percentage of 16-54 which removes the “retiring baby boomer” argument) by President. The rise in full-time employment has been on a steady trend higher following the financial crisis as the economic and financial systems repaired themselves.
例を示すと、大統領は完全雇用状態だという(16−54歳の割合で見ており、「引退した団塊の世代」を除外している)。あの金融危機後フルタイム雇用の割合は安定して増えていた、経済と金融システムが改善するに伴ってだ。
As discussed previously, economic data is little more than a “wild @$$ guess” when it is initially reported. However, one-year and three-years later, the data is revised to reveal a more accurate measure of the “real” economy.
Unfortunately, we pay little attention to the revisions.
以前にも議論したが、経済データは発表当初は「大雑把な推測」以上のものではない。しかしながら、1年後とか3年後になり、それらのデータは改定されもっと正確になって「本当の」経済指標となる。残念なことに、我々は改定値にほとんど興味を示さない。
While there are many in the media touting “the strongest economy ever” since Trump took office, a quick look at a chart should quickly put that claim to rest.
メディアが繰り返し教えてくれるのはトランプ政権後「かつて無く強い経済」になったということだ、しかしながら下のチャートをちょっと見ればこの主張も取り下げるべきだ。
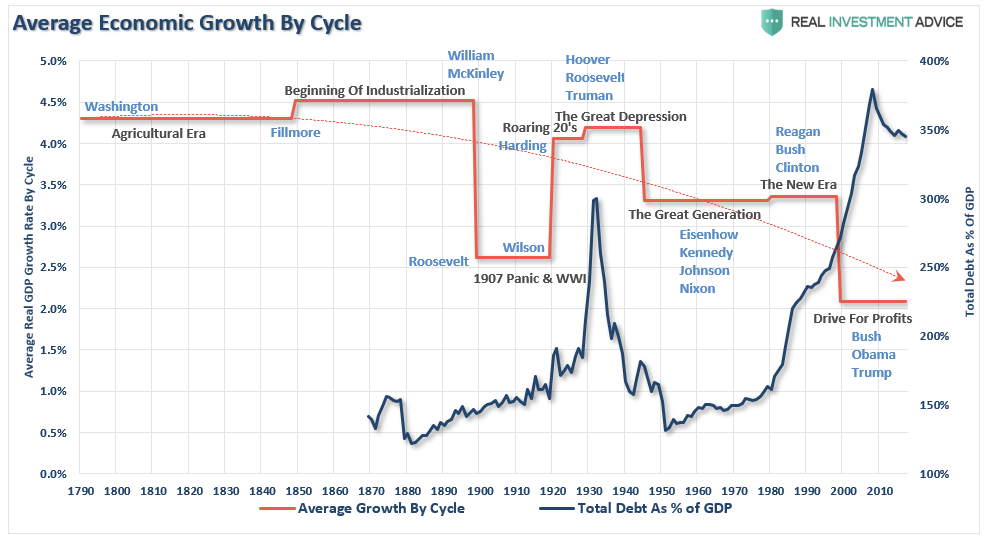
そう、2018年には力強い経済成長があった、これをみるとトランプ政策が機能しているかのように見えた。私は警告したように、そこにはデータを難解にして読みづらくしているという要因がある。
“Lastly, government spending has been very supportive to the markets in particular over the last few quarters as economic growth has picked up. However, that “sugar-high” was created by 3-massive Hurricanes in 2017 which has required billions in monetary stimulus which created jobs in manufacturing and construction and led to a temporary economic lift. We saw the same following the Hurricanes in 2012 as well.”「最後に言うと、ここ数四半期の経済成長改善には政府歳出の寄与がとても大きかった。しかしながら、このような「シュガーハイ 当分摂取後の一時的興奮状態」が生み出されたのは2017年の3回の巨大ハリケーンによるもので、これが製造業建設業の雇用を必要とし、そのため刺激策が取られ一時的に経済を浮揚した。同様のことが2012年のハリケーンでも見られた。」
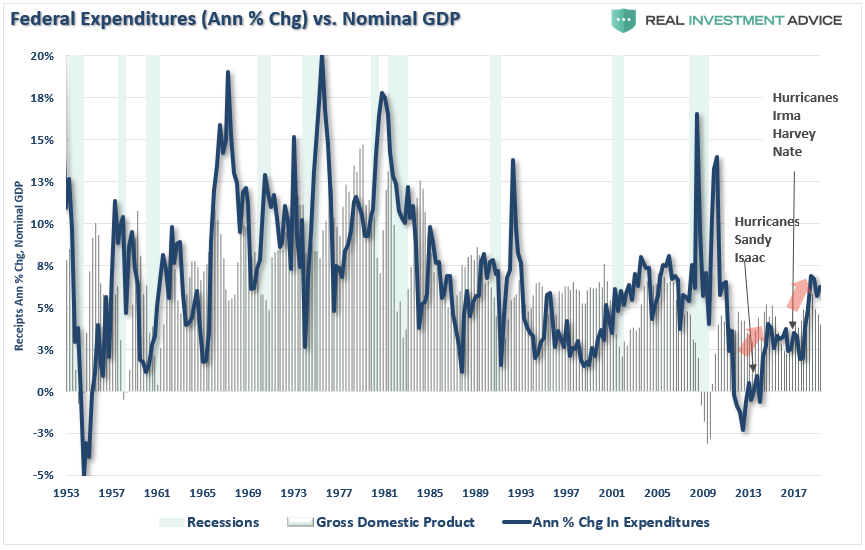
“These “sugar highs” are temporary in nature. The problem is the massive surge in unbridled deficit spending only provides a temporary illusion of economic growth.”
「このような「シュガーハイ」は一時的なものだ。問題は巨額の無制限赤字歳出は一時的に経済成長の幻影を生み出すだけだ。」
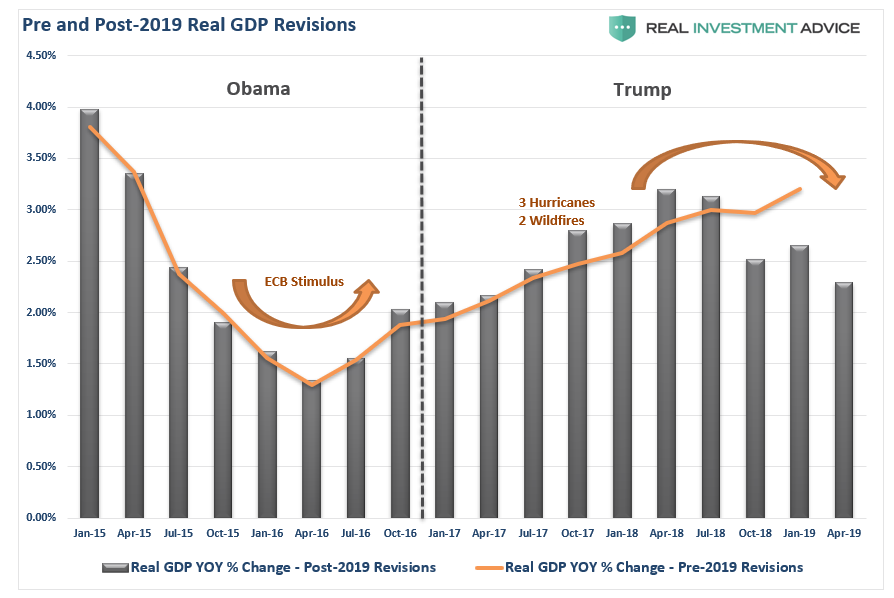
The importance is that economic “estimates” become skewed by these exogenous factors, and I have warned these over-estimations would be reversed when annual revisions are made.
大切なことは、「経済予想」がこのような外的要因で歪められるということだ、そして私が警告したが、このような過剰な刺激策は年次改定で反転するだろう。
Last week, the annual revisions to the economic data were indeed negative. The chart below shows “real GDP” pre- and post-revisions.
先週発表された経済データへの年次改定はたしかにマイナスだった。下のチャートに示すのは改定前後の「実GDP」の変化だ。
This outcome was something I discussed previously:
この結果は以前に私が議論したとおりだ:
“With the Fed Funds rate running at near 2%, if the Fed now believes such is close to a ‘neutral rate,’ it would suggest that expectations of economic growth will slow in the quarters ahead from nearly 6.0% in Q2 of 2018 to roughly 2.5% in 2019.”
「FFRは2%近くであり、もしFEDがいまこれを「中立金利」に近いと信じているなら、数四半期先の経済成長予想期待は緩やかなものになるだろう、2018Q2には6.0%近くだったがこれが2019には2.5%程度という具合だ。」
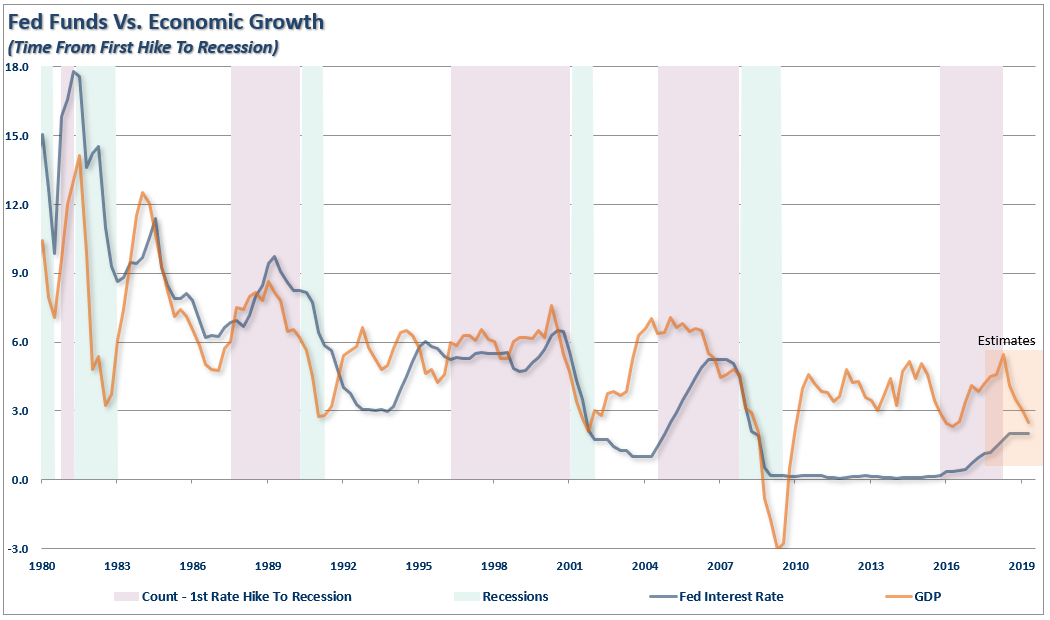
However, there is further evidence that actual, organic, economic growth is weaker than the current negative revisions suggest. More importantly, the revisions to the 2019 data, in 2020, will very likely be as negative as well.
This is also the case with the employment data which I discussed previously:
しかしながら、実際の自然経済成長は現在のマイナス改定が示唆するよりももっと弱いという多くの証拠がある。更に重要なことは、2019年のデータが2020に改定されるだろうが、これもまた同様にマイナス改定となるだろう。これはまた雇用統計についても言えることで、これまで私が議論してきたことだ。
“Months from now, the Establishment Survey will undergo its annual retrospective benchmark revision, based almost entirely on the Quarterly Census of Employment and Wages conducted by the Labor Department. That’s because the QCEW is not just a sample-based survey, but a census that counts jobs at every establishment, meaning that the data are definitive but take time to collect.”今後何ヶ月か立って、the Establishment Survey は毎年のベンチマーク改定を行うだろう、労働省の the Quarerly Census of Employment and Wages 全般についてだ。というのもQCEWは単にサンプル調査というだけでなく、それぞれの組織の雇用を調査したもので、信頼が置けるとは言えやがて修正される。
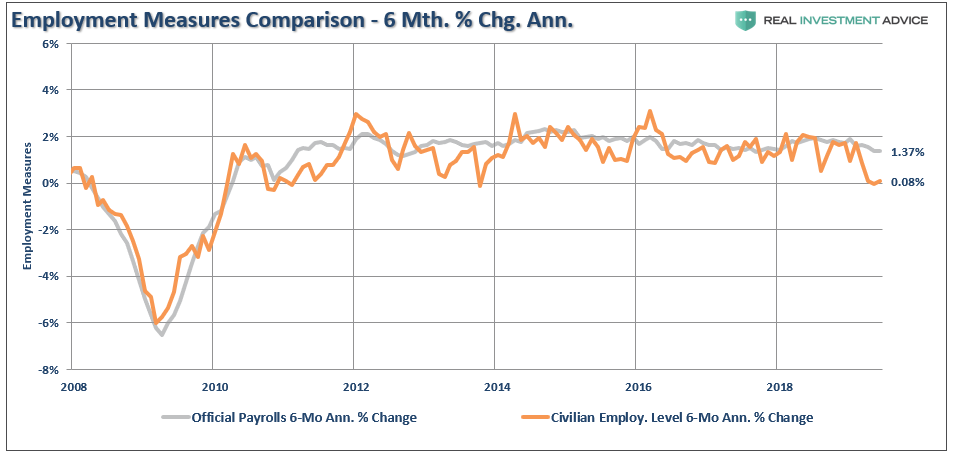
“The Establishment Survey’s nonfarm jobs figures will clearly be revised down as the QCEW data show job growth averaging only 177,000 a month in 2018. That means the Establishment Survey may be overstating the real numbers by more than 25%.”
「the Establishment Suveyの非農業雇用指数は明らかに下方修正されるだろう、QCEWデータを見ると雇用成長は201 8年平均でわずか177,000/月しかない。ということは the Establishment Survey は実数を25%以上過大計上しているかもしれない。」
There is nothing nefarious going on here.
ここには不正があるわけでは全くない。
It is the problem with collecting data from limited samples, applying various seasonal adjustment factors to it, and “guesstimating” what isn’t known. During expansions, the data is always overstated and during recessions it is understated. This is why using lagging economic data as a measure of certainty is always erroneous.
限られたサンプルからの集計という問題であり、各種季節調整が適用されている、そしてよくわからないことは「当てずっぽう」が採用されている。景気拡大期には、このデータはいつも水増し誇張され、景気後退期には控えめで地味な数字になる。このようにして経済データはいつも時間遅れがあり、正確さに欠くものとなる。
Debt-Driven Growth
債務による経済成長
私が最近こういうタイトルで議論した「財政保守派の死」、ワシントン議会は新たな歳出法案を通過させた。
“In 2018, the Federal Government spent $4.48 Trillion, which was equivalent to 22% of the nation’s entire nominal GDP. Of that total spending, ONLY $3.5 Trillion was financed by Federal revenues, and $986 billion was financed through debt.
In other words, if 75% of all expenditures is social welfare and interest on the debt, those payments required $3.36 Trillion of the $3.5 Trillion (or 96%) of revenue coming in.”
「2018年に、連邦政府のさいhすつは$4.48Tだった、この額は名目GDPの22%になる。全歳出の内わずか$3.5Tが連邦政府歳入で賄われており、$986Bは借金によるものだった。
言い換えると、全歳出の75%が社会福祉と借金の利払いなら、$3.5Tの歳入の内、(96%が)これらの歳出が$3.36Tにもなる。」
The “good news” is, if you want to call it that, is that Government spending does show up in economic growth. The “bad news” is that government spending has a negative “multiplier” effect since the bulk of all spending goes to non-productive investments. (Read this)
「good news」として捉えるなら、もし皆さんがこう呼ぶことを望むなら、政府支出が経済成長を促進している。「bad news」と捉えるなら、政府支出は「マイナス乗数効果」を生み出している、というのもこれらの支出はどれも非生産的な投資だからだ。
Nonetheless, the President suggests we are “winning.”
言うまでもなく、大統領は我々は「勝利を収めている」と示唆している。
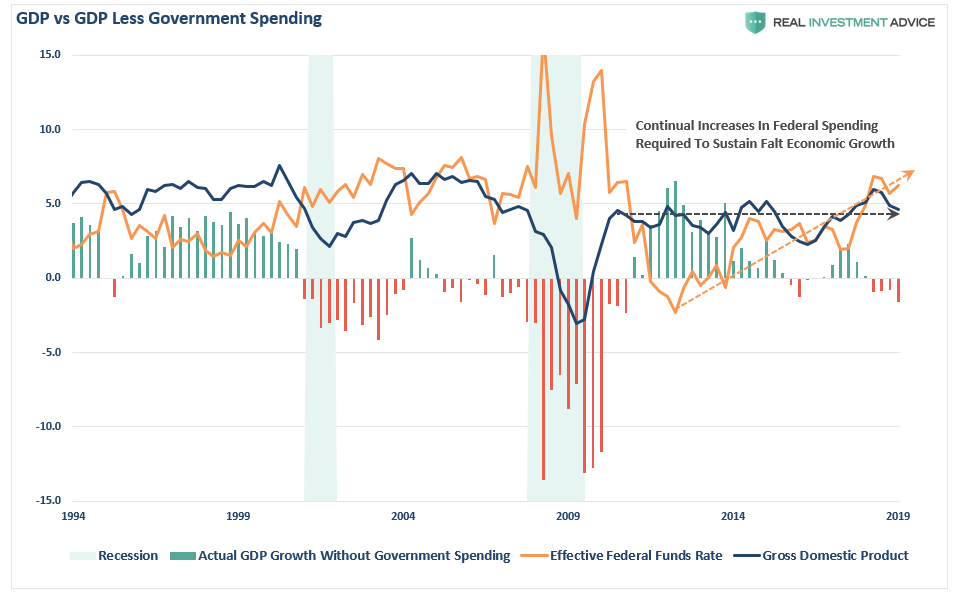
問題はこういうことだ、政府歳出よりも低い経済成長ということは実際には「景気後退」だろう。
As shown in the chart below, since 2010 it has taken continually increases in Federal expenditures just to maintain economic growth at the same level it was nearly a decade ago. Such a “fiscal feat” is hardly indicative of “winning.”
下のチャートに示すが、2010年以来、継続して連邦政府歳出は増えており、約10年前の経済成長レベルを維持してる。こういう「財政救済」をもってして「勝利」とはほど遠いだろう。
As Mike Shedlock noted, part of the issue with current economic estimates is simply in how it is calculated.
Mike Shedlockが記すように、現在の経済状況を評価する問題の一部は、単にどのように計算するかによる。
In GDP accounting, consumption is the largest component. Naturally, it is not possible to consume oneself to prosperity. The ability to consume more is the result of growing prosperity, not its cause. But this is the kind of deranged economic reasoning that is par for the course for today.
GDP算出にあたり、消費が最大要因だ。当然のことながら、 タコ足を食って成長できるはずがない。消費が増えるということは成長の結果だ、原因であるはずが無い。しかし現在では在る種倒錯状態の経済要因となっている。
In addition to what Tenebrarum states, please note that government transfer payments including Medicaid, Medicare, disability payments, and SNAP (previously called food stamps), all contribute to GDP.
まるで毎朝のお勤めのようなことに加えて、これも覚えておいてほしい、政府は無償給付もしている、Medicaid、Medicare(高齢者、困窮者向け無料医療サービス)、障害者給付、そしてSNAP(以前はフードスタンプと呼ばれていた生活保護)、これもすべてGDPに組み込まれている。
Nothing is “produced” by those transfer payments. They are not even funded. As a result, national debt rises every year. And that debt adds to GDP.”
これらの無償給付ではなにも「生産的」なことは起きない。これらの歳出には資金裏付けもない。結果として、国家債務は毎年増え続ける。そしてその債務支出がGDPを増やす。」
This is critically important to understand.
このことは理解すべきとても重要なことだ。
While government spending, a function of continually increasing debt, does appear to have an economic benefit, corporate profits tell a very different story.
増え続ける債務による政府歳出は経済的恩恵を生み出すが、企業収益とは全く関係ない。
The Real Economy
真の経済
「営業収益」(もしくは「収益ファンタジー」)と会計企業収益の乖離について私はしばらく記事を書き続けていた、会計企業収益は実際の納税のために必要となる。「収益成長は喧伝されているよりももっと弱い」という記事でこう書いた:
“The benefit of a reduction in tax rates is extremely short-lived since we compare earnings and profit growth on a year-over-year basis.
In the U.S., the story remains much the same as near-term economic growth has been driven by artificial stimulus, government spending, and fiscal policy which provides an illusion of prosperity.”
「減税効果というのは極端に短命だ、というのも我々は企業収益成長をYoYで比較するからだ。米国においては、短期的な経済成長に重きをおかれ、その多くは、人工的な刺激策、政府支出、そして財政政策で生み出されている、これが繁栄の幻想を生み出している。」
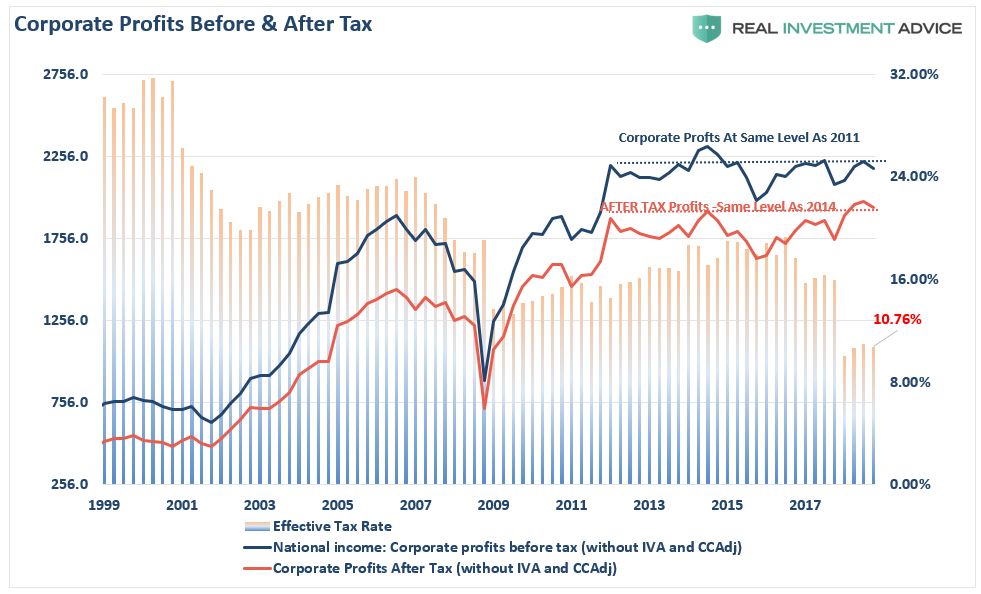
Since consumption makes up roughly 70% of the economy, then corporate profits pre-tax profits should be growing if the economy was indeed growing substantially above 2%.”経済の70%は消費から成り立っているため、もし経済が2%を超えて成長しているなら、税引前企業成長もそれに沿うはずだ。」
We now know the economy wasn’t growing well above 2% and, as a consequence, corporate profits have been revised sharply lower on a pre-tax basis.
いまや経済が2%を超えて成長などしていないことを我々は承知している、その結果として、税引前企業収益は急速に下方修正されてきた。
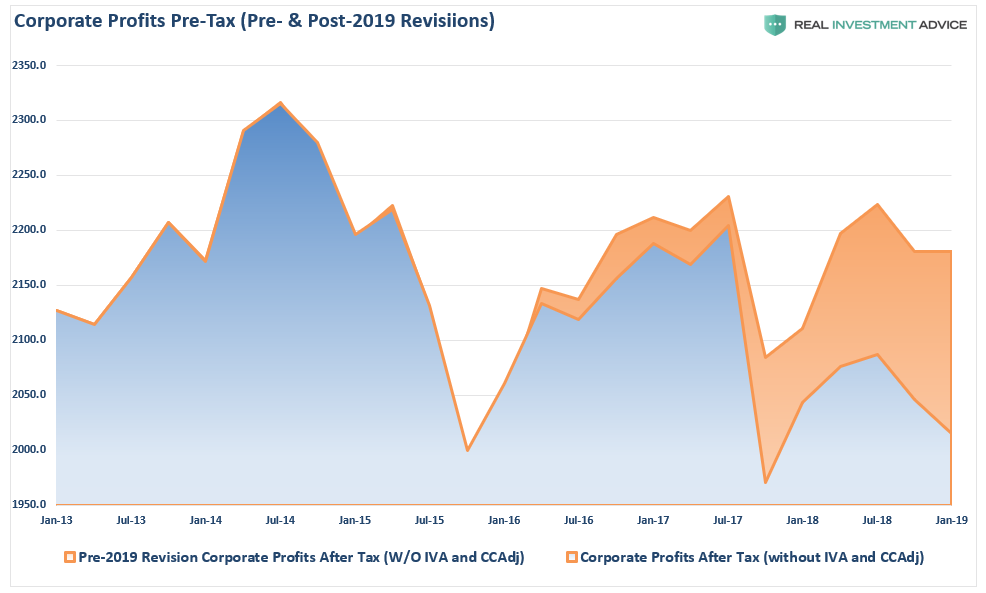
The reason we are looking at PRE-tax, rather than post-tax, profits is because we can see more clearly what is actually happening at the corporate level.
税引き後ではなく税引前収益に注目する理由は、企業で実際に何が起きているかを見極めることができるからだ。
Since corporate revenues come for the sale of goods and services, if the economy was growing strongly then corporate profits should be reflective of that. However, since 2014, profits have actually been declining. If we take the first chart above and adjust it for the 2019-revisions we find that corporate profits(both pre- and post-tax) are the same level as in 2012 and have been declining for the last three-years in particular.
企業売上というのは物やサービスの販売から得られる、もし経済成長が力強く成長しているなら、企業収益はこれを反映するはずだ。しかしながら、2014年以来、収益は実際に下落している。上の最初のチャートをみて、それを2019改定で調整すると築くことだが、企業収益(税引前と税引き後ともに)は2012と同等レベルであり、特に直近3年は下落傾向だ。
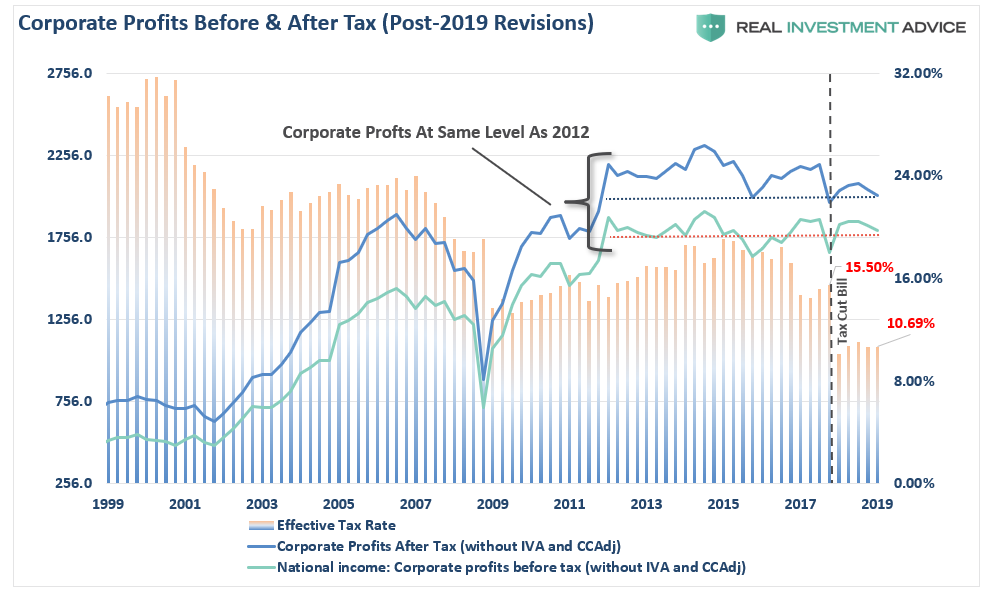
Again, this hardly indicates the “strongest economy in history.”
繰り返すが、「史上最強の経済」とはとても言えない。
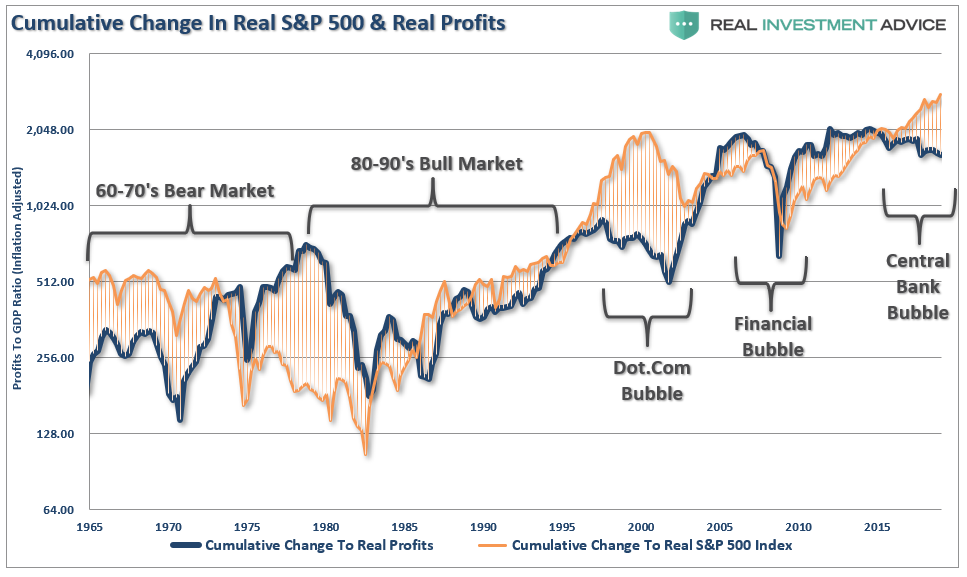
These negative revisions to corporate profits also highlight the over-valuation investors are currently paying for asset prices. Historically, such premiums have had rather horrific “paybacks” as markets eventually “reprice” for reality.
企業収益に対するこれらの下方修正を見ると、投資家が現在の株価で支払っている過剰バリュエーションが明らかになる。歴史的に見て、このような株価プレミアムは「恐ろしい見返り」をうけるものだ、やがて現実に相応した「株価見直しに」遭遇する。
Trump’s Political Risk
トランプの政策リスク
メディアはその時時の経済の強さ弱さをホワイトハウスの主のせいにするが、しかしながら現実は全く異なるものだ。
Most fiscal, and monetary, policy changes can take up to a year before the impact shows in the economic data. While changes to “tax rates” can have a more immediate impact, “interest rate” changes take longer to filter through.
ほとんどの財政・金融政策変更は経済データに反映する一年以上前に変わっている。「税率変更」は即効性があるが、「金利変化」が効果を及ぼすには長い時間を要する。
The political risk for President Trump is taking too much credit for an economic cycle which was already well into recovery before he took office. Rather than touting the economic numbers and taking credit for liquidity-driven financial markets, he should be using that strength to begin the process of returning the country to a path of fiscal discipline rather than a “drunken binge” of spending.
トランプ大統領の政治的リスクは、彼が大統領になる随分と前にすでに景気サイクルは回復しており、その状況で多大な与信を与えたことだ。経済指標を自慢したり、金融市場に流動性を追加するよりも、彼はその経済の強さでこの国の財政規律を回復することに利用すべきだった、消費の「どんちゃん騒ぎ」ではなく財政規律を取り戻すべきだった。
With the economy, and the financial markets, sporting the longest-duration in history, simple logic should suggest time is running out.
経済や金融市場は史上最長の繁栄を謳歌している、単純に考えてもう時間がなくなろうとしている。
This isn’t doom and gloom, it is just a fact.
将来に希望が持てないわけではない、これは事実だ。
Politicians, over the last decade, failed to use $33 trillion in liquidity injections, near zero interest rates, and surging asset prices to refinance the welfare system, balance the budget, and build surpluses for the next downturn.
政治屋たちはこの10年愚かにも$33Tの流動性を注入とさらにゼロ金利を進めた、そして株価急騰と福祉プログラムへの大盤振る舞い、予算膨張、次の下落のもととなる行き過ぎ。
Instead, they only made the deficits worse and the U.S. economy will enter the next recession pushing a $2 Trillion deficit, $24 Trillion in debt, and a $6 Trillion pension gap which will devastate many in their retirement years.
While Donald Trump talked about “Yellen’s big fat ugly bubble” before he took office, he has now pegged the success of his entire Presidency on the stock market.
そうではなく、彼らがつ切り上げたのは、財政赤字の悪化、そして$2Tの赤字の中で次の景気後退を迎える、連邦債務は$24Tにも膨れ上がっている、そして年金基金不足は$6Tもあり、多くの人の引退後の生活をひどいものにするだろう。ドナルド・トランプは政権に付く前は「Yellenの誤政策で見にくいバブルを生み出した」と言っていたが、その彼が今や自らの大統領としての成功を株式市場にだけ限定している。
It will likely be something he eventually regrets.
やがて彼も後悔するだろう。(訳注:財政悪化が顕在化するときには私はすでに大統領職にいないだろう、とトランプはインタビューで答えています。このあたりが凡人ではない。:) )
“Then said Jesus unto him, Put up again thy sword into his place: for all they that take the sword shall perish with the sword.” – Matthew 26, 26:52
「イエスは剣を鞘に納めるように告げた:剣を用いたものはその剣の報いを受ける。」ーーマタイ伝26, 26:52

