Authored by Kevin Ludolph via Crescat Capital, Dear Investors: The US stock market is retesting its all-time highs at record valuations yet again. We strongly believe it is poised to fail.
The problem for bullish late-cycle momentum investors trying to play a
breakout to new highs here is the oncoming freight train of
deteriorating macro-economic conditions.
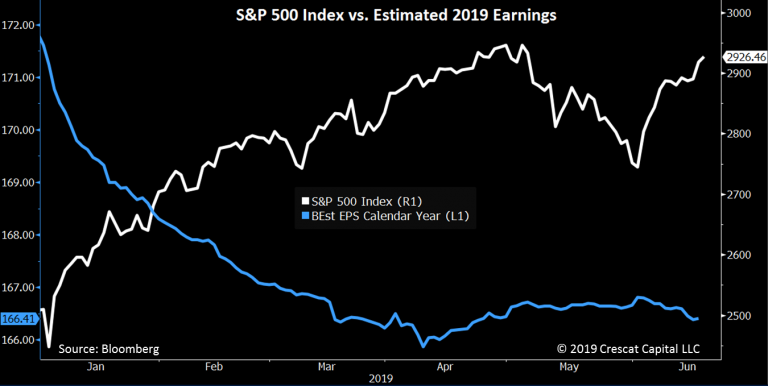
US corporate profit growth, year-over-year, for the S&P
500 already fully evaporated in the first quarter of 2019 and is heading
toward outright decline for the full year based on earnings estimate
revision trends. Note the alligator jaws divergence in the
chart below between the S&P 500 and its underlying expected earnings
for 2019. Expected earnings for 2019 already trended down sharply in
the first quarter and have started trending down again after the May
trade war escalation.
The NY Fed’s Empire State manufacturing survey of general business
conditions just came out Monday registering the steepest ever monthly
decline in the history of the series going back to 2001. The data was
confirmed by a substantial disappointment in the Philly Fed Business
Outlook survey which came out today. These surveys bode extremely ill
for the more widely watched ISM Manufacturing PMI that will come out
July 1 and could easily move into recessionary territory.
Investors at
large are looking at the glass half full by bidding up stocks on the
news of Fed rate cuts to come. Late in the business cycle, history
proves that it is much more important to pay attention to the reality of
deteriorating economic data than the hope of Fed stimulus. Fed easing
late in the cycle has never been bullish. At record valuations today with ailing macro data, it is extremely bearish. NY FED Empire State 製造業ビジネス環境調査がちょうど月曜に開示されたが、2001年まで逆上ってもっとも大きな月次急落だった。このデータは今日開示されたPhilly FED Business Outlook調査でも確認された。これらのデータの悪化はもっと広範囲の調査である7月1日開示のISM 製造業PMIの悪化を予兆させる、簡単に景気後退領域の可能性もある。多くの投資家はFED金利引き下げが来るという期待で株式が上昇していることで、コップのミルクは半分満たされると見ている。景気拡大サイクルの終盤であり、歴史が教えるのは、経済悪化の現実に目を向けることであり、FEDの刺激策に期待することではない。景気拡大終盤におけるFED緩和策が強気相場を引き起こしたことは決して無い。現在は記録的なバリエーションであり、マクロデータは悪化している、これは極端に弱気なものだ。
At Crescat, we believe the US stock market is on the precipice of a
likely severe bear market and global economic recession. Short
opportunities abound across the globe which we are positioned for in our
hedge funds across multiple macro themes. Our shorts delivered strong
performance in our hedge funds in May as they did in the fourth quarter
last year. We believe this is just a taste of what is to come. See our
May performance at the end of this letter. Meanwhile, on the long side
of our portfolios, the outlook for precious metals is extremely
favorable today. Our long-only Large Cap strategy is heavily skewed
toward gold and silver mining companies. Precious metals have been
particularly strong month to date in June and are soaring after
yesterday’s dovish Fed FOMC release benefitting all our strategies.
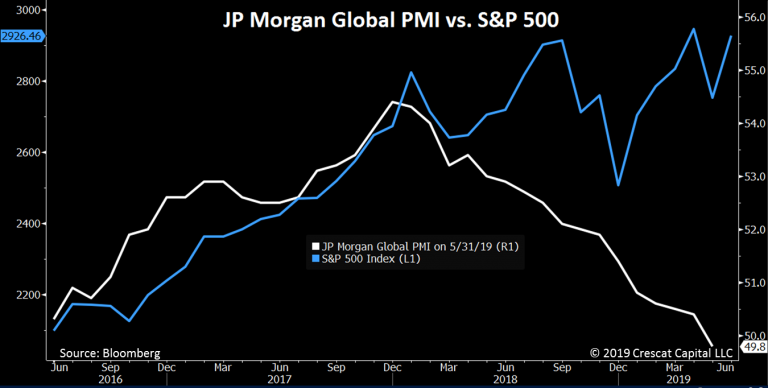
Not just US, but global economic conditions have been deteriorating rapidly in 2019. We
now have about 60% of countries with purchasing manager indices below
50 according to Morgan Stanley research, indicating that the world is
tipping into recession. Similarly, after a steady decline since January
2018, JP Morgan’s Global Manufacturing PMI dropped below 50 in May,
indicating a global recession may have just begun. In the chart below we
can again see another alligator mouth divergence between this index and
the S&P 500. It will not surprise us to see these jaws snap shut
with a severe stock market decline.
米国のみならず、世界経済環境は2019年に急速に悪化している。モルガン・スタンレーの調査では世界の60%の国でPMIのが50を切っている、ということは世界中が景気後退に向かっている。同様に、2018年1月以来ずっとJP Morgan's Global Manufacturing PMIは下落しており、5月に50を切った、ということはすでに世界的景気後退はすでに始まっているのかもしれない。下のチャートでもまた鰐の口が見える、この世界PMIとS&P500の乖離だ。株式市場の深刻な下落でこの顎が閉じるのを見ても私どもは驚きはしないだろう。
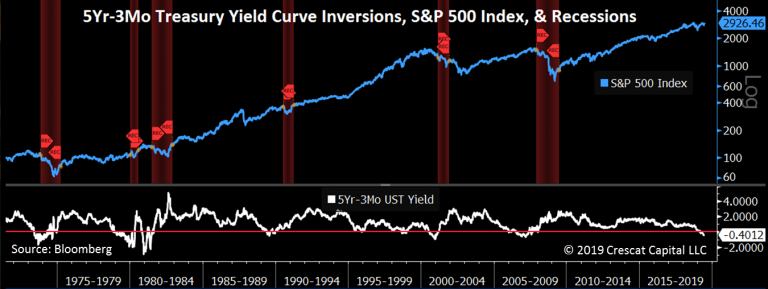
Today’s yield curve inversions are perhaps the most foreboding macro indicators that we follow.
In the US, we are particularly interested in the inversion of the
5-year vs. 3-month Treasury yield spread based on the work of Campbell
R. Harvey, a finance professor at Duke University’s Fuqua School of
Business. Harvey premised in his 1986 PhD dissertation at the University
of Chicago that when either the 5-year or 10-year Treasury yield
inverted vs. 90-day T-bills, a recession followed within 12-18 months.
At that time, his research relied on only three occurrences. Since then,
this indicator worked “out of sample” three times for a perfect track
record in the last six recessions. The 5-year vs. 3-month yield has been
inverted for over 100 days now and is signaling an oncoming recession!
In the chart below, we have shaded the recessions that followed all
six of these past 90-day+ inversions. We also show the S&P 500
Index. Note the brutal bear market for stocks in 1973-1974, 2000-2002,
and 2007-2009 that flowed directly from these inversions. These bear
markets began significantly ahead of the acknowledgement of these
recessions. The world at large is always in denial in the early stages of a bear market. We think that is the same set up today. 下のチャートに示すが、過去6回の90日以上のイールド反転とその後の景気後退を示す。同時にS&P500も示している。1973−1974,2000−2002,そして2007−2009の深刻なベア相場はこれらの反転直後に生じている。これらのベア相場は景気後退になる随分前から始まっていた。いつもの事だが、ベア相場の初期にはいつも否定される。私どもはこれと同じことが今起きていると見ている。
Cam Harvey recommends, like Crescat, using multiple confirming macro
indicators to forecast a recession. In Harvey’s case, he sees “four horsemen of the apocalypse” all lining up right now: (1)
declining CFO confidence; (2) anti-growth protectionism; (3) market
volatility; and (4) the 5-year vs. 3-month Treasury yield curve
inversion. At Crescat, we have identified something closer to
twenty-five macro timing signals in our recent research letters. The
5-Yr vs. 3-Mo. inversion is just one of them.
With debt imbalances at historic levels globally today across government, household, and business sectors, there is a strong potential for a particularly brutal world-wide financial downturn.
We have also already shown a plethora of yield curve inversions both in
the US and globally, not just the US 5-Yr vs. 3- Mo. Historically,
these have all been reliable macro warning signals of oncoming
recession. The number of these yield curve inversions has continued to
creep up globally. Based on Tavi Costa’s work here at Crescat, a record
16 countries now have 30-year bonds yielding less than LIBOR overnight
rates, an extreme inverted “global” yield curve just like the one the
preceded the last two global recessions. Also based on Tavi’s work, the
percentage of yield curve inversions within select at-risk countries is
daunting: Hong Kong (79%), Canada (69%), US (57%), and Australia (42%).
現在、世界的に債務が以上に大きい、政府、家計、そして企業部門でだ、そこで特にひどい世界的金融危機の強い可能性がある。私どもはすでに米国、世界での大きなイールドカーブ反転を示してきた、単に米国5Y vs. 3Mだけというわけではない。歴史的に見て、景気後退到来の信頼できるマクロ警告シグナルだ。イールドカーブ反転の数は引き続き世界的に増えている。Crescat社のTavi Costaの研究では、今や16カ国もで30年もの債権金利がLIBOR一夜モノよりも低くなっている、過去二回の世界的景気後退と同様に「世界的」に極端なイールドカーブ反転が生じている。そしてまたTaviの研究成果だが、リスクの高い国々でのイールドカーブ反転割合はすごいものだ:香港(79%)、カナダ(69%)、米国(57%)そしてオーストラリア(42%)。
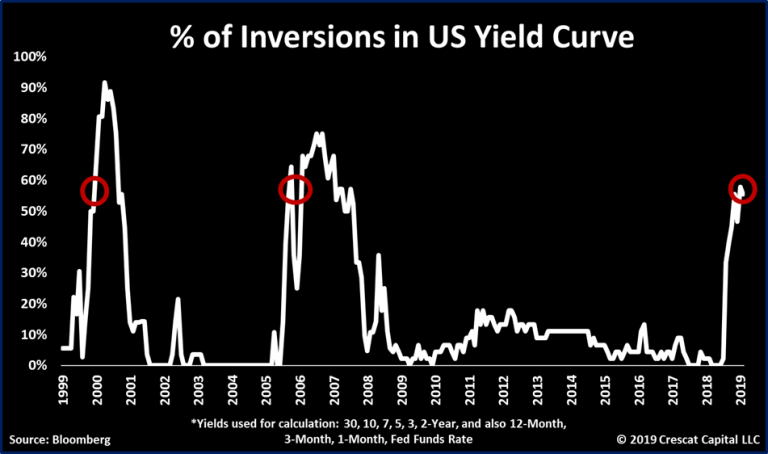
The following chart continues to be one of our strongest
yield-curve arguments for our bearish outlook and positioning in the US.
In it, we calculate the percentage of negative spreads in the
US yield curve. It measures all 44 possible combinations of yield
spreads from overnight to 30-year interest rates. We now see the US with
almost 60% of its yield curve inverted, just as high as it was directly
ahead of the tech bust and global financial crisis!
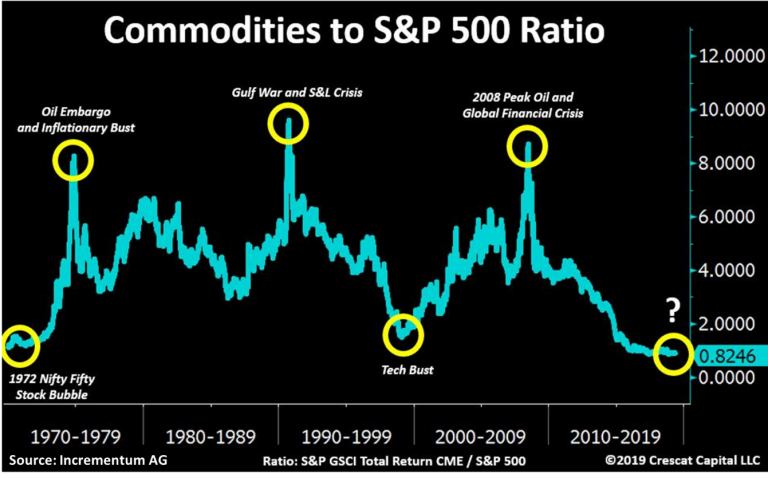
The commodities-to-S&P 500 ratio just reached a fresh 50-year low. The chart below was first published by Incrementum AG and does an incredible job of presenting the historic US equity bubble. It’s yet another reason for why US stocks look absurdly overvalued at the likely top of the business cycle.
コモディティ対S&P500比率はちょうど50年ぶりの低位になった。下のチャートはInvrementum AGが最初に開示したものだ、驚くほどに過去の米国株式バブルと合致している。これを見ても米国株式市場は驚くほどに過剰評価されており、景気サイクルの天井にあることがわかる。
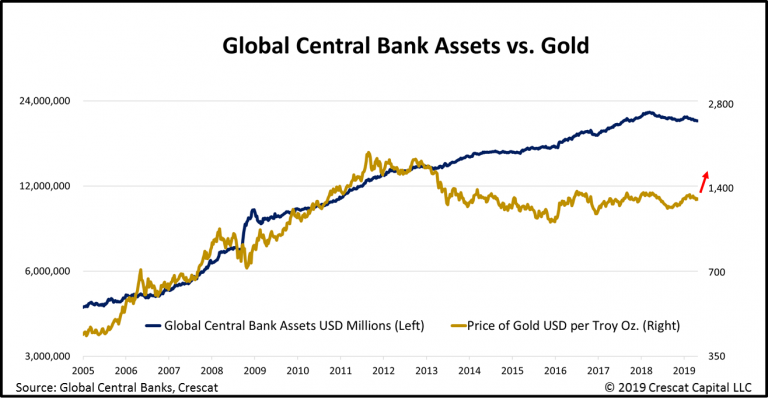
With respect to the numerator part of this imbalance, we are
incredibly bullish today on precious metals commodities. We believe gold
is historically undervalued relative to the global fiat monetary base
as shown in the chart below. Look at the target price for gold in this
macro chart! It is almost double today’s prices. Gold is the longest
running and most widely held global central-bank reserve currency. In the long run, it should follow the level of global fiat money printing and has a lot of catching up to do. この不均衡の分子側に注目すると、私どもは現在貴金属にとても強気だ。私どもは歴史的に見てゴールドは管理通貨に対して過小評価状態と見ている、下のチャートを見るが良い。このマクロチャートからするゴールド目標価格を見るが良い!現在の市況の倍だ。ゴールドは人類史上もっとも長期に渡り価値を認められており、そして世界の中央銀行が広く準備通貨として持っている。長期的に見ると、ゴールドは世界的管理通貨発行量を追いかけるはずで、それに追いつくのは容易ではない。
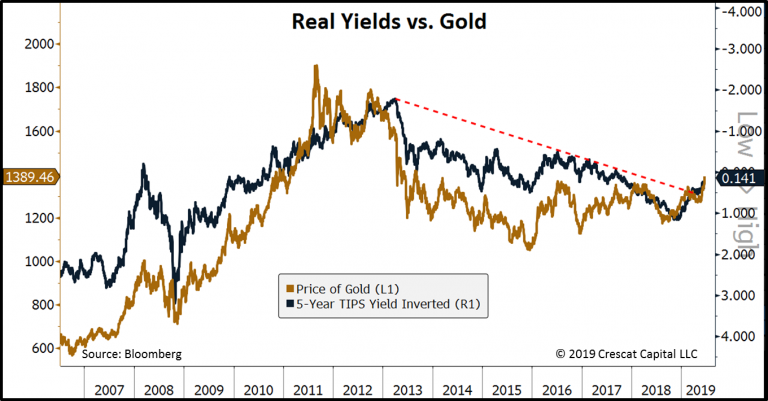
The problem is that the money printing in the past decade has yet to
translate into rapidly increasing inflation. Therefore, gold has been in
a 7-year bear market as real interest rates were rising as shown in the
chart below. In the short run, gold tracks the inverse path of real
interest rates. The exciting news for gold bulls today is that the real interest rate trend has finally reversed. With
the recent fall in US nominal interest rates, at a greater rate than
inflation, we are seeing a significant breakdown in real yields.
Given our macro views, we believe US short-term yields are likely to continue to move significantly lower as global economic conditions deteriorate,
and central banks are forced to ease. Declining real yields give strong
macro support for a substantial new precious metals bull market, even
before inflation ultimately rears its head.
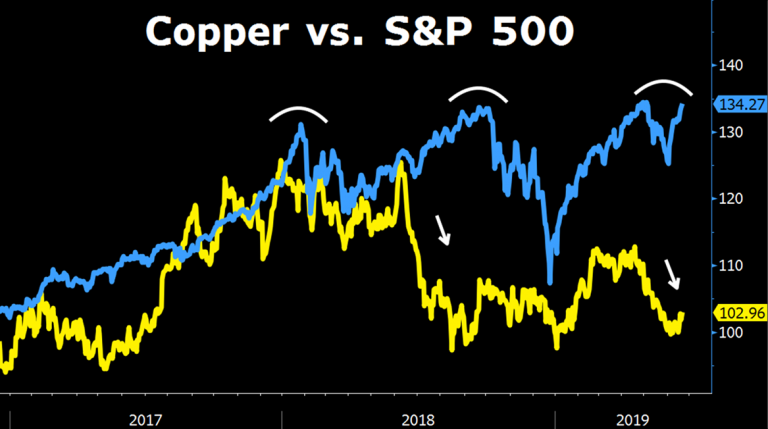
We now see bellwether commodities starting to diverge significantly
from equity markets. Some of these moves resemble those that preceded
the last market selloff in the fourth quarter of 2018. Copper is one of
them. The industrial metal first peaked in late 2017, only a few months
before stocks crashed in January of 2018. Then, copper re-tested its
highs in June of the same year and crashed a few months ahead of one of
the worst quarterly selloffs in the history of equity markets. Today, we
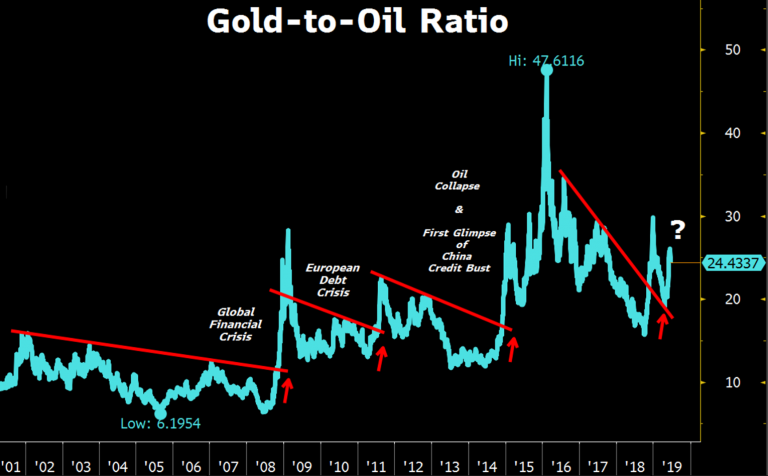
are seeing a similar divergence. Copper prices have already declined close to 10% since April 17th while the S&P 500 is retesting its all-time highs. 我々が今目の当たりにしている警告とは、コモディティが株式市場と大きく乖離し始めているというとこだ。この状況は2018Q4の市場下落の前に見られたことによく似ている。例えば銅もそのうちの一つだ。工業に利用される金属は当初2017年遅くに天井を打った、2018年1月株式暴落の数ヶ月前のことだ。その後、銅は再度この年の6月に高値を試し数カ月後に急落した、株式市場の歴史で最悪の四半期下落を迎える数か月前のことだ。今また、私達は同様の乖離を目の当たりにしている。銅価格は4月17日からすでに10%下落した、一方でS&P500は過去最高を再度試している。 The second important move to note was on gold prices. The
precious metal has been on an uptrend since the end of April. That
coupled with the recent decline in oil prices of over 22% is very
telling. A significant rise in gold-to-oil ratio tends to precede
critical junctures in equity markets and the global economy. We
experienced a similar breakout in the global financial crisis, in the
European debt crisis, at the first glimpse of the China bust in 2015,
and at the early stages of the market selloff in November of 2018. After
surging ahead of the G-20 meeting in Argentina we are now seeing a
similar move ahead of the same meeting but this time taking place in
Japan.
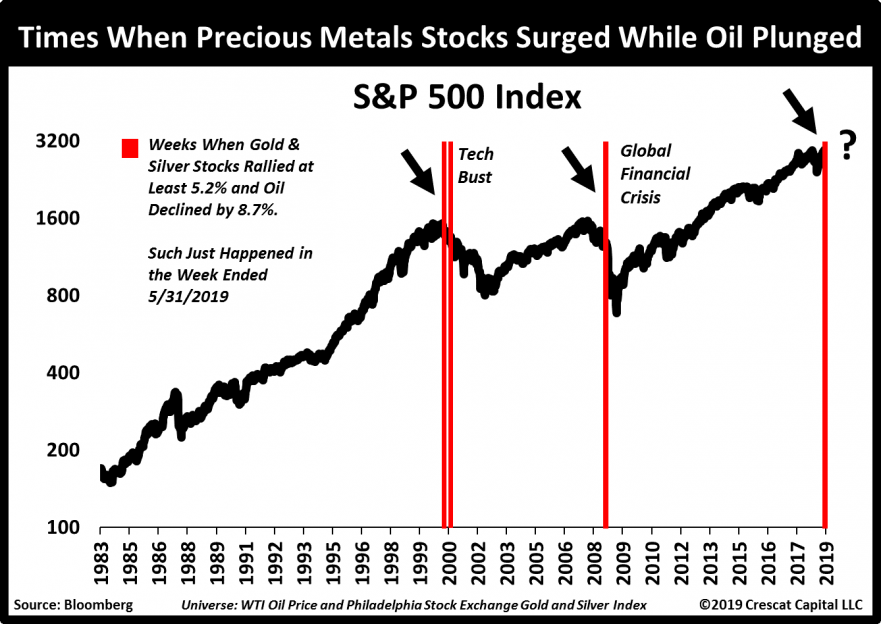
About 3 weeks ago, WTI crude prices had one of their worst weekly
declines in the existence of the contract. Meanwhile, precious metals
stocks rallied by over 5% during the same week. Such moves only happened
three other times in history. As shown on the red highlights on the chart below, all of them during coincided with severe bear markets and recession. For us, this, along with multiple other macro signals we have published in previous letters, just adds to our bearish views.
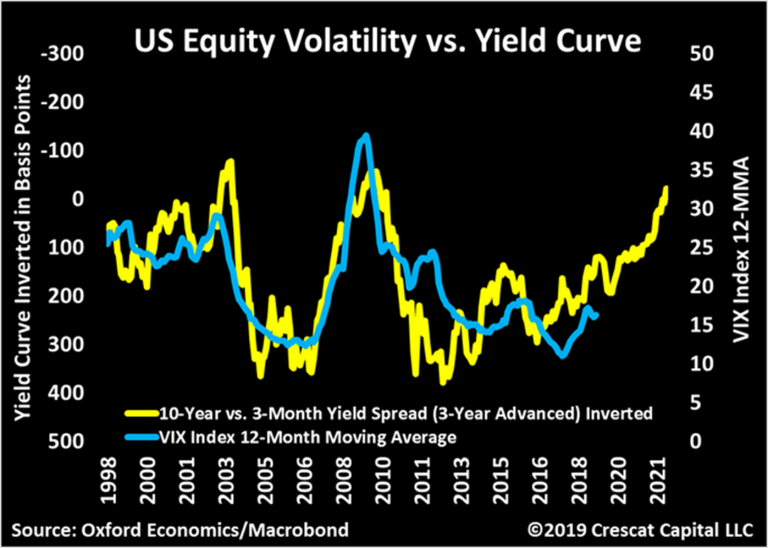
Another way of looking at yield curve inversions is to track them as a
leading indicator versus equity volatility. Note how closely volatility
follows yield inversions with a lag. Rising equity volatility, with a recent trend of higher lows, is one of Cam Harvey’s horsemen of the apocalypse.
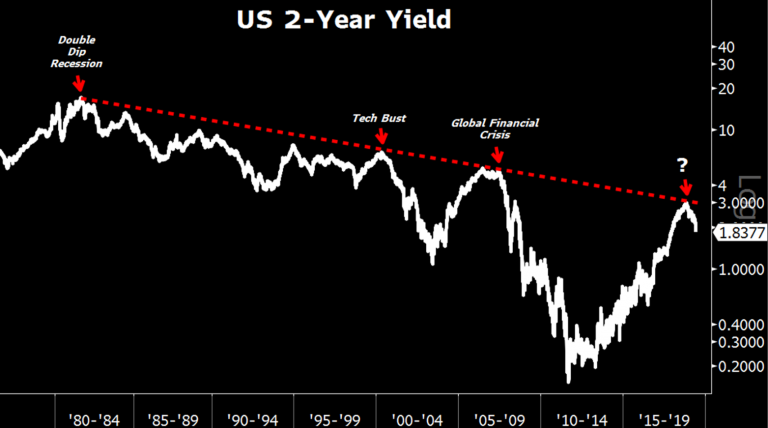
The year-to-date rally in US stocks has been completely rejected by
2-year yields which has been on a non-stop decline since November of
2018. One of them will be proven right. The shift to easy
monetary policy late in the business cycle when telegraphed by a plunge
in the 2-year yield has ultimately always been very bearish. 年初来の米国株ラリーの一方で、2年もの金利は2018年11月から単調に下落している。どちらの動きが正しいかはこれから判明するだろう。景気拡大サイクルの終盤における金融緩和政策へのシフトは、2年もの金利の下落で確認できるが、これは常に極端に弱気なものだ。 The market topping process has been drawn out, but the economic expansion is extremely aged.
Meanwhile, we have the mother of all currency and credit bubbles in
China, formerly the world’s economic growth juggernaut, now leading a
globally contagious economic downturn. Last month, China just reported
its biggest year-over-year deceleration in industrial production in 17
years. Auto sales in China have been in a recession-signaling downtrend
already for the past year. With anti-China extradition protests in Hong
Kong, capital flight pressures, and ongoing trade war tensions, China’s
economy continues to face extreme downward pressure. We continue to
maintain an asymmetric short position in China and Hong Kong currencies
through laddered put options in our global macro fund which performed
well for us in May.
We strive for high risk-adjusted outperformance versus our benchmarks
through both macro theme identification and individual security
selection based on Crescat models. The bulk of the underlying
macro exposure in our global macro hedge fund continues to be explained
by this one chart that we refer to today as the macro trade of the
century...
私どもは最大限のリスク調整をしながら設定するベンチマークを上回ってきた、その際にマクロテーマの設定とCrescatモデルに基づく個別銘柄選びを利用してきた。私どものグローバルマクロヘッジファンドの露出は引き続き下の一枚のチャートで説明されるものだ、私どもは現在のマクロトレードを100年に一度のチャンスと捉えている・・・
How Are Gold And Money Supply Related? by Tyler Durden Sun, 06/14/2020 - 13:00 Authored by Mike Shedlock via MishTalk, M2 Money Supply is surging. Will gold follow? M2マネーサプライが急増している。ゴールドはこれを追従するだろうか? Let's investigate an alleged relationship between gold and M2, a measure of money supply in the US. よく言われるM2(米国のマネーサプライ指標)とゴールドの関係について調べてみよう。 "There’s a clear correlation between the annual growth rate in M2 money supply and the price of the yellow metal. " 「M2の年率増加速度とゴールド価格の間には明らかな相関がある。」 Clear Correlation? 明らかな相関? The Tweet claims something different than my lead chart depicts. So let's investigate the above idea in other time frames. このツイートの主張は私が示す最初のチャートが示すものとは異なる。というわけでこのtweetの主張を別の時間フレームで見てみよう。 Gold vs Rate of Change in M2 Money Supply ゴールド vs M2マネーサプライの変化率 If we look at longer time frames, the rate of increase in M2 theory falls flat on its face....