Authored by Jesse Colombo via RealInvestmentAdvice.com,
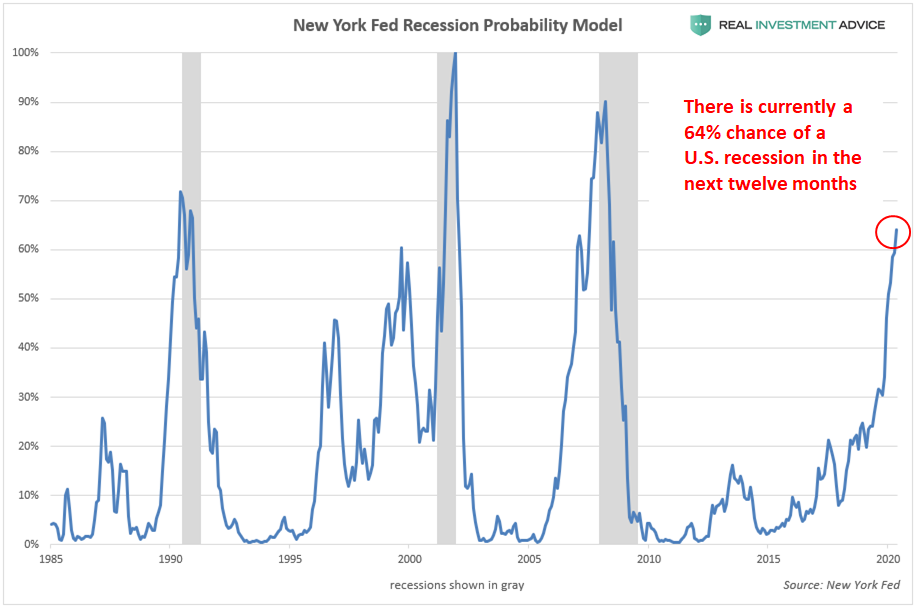
As the probability of a U.S. recession in the next year grows rapidly (it
may be as high as 64%), many bullish economists and financial
commentators are unsurprisingly downplaying this risk. One of their main
arguments is that interest rates have not been hiked aggressively
enough to tip the economy over into a recession. While it is true that
U.S. interest rates are still very low by historic standards, the reality is that rates do not have to rise anywhere near as high as
they did in the past to cause recessions due to America’s debt load
that has grown dramatically over the past several decades. 来年の米国景気後退入り可能性は急速に増しているなかで(可能性は64%)、多くの強気はエコノミストや金融コメンテーターは驚くことにこのリスクを過小評価している。彼らが主に主張することの一つが金利は積極的に引き上げられておらず景気後退を引き起こすほどのレベルではない、というものだ。歴史的に見て米国金利ははまだとても低いのは確かだが、現実には、過去に景気後退を引き起こしたレベルまで金利を引き上げることができないというのが本当のところだ、というのもここ数十年米国の債務負荷が劇的に増えたためだ。
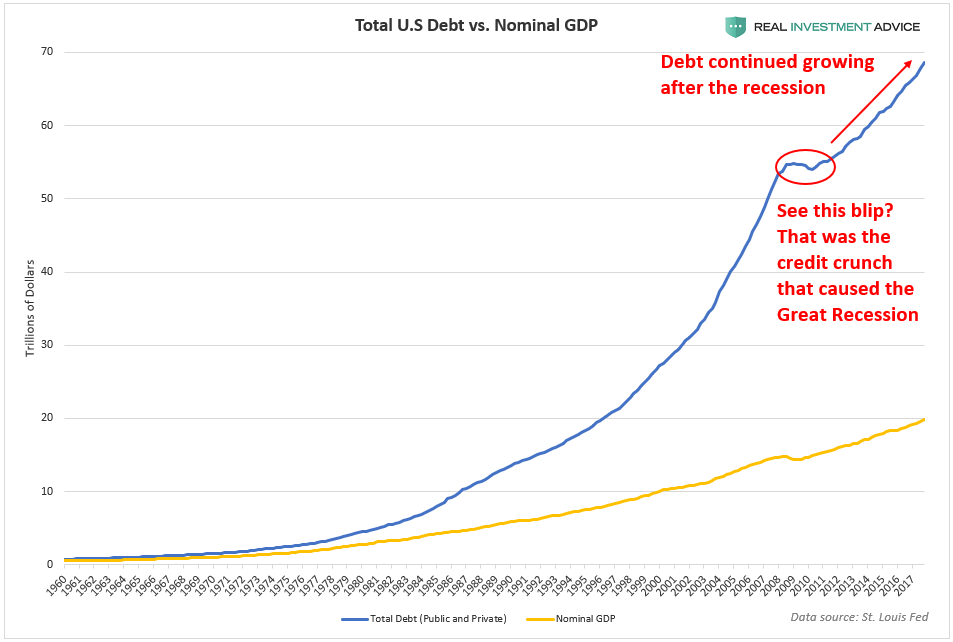
Since the early-1980s, total U.S. debt – both public and private –
has been growing at a faster rate than the underlying economy, as
measured by the nominal GDP:
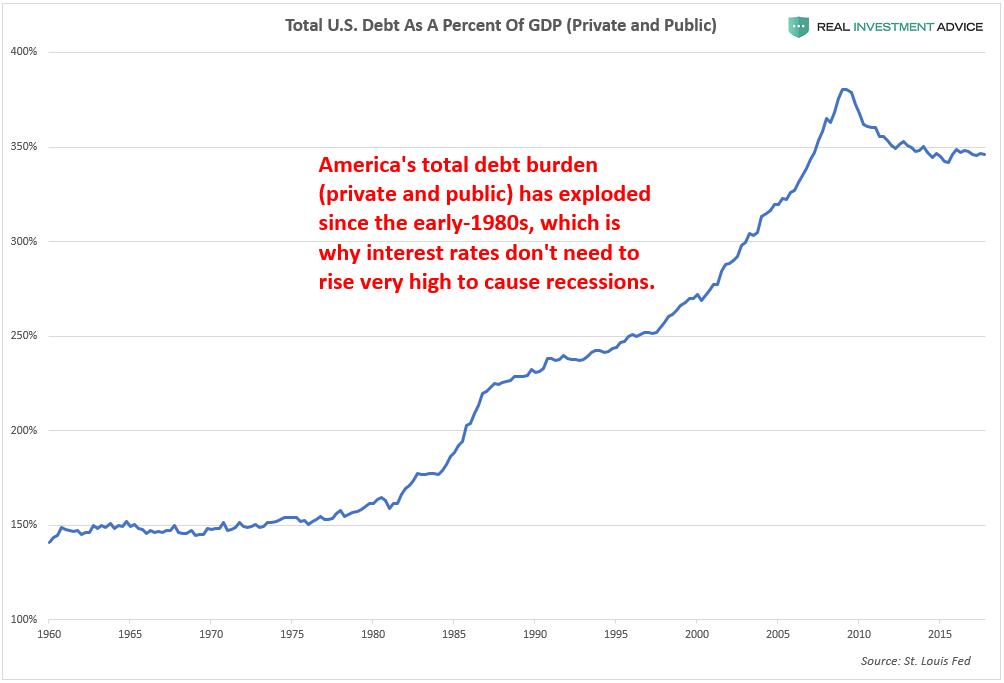
As a result of debt growing faster than our underlying economy,
America’s debt as a percent of GDP soared from just over 150% in the
early-1980s to approximately 350% in recent years. This higher debt
burden is the reason why our economy simply cannot handle interest rates as high as they were before 2008.
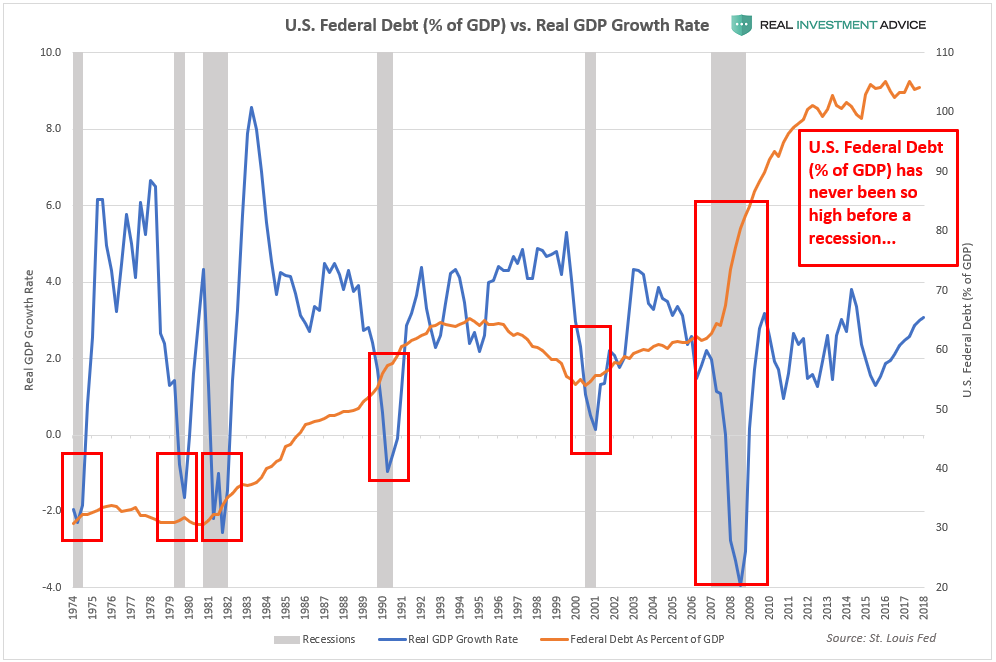
Particularly worrisome is the fact that U.S. federal debt is at a
record of over 100% of the GDP (vs. 62% before the Great Recession),
which will make it a much greater challenge to keep the economy afloat
in the coming recession:
Market strategist Sven Henrich described our conundrum quite well:
市場ストラテジストSven Henrichは今我々が抱える難問を的確に表現した:
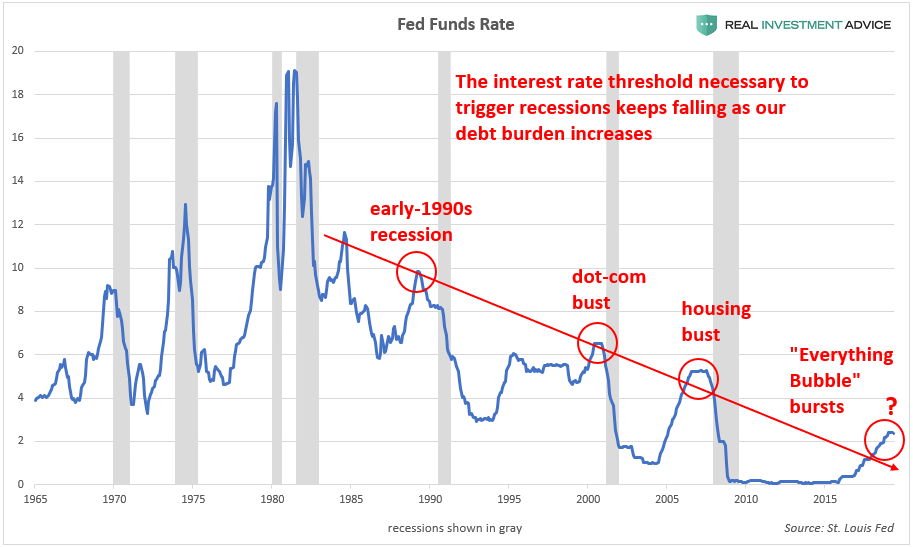
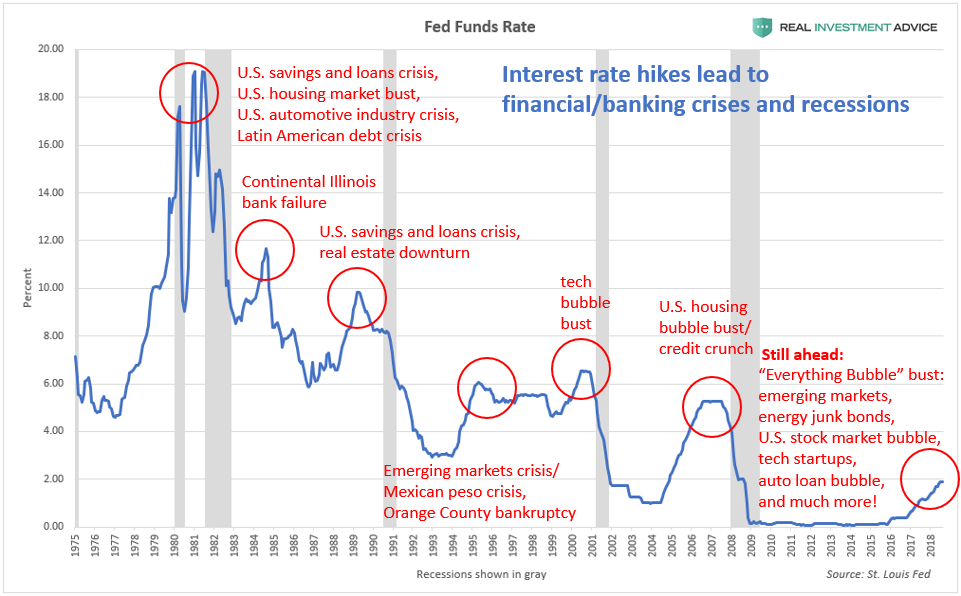
As the Fed Funds rate chart below shows, the interest rate threshold
necessary to trigger recessions (recessions are designated by the gray
bars) keeps falling as our debt burden increases:
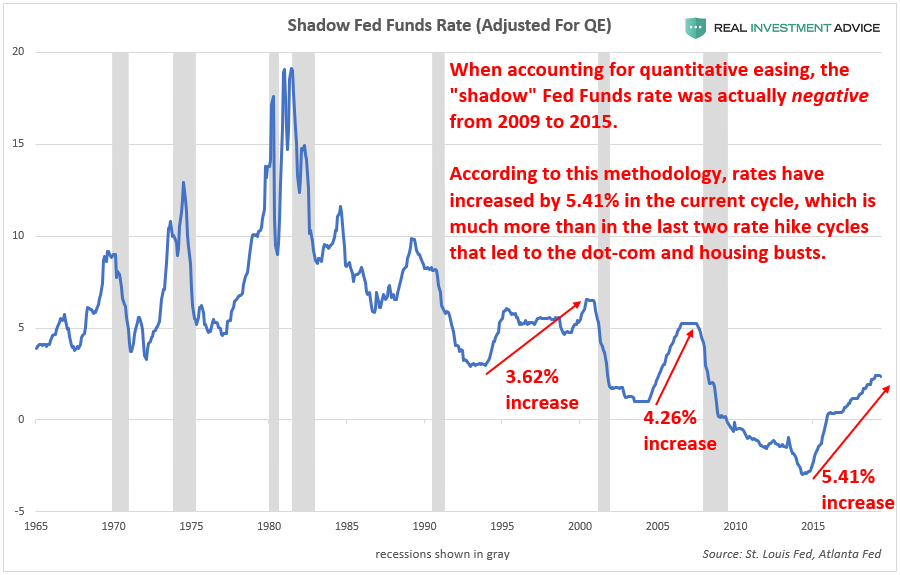
Though many optimists are quick to point out that the benchmark Fed
Funds rate was only increased from 0% to 2.5% during the current
tightening cycle, the reality is that the current tightening cycle is even more aggressive than the past several cycles when the Fed Funds rate is adjusted for quantitative easing(this is known as the shadow Fed Funds rate – learn more).
According to this methodology, interest rates have increased by the
equivalent of 5.41% in the current cycle versus just 3.62% before the
2001 recession and 4.26% before the Great Recession of 2007 to 2009:
多くの楽観主義者の指摘では、今回の引き締めサイクルでFFRは0%から2.5%に増えたに過ぎないという、しかしながら、現実には現在の金利引き締めは過去数回の引き締めよりももっと積極的なものだ、というのもFFRは量的緩和を考慮すべきだからだ(このことはシャドーFFRとしてしられているーーくわしくはこちら)。この手法を適用すると、現在の金利引き上げはすでに過去の引き上げなら5.41%に相当するものである、一方2001年の景気後退前の引き上げは3.62%であり、2007から2009年のthe Great Recession前では4.26%だった:
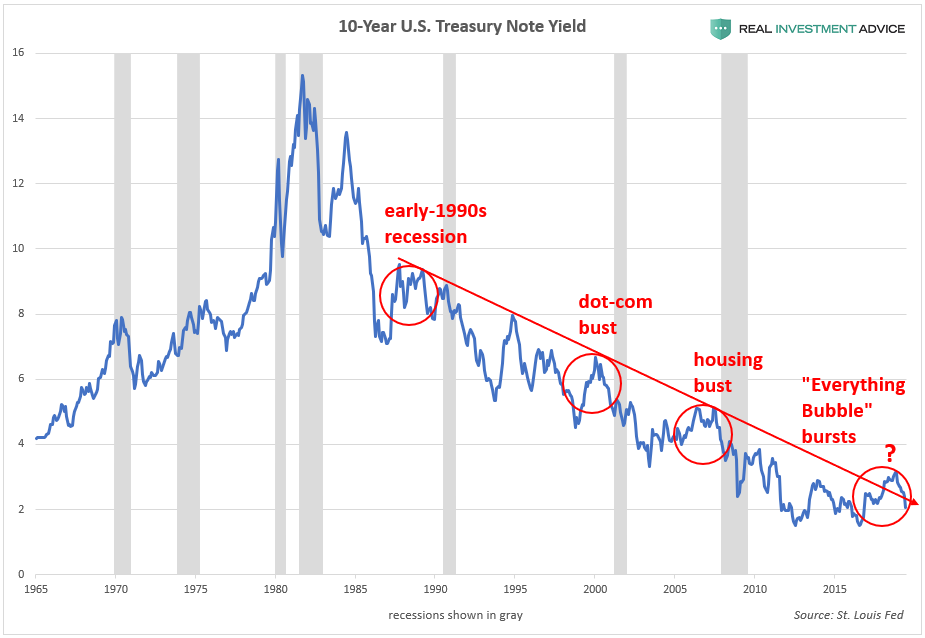
The 10-year U.S. Treasury note yield also confirms the message given
by the Fed Funds rate: the U.S. economy has become increasingly
sensitive to higher interest rates:
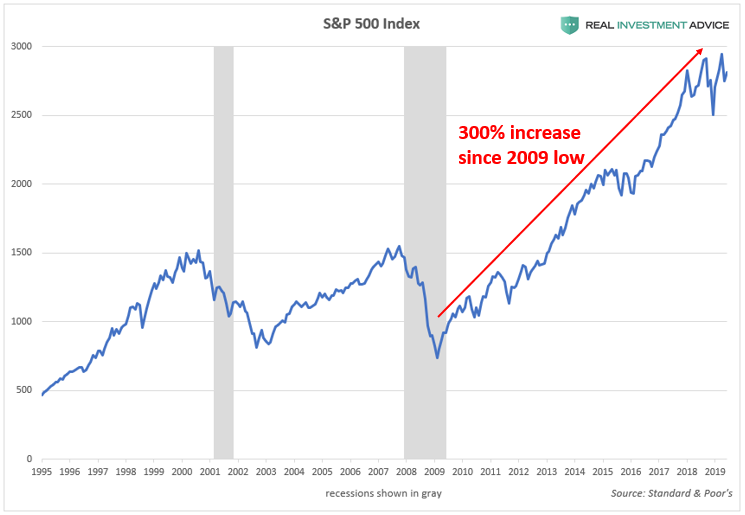
The rapidly-approaching recession poses a serious risk to the
extremely inflated U.S. stock market, which is up 300% since its 2009
low. The U.S. stock market is experiencing an unsustainable bubble due
to the aggressive actions of the Fed (see my detailed explanation).
To summarize, interest rates do not need to rise much to throw the heavily-indebted U.S. economy into a recession now; furthermore, interest rates have likely already risen to the levels that are necessary to tip our feeble economy over into a recession, as evidenced by rapidly weakening economic data. At
this stage of the game, everyone needs to be realistic – we can’t
expect to have a full decade of unprecedented central bank stimulus
without a tremendous bust. Central banks can only create temporary
economic booms by borrowing from the future rather than sustainable,
organic economic booms. Anyone who does not believe in that truth right
now, or is not aware of it, will inevitably become a firm believer in
the coming bust.
Amazonで買物をしてContrarianJを応援しよう Silver Outperforming Gold 2 Adam Hamilton July 26, 2019 3232 Words Silver has blasted higher in the last couple weeks, far outperforming gold. This is certainly noteworthy, as silver has stunk up the precious-metals joint for years. This deeply-out-of-favor metal may be embarking on a sea-change sentiment shift, finally returning to amplifying gold’s upside. Silver is not only radically undervalued relative to gold, but investors are aggressively buying. Silver’s upside potential is massive. ここ2週シルバーは急騰した、ゴールドを遥かに凌ぐものだ。これは注目すべきことだ、もう何年もシルバーはひどいものだった。この極端に嫌われた金属が大きく心理を買えている、とうとうゴールド上昇を増幅するに至った。シルバーは対ゴールドで極端に過小評価されているだけでなく、投資家は積極的に買い進んでいる。シルバーの潜在上昇力は巨大なものだ。 Silver’s performance in recent years has been brutally bad, repelling all but the most fanatical contrarians. Historically silver prices have been mostly ...
Amazonで買物をしてContrarianJを応援しよう Junk Bond Bubble In Pictures: Deflation Up Next by Tyler Durden Fri, 07/19/2019 - 14:37 Authored by Mike Shedlock via MishTalk, The widely discussed "everything bubble" is, in reality, a corporate junk bond bubble on steroids sponsored by the Fed ... 幅広く議論されている「everything bubble」は実際に企業ジャンク・ボンドバブルにも言えることであり、これはFEDによりドーピング注入されている・・・ The highest grade AAA corporate bonds yield 2.75%. BBB-rated corporate bonds, just one step above junk, 3.5%. BB-rated bonds yield just 4.28%. 最高級ランクAAA企業債権の金利は2.75%だ。あとひとランク悪化でジャンク・ボンド入りするBBB債権金利は3.5%。BB格付け債権の金利でもわずか4.28%でしかない。 Corporate Bond Spreads 企業債権金利のスプレッド The spread between Prime AAA bonds and lower-medium grade bonds (see chart below) is just 0.77 percentage points. 最上位AAA債権と低中ランク債権のスプレッドがわずか0.77%しかない。 The spre...
結局、中国は隣国日本で20年前に起きたことを学んでいなかったということでしょう、というかどの国もどの政府も十分成熟するまでは「わかっちゃいるけどやめられない」ということでしょうね、きっと。 Spooked By Apple? Wait ‘Til China’s Bubble Bursts Written by Jesse Colombo | Jan, 3, 2019 Apple stock plunged nearly 10% on Thursday after the company cut its revenue forecast due to slowing iPhone sales in China. Apple’s woes dragged U.S. stock indices lower by more than 2% as fears of a more extensive China-driven slowdown spread. アップルの株価は火曜に約10%下落した、同社が中国でのiPhone売上原則を予想したためだ。アップルの弱さが米国株式指数を2%以上押し下げた、中国主導でさらなる原則が広がるのではという懸念からだ。 From the New York Times : ニューヨークタイムスによると: For years, no matter what was happening elsewhere, global companies bet billions upon billions of dollars that China’s consumers would keep spending money. 長年、他国で何が起きようとも多国籍企業は中国消費は巨額を維持することに賭けてきた。 Now, just when the world economy could use their financial firepower, they are no longer so quick to open their wallets. 今や、世界経済が金融弾薬を用いてももはや彼らの財布を緩めることはできない。 The latest sign of a slowdown in...
Gold Stocks Surge Higher Adam Hamilton February 22, 2019 2932 Words The gold miners’ stocks surged strongly this week, blasting to new upleg highs. The mounting gains are naturally driving more interest in this small contrarian sector, shifting sentiment towards bullish. Despite their accelerating rally, gold stocks still remain fairly low technically and deeply undervalued relative to gold. So their strengthening upleg likely has plenty of room to run considerably higher in coming months. 今週金鉱株は力強く上昇し新高値となった。上昇が積み上がりこの小さなコントラリアンセクターはさらに注目を集めている、これが心理を強気なものにする。ラリーが加速するが、金鉱株はテクニカル的にはまだ安値で、対ゴールドでとても過小評価されている。というわけで力強い上昇は今後数ヶ月まだかなりな上昇余地がある。 The gold miners’ stocks are ultimately leveraged plays on gold, which overwhelmingly drives their profits. The much-maligned yellow metal has enjoyed a strong upleg since mid-August, when record gold-futures s...
最後の2段落だけ訳をいれておきました。 Fed’s Risky QE4 Stock Ramp Adam Hamilton January 31, 2020 3567 Words The US stock markets dramatically surged mostly in a straight line since mid-October. This extraordinary rally started when the Federal Reserve announced it would resume expanding its balance sheet for the first time in years. The deluge of new liquidity from that quantitative-easing bond buying has again acted like rocket fuel for stock markets. After shooting vertically they are in real trouble when the Fed pulls back. In early October the flagship US S&P 500 stock index (SPX) slumped to 2888. That was a mild 4.6% pullback from late July’s latest record high. The SPX was still having a great year though, up 15.2% year-to-date at that point thanks to extreme Fed easing . After the SPX had plunged 19.8% mostly in Q4’18 in a severe near-bear cor...