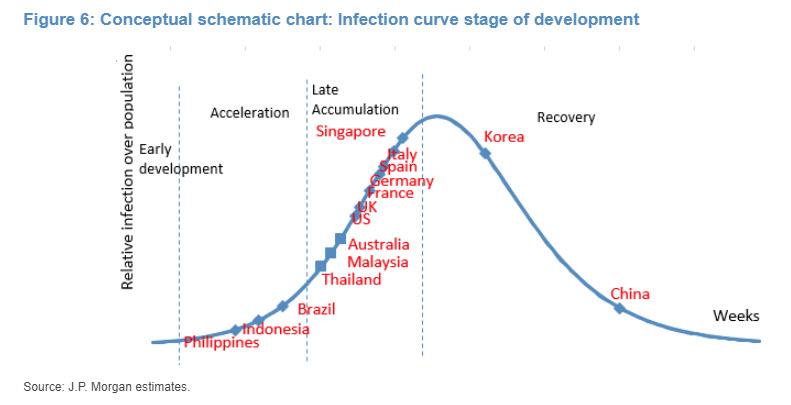
Here is an example of a curve that everyone wants to flatten.
これは一例だが、だれもが曲線の平坦化を望んでいる。
And here is an example of a curve that while some - namely the bears
- also wants to see collapse, it will never do so as that would mean
the end of western civilization - which is now entirely contingent on
the level of the S&P500 - as we know it. We are talking of course,
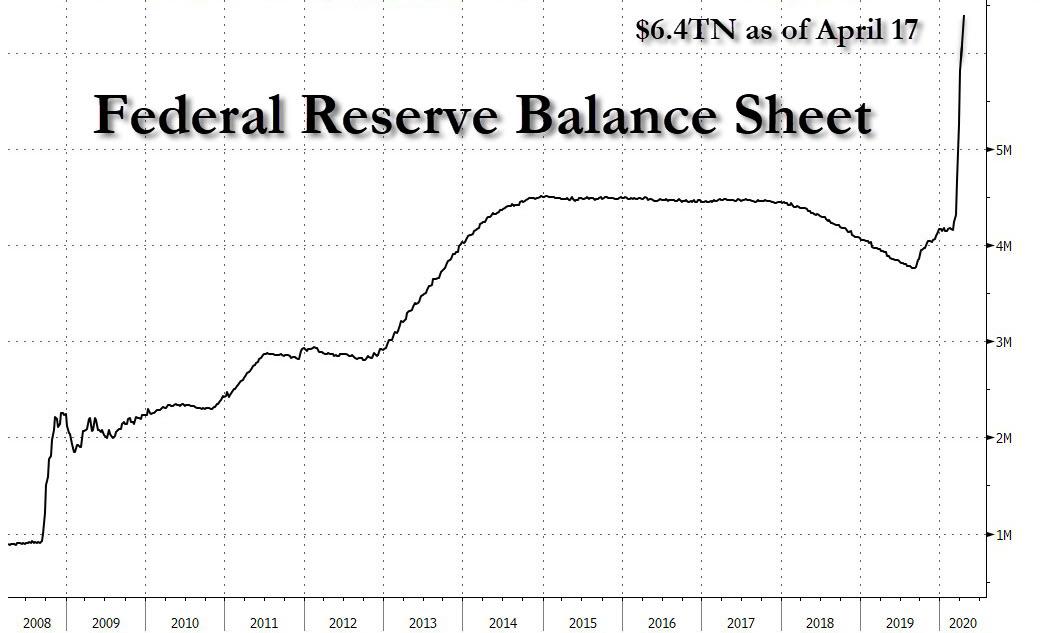
about the Fed balance sheet which is now well above $6 trillion to make
sure stocks and bonds don't crash.
With that in mind here is all you need to know about this particular "curve":
Total Fed assets grew by $293Bn to $6.08 trillion as of close, April
8, with the increase primarily driven by $294bn of Treasury securities
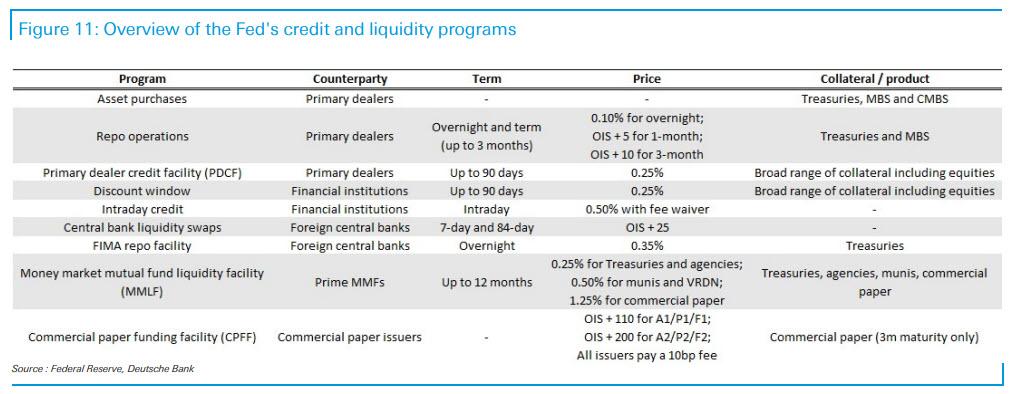
added to the SOMA portfolio. Through its credit facilities, the Fed also
extended $680bn in temporary liquidity to various counterparties, a
decline of $61bn from last week.
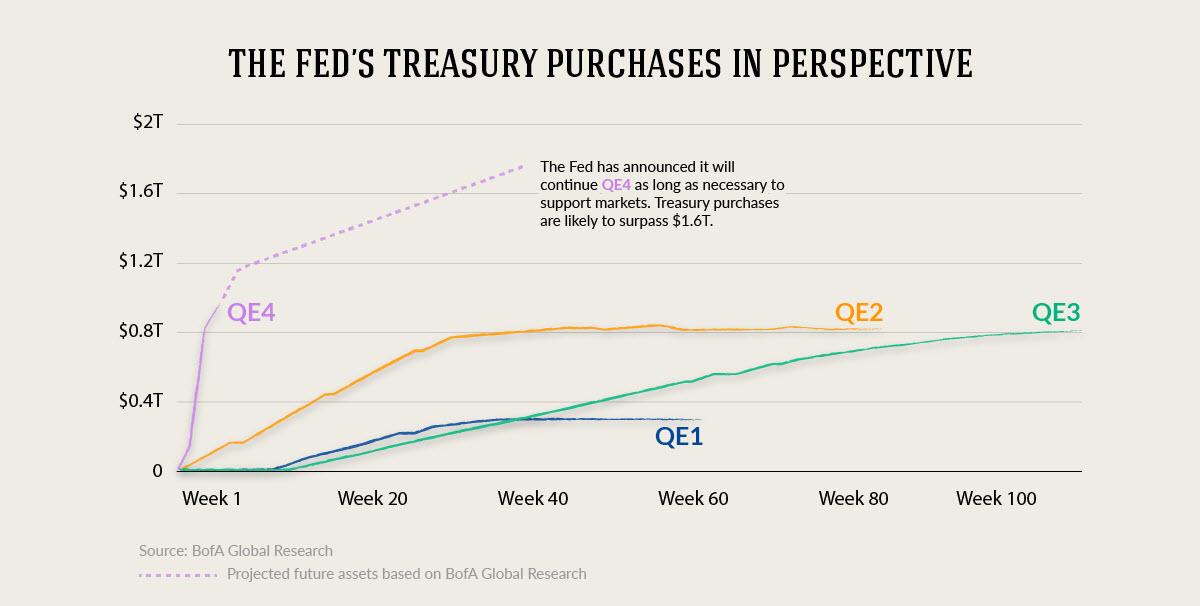
In the past month, the Fed balance sheet
has increased by $2 trillion, more than all of QE3, when the balance
sheet increased by $1.7 trillion over the span of a year. The balance
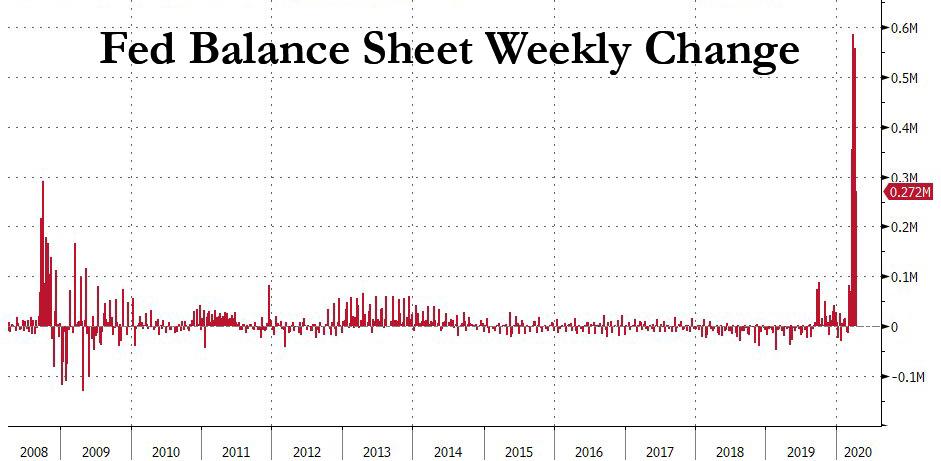
sheet increase has also been faster on a weekly basis than anything
observed during the financial crisis, increasing as follows:
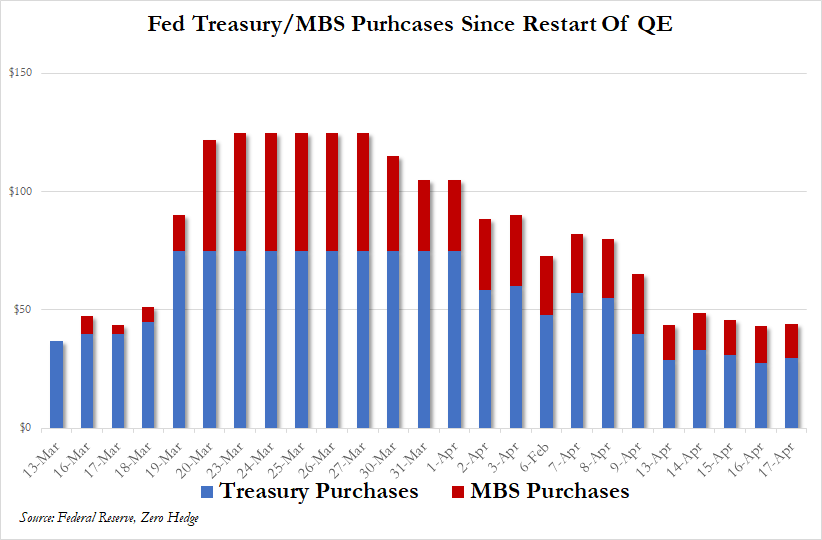
Since the Fed needs to monetize all debt issuance this year, and probably every other year now that the Treasury and Fed have merged and helicopter money has arrived, the pace of the current QE is like nothing ever observed before:
.. we can calculate that by next Friday, April 17, the Fed's assets will rise to at least $6.4 trillion,
almost double where the balance sheet was in early September 2019, just
before hedge funds needed to be bailed out and the Fed pretended like
it was saving the repo market.
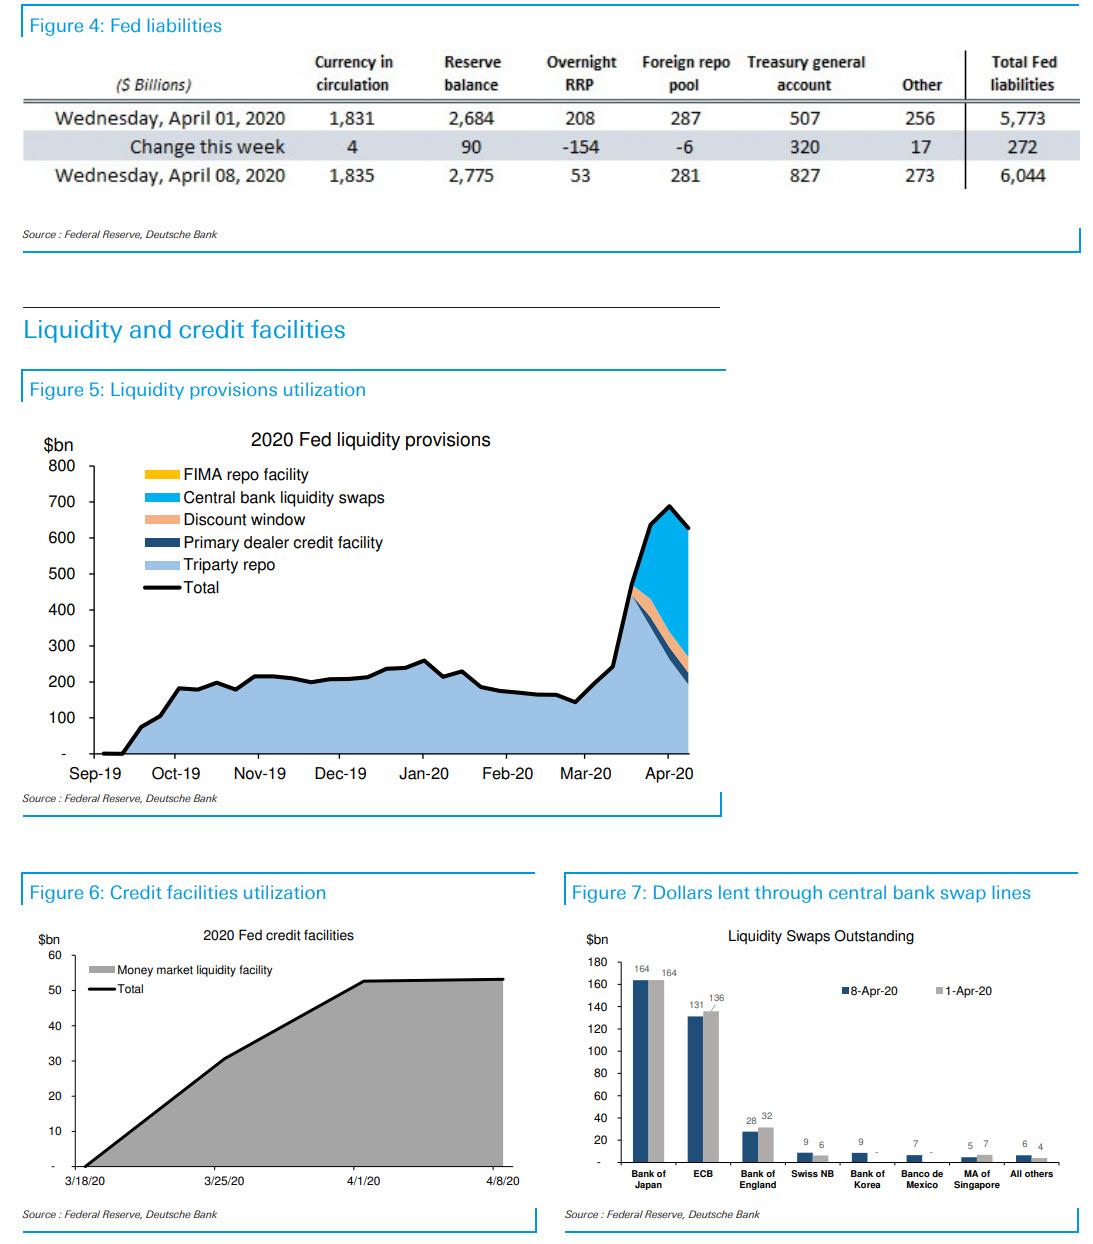
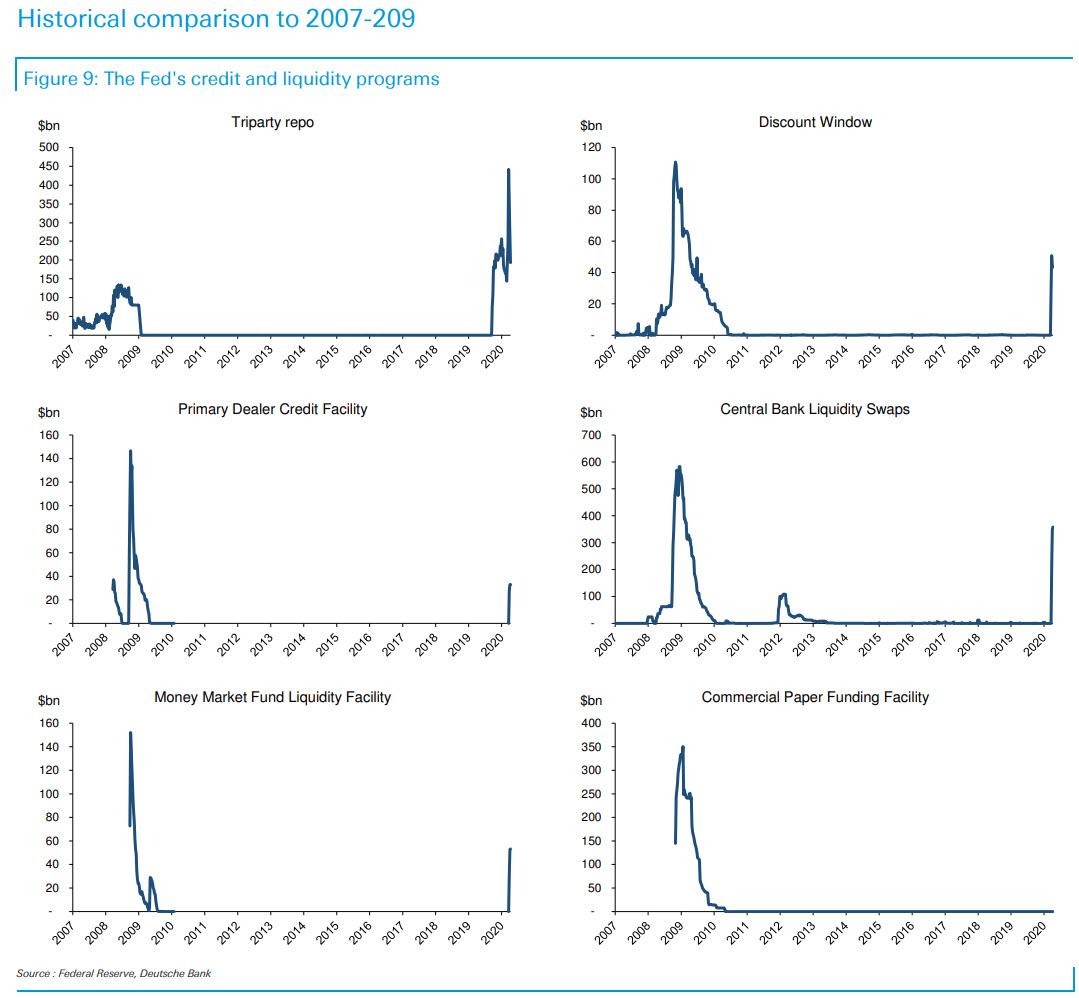
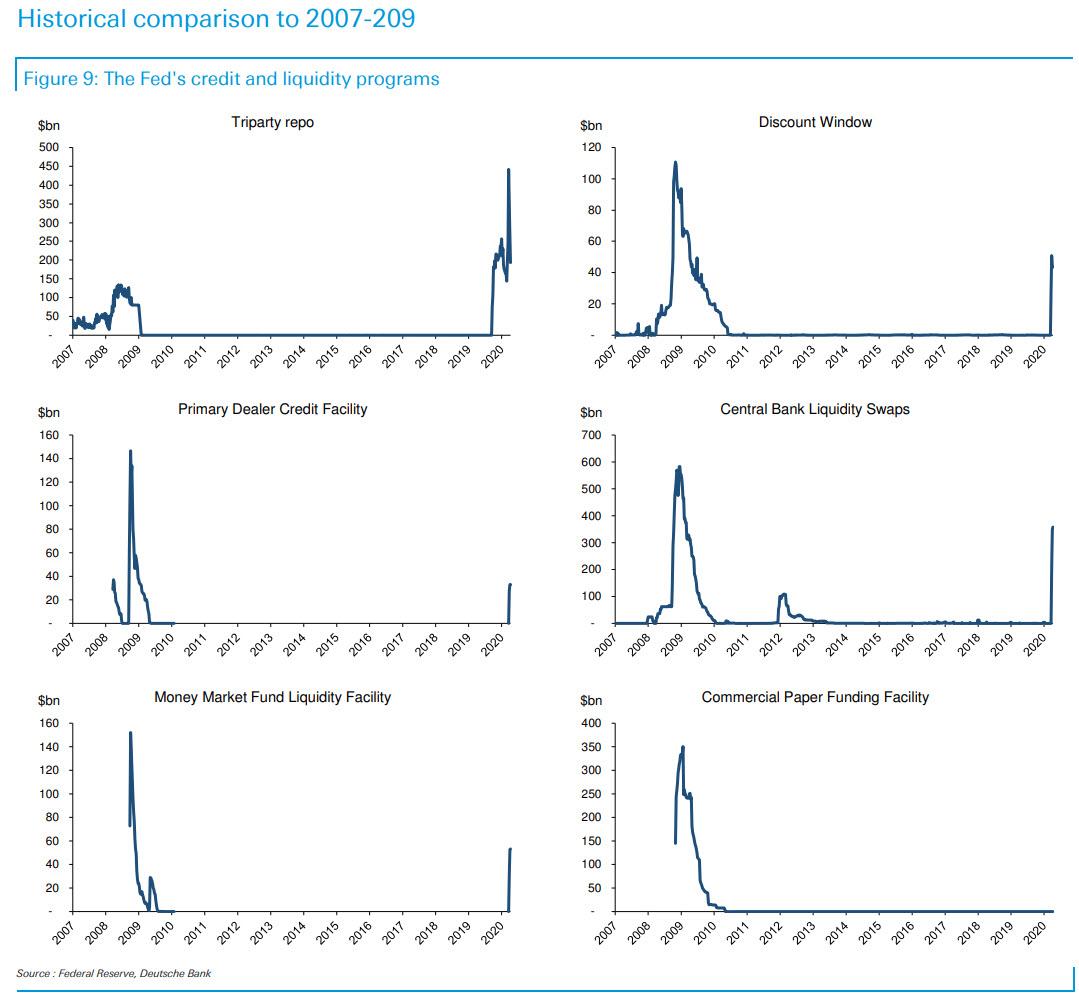
The highest utilization among the Fed’s credit facilities was
the central bank liquidity swap lines, which saw its balances increase
by $10bn to $358bn.
Temporary repo operations with primary dealers fell by $70bn to
$193bn. The newly introduced repo facility for foreign central banks had
a balance of only $1mm.
Balances in the Money Market Mutual Fund Liquidity Facility (MMLF)
and the Fed discount window were relatively unchanged from last week
with $53bn and $43bn, respectively.
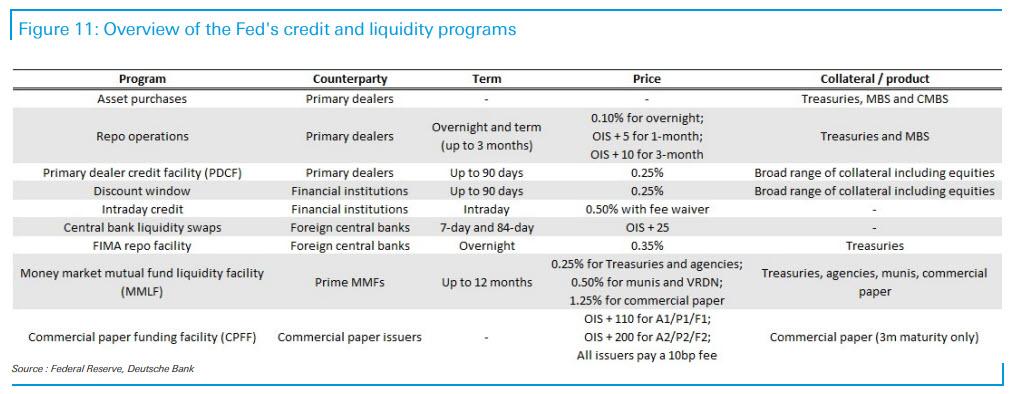
Then, to make sure the balance sheet goes even more exponential soon,
on Thursday, the Fed announced a new facility for municipal bonds and
details for a number of other programs, including the Main Street
Business Lending Program (MSBLP) and the corporate facilities. The two
corporate credit facilities will receive a combined $75bn, allowing for a
market footprint up to $750bn. Fed purchases will also include "fallen
angels" and portions of syndicated loans. In addition, a portion of its
ETF purchases in the Secondary Market Corporate Credit Facility will be
allocated to high-yield ETFs.
Meanwhile, the newly established Municipal Liquidity Facility will
offer up to $500bn of lending to states and municipalities backed by
$35bn in funding from the Treasury.
Amazonで買物をしてContrarianJを応援しよう この長文記事をRay Dalioが発表し、ゴールドは$1400から$1420へと急騰しました。GLD保持高に変化はないのでたぶん先物ポジションが進んでいます。 Ray Dalio Warns A "New Paradigm" Is Coming: "Buy Gold, Sell Stocks" by Tyler Durden Wed, 07/17/2019 - 14:44 Authored by Ray Dalio via LinkedIn, One of my investment principles is: 私の投資原則はこういうものだ: Identify the paradigm you’re in, examine if and how it is unsustainable, and visualize how the paradigm shift will transpire when that which is unsustainable stops. 現在のパラダイムを認識し、それがどの程度持続可能かどうか判断する、そしてパラダイムシフトがどのように起きるか、そしてその着地点を思い描く。 Over my roughly 50 years of being a global macro investor, I have observed there to be relatively long of periods (about 10 years) in which the markets and market relationships operate in a certain way (which I call “paradig...
Amazonで買物をしてContrarianJを応援しよう 記事を紹介しようと訳を入れている間にFOMCが過ぎてしまいタイミングを逸してしまいました、前半は読み飛ばしてください。後半部分に関して、日本では一般会計と特別会計が別れていて政府財政がわかりにくいですが、米国は分離されておらず年金会計がより鮮明になります。$70Tって邦貨でいうと約7000兆円ですからね。 Whistling Past The $70 Trillion Debt Graveyard 07-26-19 Written by Lance Roberts | Jul, 27, 2019 Last week, we discussed the setup for a near-term mean reversion because of the massive extension above the long-term mean. To wit: 先週には、私どもは短期的な平均回帰のし掛けが出来上がっていることを議論した、というのも現在長期的な平均から極端に乖離しているからだ。見てみよう: “There is also just the simple issue that markets are very extended above their long-term trends, as shown in the chart below. A geopolitical event, a shift in expectations, or an acceleration in economic weakness in the U.S. could spark a mean-reverting event which would be quite the norm of what we have seen in recent years.” 「とてもかんたんなことだが、市場は長期的なトレンドからあまりに極端に上方乖離している、それは下のチャートを見れば明らかだ。地政学的出来事、期待値の変化、もしくは米国経済の弱さが加速するなら、平均回帰を引き起こすだろう、それは過去数年でみた典型的な相場の動きだ。」 This analysis is ...
Productivity: What It Is & Why It Matters Written by Michael Lebowitz | Jan, 16, 2019 The Kansas City Federal Reserve posted the Twitter comment and graph below highlighting a very important economic theme. Although productivity is a basic building block of economic analysis, it is one that few economists and even fewer investors seem to appreciate. Kansas 市FEDがツイッターにコメントを投稿した、そのグラフを下に示す、とても重要な経済テーマだ。経済分析においては生産性というのはとても重要な要素だが、ほとんどのエコノミストがこの件に言及しない、投資家は更にこのことを忘れ去っている。 The Kansas City Fed’s tweet is 100% correct in that wages are stagnating in large part due to low productivity growth. As the second chart shows, it is not only wages. The post financial-crisis economic expansion, despite being within months of a record for duration, is by far the weakest since WWII. Kansas City FEDのツイートは100%正しい、給与が停滞している原因の主要因は生産性成長が低いからだ。二番目のチャートを見ても判るように、成長鈍化は給与だけではない。あの金融危機後の経済拡大は、第二次世界大戦後で記録的長期の拡大期間だが、とても弱い拡大だ。 Productivity growth over the last 350+ years is ...
米国はよく理解してませんが、日本の場合では量的緩和で日銀が国債買い上げした資金は日銀当座預金にそのままです、市中には流れていません。でもNHKのニュース等では「ジャブジャブ」という表現をアナウンサーが使い、さらに丁寧に水道の蛇口からお金が吐き出される画像まで示してくれます。これって心理効果が大きいですよね。量的緩和とは何かを7時のニュースや新聞でこれ以上丁寧に解説するのはそう簡単ではありません。一般の人も株式をやっている人も「イメージ」で捉える以上はそう簡単にできません。多くの人は量的緩和とはなにか、を理解していないと私は想像しています。 ただし、国債を買い上げるので長期金利が低下し住宅ローン金利等が下がったのは確実な効果です。一方で長短金利差が少なくなると銀行のビジネスモデルが成り立たなくなりますが。 This Is The One Chart Every Trader Should Have "Taped To Their Screen" by Tyler Durden Sat, 01/19/2019 - 18:55 After a year of tapering, the Fed’s balance sheet finally captured the market’s attention during the last three months of 2018. 一年間のテーパリング後、FEDバランスシートがとうとう市場の注目をあびることになった、2018年の最後の3ヶ月だ。 By the start of the fourth quarter, the Fed had finished raising the caps on monthly roll-off of its balance sheet to the full $50bn per month (peaking at $30bn USTs, $20bn MBS...