Authored by Michael Lebowitz and Jack Scott via RealInvestmentAdvice.com,
Imagine approaching a friend that you think is very wealthy and
asking her to borrow ten thousand dollars for just one night. To entice
her, you offer as collateral the title to your 2019 Lexus parked in her
driveway along with an interest rate that is 5% above that which she is
earning in the bank. Shockingly, your friend says she can’t. Given the
risk-free nature of the transaction and excellent one-day profit, we can
assume that our friend may not be as wealthy as we thought.
On Monday, September 16th, 2019, a similar situation occurred in the
overnight repurchase agreement (repo) funding market. On that day, banks
were unwilling or unable to lend on a collateralized basis, even with
the promise of large risk-free profits. This behavior reveals something
very important about the banking system and points to the end of market
stimulus that has been around for the past decade.
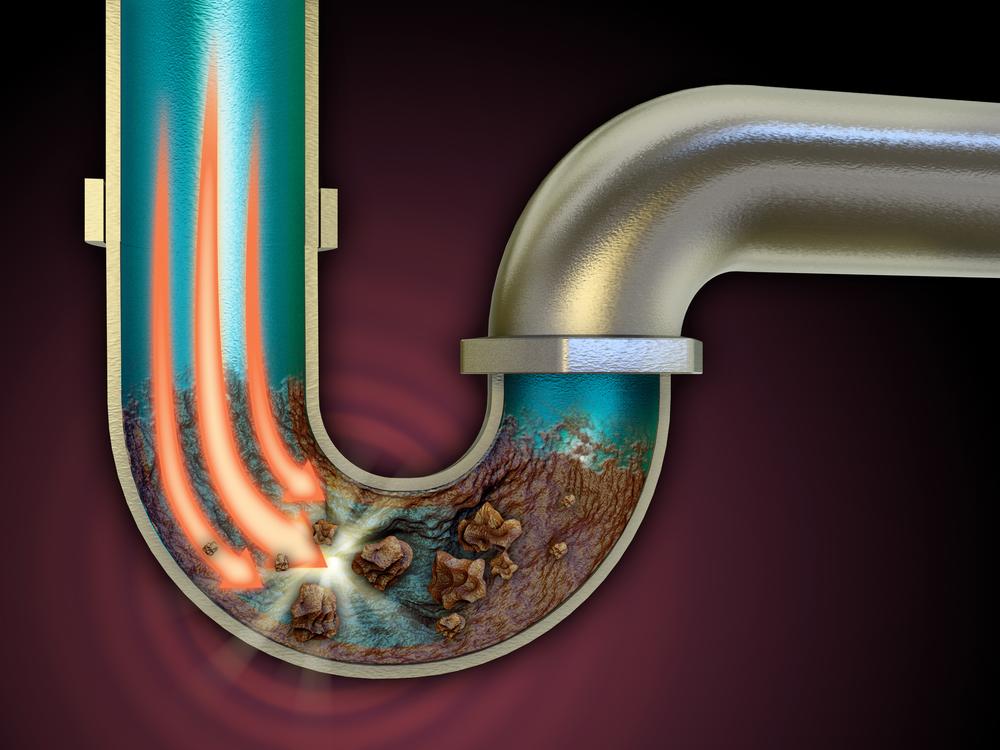
The Plumbing of the Banking System and Financial Markets
銀行システムや金融システムの配管
Interbank borrowing is the engine that allows the financial system to
run smoothly. Banks routinely borrow and lend to each other on an
overnight basis to ensure that all banks have ample funds to meet daily
cash flow needs and that banks with excess funds can earn interest on
them. Literally, years go by with no problems in the interbank markets
and not a mention in the media.
Before proceeding, what follows is a definition of the funding instruments used in the interbank markets.
Fed Funds are uncollateralized interbank loans that are almost
exclusively done on an overnight basis. Except for a few exceptions,
only banks can trade Fed Funds.
Repo (repurchase agreements) are collateralized loans. These
transactions occur between banks but often involve other non-bank
financial institutions such as insurance companies. Repo can be
negotiated on an overnight and longer-term basis. General collateral, or
“GC,” is a term used to describe Treasury, agency, and mortgage
collateral that backs certain repo loans. In a GC repo, the particular
securities backing the loan are not determined until after the
transaction is agreed upon by the counterparties. The securities
delivered must meet certain pre-defined criteria.
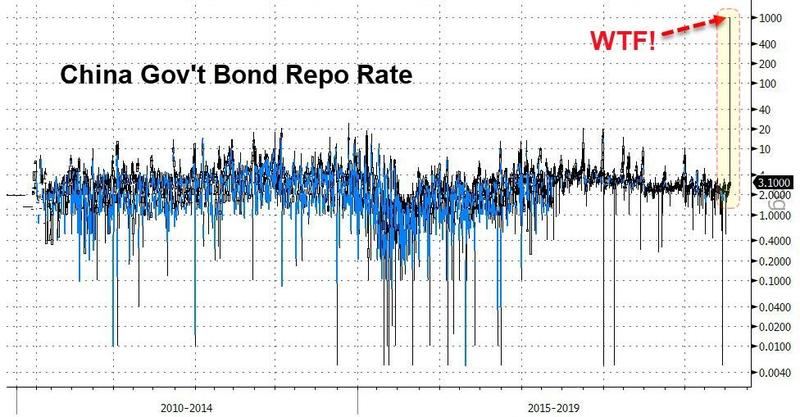
On September 16th, overnight GC repo traded as high as 8%,
almost 6% higher than the Fed Funds rate, which theoretically should
keep repo and other money market rates closely tied to it. The
billion-dollar question is, “Why did a firm willing to pay a hefty
premium, with risk-free collateral, struggle to borrow money”? Before
the 16th, a premium of 25 to 50 basis points versus Fed Funds would
have enticed a mob of financial institutions to lend money via the repo
markets. On the 16th, many multiples of that premium were not enticing
enough.
Most likely, there was an unexpected cash crunch that left banks
and/or financial institutions underfunded. The media has talked up the
corporate tax date and a large Treasury bond settlement date as
potential reasons. We are not convinced by either excuse as they were
easily forecastable weeks in advance.
Regardless of what caused the liquidity crunch, we do know, that in
aggregate, banks did not have the capacity to lend money. Given the
capacity, they would have done so in a New York minute and at much lower
rates.
To highlight the enormity of the aberration, consider the following:
この出来事の異常性を列挙するとこういうものだ:
Since 2006, the average daily difference between the overnight GC repo rate and the Fed Funds effective rate was .025%.
2006年以来でみて、一夜物GC repoとFFRの平均金利差は0.025%だった。
Three standard deviations or 99.5% of the observances should have a spread of .56% or less.
3標準偏差乖離として、もしくは99.5%の事象の分散は0.56%以下だ。
8% is a bewildering 42 standard deviations from the average, or simply impossible assuming a traditional bell curve. 8%というのはなんと平均から42標準偏差乖離している、もしくは伝統的な釣り鐘分布を想定することができない。
What was revealed on the 16th?
16日に起きたことでなにが明らかになったか?
The U.S. and global banking systems revolve around fractional reserve
banking. That means banks need only hold a fraction of the cash
deposits that they hold in reserve accounts at the Fed. For example, if a
bank has $1,000 in deposits (a liability to the bank), they may lend
$900 of those funds and retain only 10% in reserves. This is meant to
ensure they have enough funding on hand to make payments during the day
and also as a buffer against unanticipated liquidity needs. Before 2008,
banks held only just as many reserves as were required by the
Fed. Holding anything more than the required minimum was a drag on
earnings, as excess reserves were unremunerated at the time.
Quantitative Easing (QE) and the need for the Fed to pay interest on
newly formed excess reserves changed that. When the Fed conducted QE,
they bought U.S. Treasury, agency, and mortgage-backed securities and
credited the selling bank’s reserve account. The purpose of QE1 was to
ensure that the banking system was sufficiently liquid and equipped to
deal with the ramifications of the ongoing financial crisis. Round one
of QE was logical given the growing list of bank/financial institution
failures. However, additional rounds of QE appear to have had a
different motive and influence as banks were highly liquid after QE1 and
had shored up their capital as well. That is a story for another day.
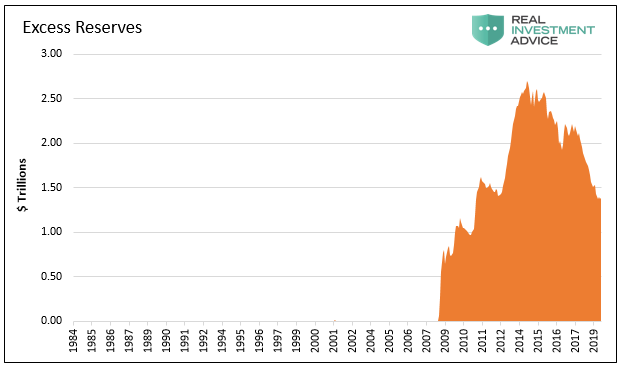
The graph below shows how “excess” reserves were close to zero before
2008 and soared by over $2.5 trillion after the three rounds of QE.
Before QE, “excess” reserves were tiny, measured in the hundreds of
millions. The amount is so small it is not visible on the graph below.
The reserves produced by multiple rounds of quantitative easing may have
been truly excess, meaning above required reserves, on day one of QE.
However, on day two and beyond that is not necessarily true for any
particular bank or the system as a whole, as we are about to explain.
Data courtesy: St. Louis Federal Reserve
The Fed, having pushed an enormous amount of reserves on the banks,
created a potential problem. The Fed feared that once the smoke cleared
from the financial crisis, banks would revert to their pre-crisis
practice of keeping only the minimum amount of reserves required. This
would leave them an unprecedented surplus of excess funds to buy
financial assets and/or create loans which would vastly increase the
money supply with inflationary consequences. To combat this problem,
they incentivized the banks to keep the reserves locked down by paying
them a rate of interest on the reserves that were higher than the Fed
funds rates and other prevailing money market rates. This rate is called
the IOER or the interest on excess reserves.
The Fed assumed banks would hold excess reserves because they could
make risk free profits at no cost. This largely worked, but some
reserves were leveraged by the banks and flowed into the financial
markets. This was a big factor in driving stock prices higher, credit
spreads tighter, and bond yields lower. This form of inflation the Fed
seemed to desire as evidenced from their many speeches talking about
generating household net worth.
From the banks’ perspective, the excess reserves supplied by the Fed
during QE were preferential to traditional uses of excess reserves.
Historically, excess bank reserves were invested in the Treasury market
or lent on to other banks in the Fed Funds market. Purchasing Treasury
securities had no credit risk, but banks are required to mark their
Treasury holdings to market and therefore produce unexpected gains and
losses. Lending reserves in the interbank market also incurred
counterparty risk, as there was always the chance the borrowing bank
would be unable to repay the loan, especially in the immediate
post-crisis period. Additionally, as QE had produced trillions in excess
reserves, there was not much demand from other banks. Therefore, the
banks preferred use of excess reserves was leaving them on deposit with
the Fed to earn IOER. This resulted in no counterparty risk and no mark
to market risk.
It is nearly impossible for the public to figure out how much in
excess reserves the banking system is truly carrying. Indeed, even the
Fed seems uncertain. It is common knowledge that they have been
declining, and over the last six months, clues emerged that the amount
of “truly excess reserves,” meaning the amount banks could do without,
was possibly approaching zero.
Clue one came on March 20th, 2019 when the
Fed said QT would end in October 2019. Then, on July 31st, 2019, as
small problems occurred in the funding markets, the Fed abruptly
announced that they would halt the balance sheet reduction in August,
two months earlier than originally planned. The QT effort,
despite assurances from Bernanke, Yellen, and Powell that it would be
uneventful, ended 22 months after it began. The Fed’s balance sheet
declined only $800 billion as a result of QT, less than a quarter of
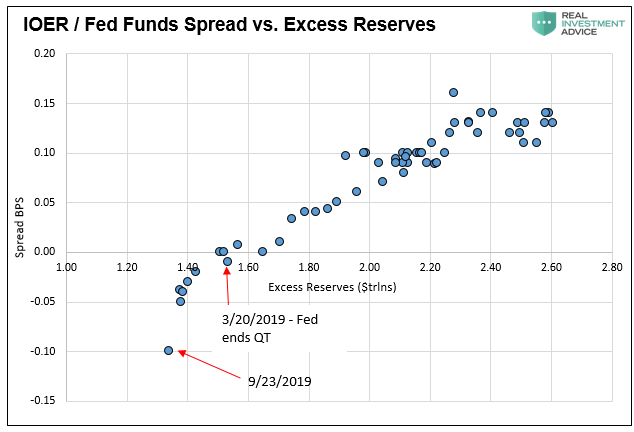
what the Fed added to their balance sheet during QE. 一つの知見は、2019年3月20日のことだ、FEDがQTを2019年10月に終わると宣言した。その後2019年7月31日に小さな問題が資金調達市場で起きた、FEDが突然バランスシート縮小を8月に停止すると宣言したのだ、当初の予定よりも二月速かった。BernankeやYellenそしてPowellが保証下にもかかわらずQTは開始後22か月で終わりを告げた。FEDのQTバランスシート縮小はわずか$800Bでしかなく、QEで膨れた量の1/4以下だった。 Clue two was the declining spread between the
IOER rate and the effective Fed Funds rate as the level of excess
reserves was declining, as seen in the chart below. The spread between
IOER and the Fed Funds rate was narrowing because the Fed was having
trouble maintaining the Fed Funds rate within the targeted range. In
March 2019, the spread became negative, which was counter to the Fed’s
objectives. Not surprisingly, this is when the Fed first announced that
QT would end.
Data courtesy: St. Louis Federal Reserve
The third and final clue emerged on September
16, 2019, when overnight repo traded at 7%-8%. If banks truly had
excess reserves, they would have lent some of that excess into the repo
market and rates would never have gotten close to 7-8%. It seems logical
that banks would have been happy to lend on a collateralized basis at
3%, much less 7-8%, when their alternative, leaving excess reserves to
the Fed, would have earned them 2.25%.
Further confirmation that something was amiss occurred on September
17th, 2019, when the Fed Funds effective rate was above the upper end of
the Fed’s target range of 2-2.25% at the time. This marked the first
time the Fed Funds rate traded above its target since 2008.
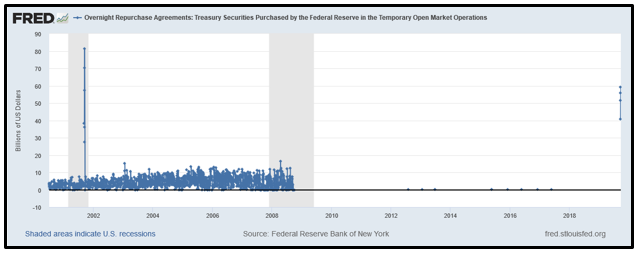
On September 17th, the Fed entered the repo markets with a $53
billion overnight repo operation, whereby banks could pledge Treasury
collateral to the Fed and receive cash. The temporary liquidity
injection worked and brought repo rates back to normal. The following
day the Fed pumped $75 billion into the markets. These were the first
repo transactions executed by the Fed since the Financial Crisis, as
shown below.
These liquidity operations will likely continue as long as there is
demand from banks. The Fed will also conduct longer-term repo operations
to reduce the amount of daily liquidity they provide.
The Fed can continue to resort to the pre-QE era tactics and use
temporary daily operations to help target overnight borrowing rates.
They can also reduce the reserve requirements which would, at least for
some time, provide the system with excess reserves. Lastly, they can
permanently add reserves with QE. Recent rhetoric from Fed Chairman
Powell and New York Fed President Williams suggests a resumption of QE
in some form may be closer than we think.
FEDは引き続きQE前のころのように一時的に毎日の一夜もの金利を操作継続できる。少なくともどこかの時点で、準備金需要を減らすこともできる、現在は過剰準備をシステムに提供しているのだが。最終的には、彼らはQEで永久に準備金を増やすこともできる。最近のFED議長PowellやNew York FED議長Williamsの発言が示唆するのは、我々が思っているよみももっと早期にQEを再開することを示唆している。
Why should we care?
どうしてこのことに注目しなければならないのか?
The QE-related excess reserves were used to invest in financial
assets. While the investments were probably high-grade liquid assets,
they essentially crowded out investors, pushing them into slightly
riskier assets. This domino effect helped lift all asset prices from the
most risk-free and liquid to those that are risky and illiquid. Keep in
mind the Fed removed about $3.6 trillion of Treasury and mortgage
securities from the market which had a similar effect.
The bottom line is that the role excess reserves played in stimulating the markets over the last decade is gone. There
are many other factors driving asset prices higher such as passive
investing, stock buybacks, and a broad-based, euphoric investment
atmosphere, all of which are byproducts of extraordinary monetary
policies. The new modus operandi is not necessarily a cause for concern,
but it does present a new demand curve for the markets that is
different from what we have become accustomed to.
Short-term funding is never sexy and rarely if ever, the most
exciting part of the capital markets. A brief recollection of 2008
serves as a reminder that, when it is exciting, it is usually a
harbinger of volatility and disruption.
In a Washington Post article from 2010, Bernanke stated, “We have
made all necessary preparations, and we are confident that we have the
tools to unwind these policies at the appropriate time.”
Much more recently, Jay Powell stated, “We’ve been operating in
this regime for a full decade. It’s designed specifically so that we do
not expect to be conducting frequent open market operations to keep fed
fund [sic] rates in the target range.”
In the Wisdom of Peter Fisher,
an RIA Pro article released in July, we discussed the insight of Peter
Fisher, a former Treasury, and Federal Reserve official. Unlike most
other Fed members and politicians, he discussed how hard getting back to
normal will be. As we are learning, it turns out that Fisher’s wisdom
from 2017 was visionary.
Peter Fisherの見識という記事で、RIA Proが7月に記事にしたが、私どもはPeter Fisherの洞察を議論した、元財務長官で、FED高官だった。他のFED役員や政治屋とことなり、彼は金融システム正常化が如何に難しいかを議論した。我々も学んだことだが、Fisherの2017年の見識には先見性がある。
“As Fisher stated in his remarks, “The
challenge of normalizing policy will be to undo bad habits that have
developed in how monetary policy is explained and understood.” He continues, “…the Fed will have to walk back from their early assurances that the “exit would be easy.”
Is The Stock Market As Confused As You Are About A Recession? Written by Lance Roberts | Apr, 1, 2019 Last week, Barron’s ran an article entitled “The Stock Market Is Just As Confused About A Potential Recession As You Are?” To wit: 先週バロンズにこういう記事が掲載された「株式市場は景気後退を予感させるほどに混乱しているだろうか?」見てみよう: “Investors have long used where we are in the economic cycle to decide which stocks to buy and sell. New research from Nomura’s Joseph Mezrich flips that on its head by showing how investors can use stock performance to help determine where we are in the cycle. Too bad the market is sending mixed messages right now.” 長らく投資家は現在景気サイクルのどこに居るかを見てこの株式を売るか買うかを判断してきた。野村證券のJoseph Mezrichの最近の研究では、これが逆さで、投資家は株式のパフォーマンスを見て今景気サイクルのどこにいるかを判断している。最悪なことに現在相場は悪化改善混在のメッセージを送っている。」 But let’s be clear here; no one wants the party to end. So, despite a struggling stock market over the last year, slowing economic growth, and a collapsing yield curve, there are s...
How Are Gold And Money Supply Related? by Tyler Durden Sun, 06/14/2020 - 13:00 Authored by Mike Shedlock via MishTalk, M2 Money Supply is surging. Will gold follow? M2マネーサプライが急増している。ゴールドはこれを追従するだろうか? Let's investigate an alleged relationship between gold and M2, a measure of money supply in the US. よく言われるM2(米国のマネーサプライ指標)とゴールドの関係について調べてみよう。 "There’s a clear correlation between the annual growth rate in M2 money supply and the price of the yellow metal. " 「M2の年率増加速度とゴールド価格の間には明らかな相関がある。」 Clear Correlation? 明らかな相関? The Tweet claims something different than my lead chart depicts. So let's investigate the above idea in other time frames. このツイートの主張は私が示す最初のチャートが示すものとは異なる。というわけでこのtweetの主張を別の時間フレームで見てみよう。 Gold vs Rate of Change in M2 Money Supply ゴールド vs M2マネーサプライの変化率 If we look at longer time frames, the rate of increase in M2 theory falls flat on its face....
China Injects Gargantuan 1.1 Trillion In Liquidity This Week by Tyler Durden Wed, 01/16/2019 - 22:19 Following what Bloomberg calculated was a record net reverse repo liquidity injection on Wednesday, when the PBOC injected a whopping 560 billion yuan of liquidity into the financial system via open market operations, the Chinese central bank has done it again and in Thursday's open market operation, it sold 250BN yuan in 7 Day repos (slightly below yesterday's record 350BN), and 150BN in 28 Day repos, which net of maturities resulted in a whopping net 380BN yuan ($56.2BN) liquidity injection. ブルームバーグの算出によると水曜に記録的なリバースレポ流動性注入が行われた、PBOCがなんと公開市場操作で金融システムになんと560B人民元を注入した、中国中央銀行は再び木曜に公開市場操作を行った、250B人民元の7日決済レポを売却した(昨日の350B人民元よりも少し少ない)、そして28日決済のレポを150B人民元注入した、結果としてなんと380B人民元($56.2B)の流動性注入となる。 (訳注:なんか足し算すると辻褄が合いません、ブルーム...
Amazonで買物をしてContrarianJを応援しよう Albert Edwards: This Was The Final Recessionary Shoe, And It Has Now Fallen by Tyler Durden Thu, 06/27/2019 - 12:45 Exactly three months ago, in late March, the 3 month-10 year spread inverted for the first time since 2007... ちょうど3か月前の3月遅くのことだ、3M10Yスプレッドが2007年以来初めて反転した・・・・ ... an event which sparked near-panic in the market as historically curve inversion has preceded the last 7 recessions. ・・・市場は準混乱状態になった、というのも歴史的に見てイールドカーブ反転が過去7回の景気後退の前兆となっているからだ。 However, while the inversion was certainly a memorable event, the question on everyone's lips is how do risk assets perform once the curve flattens and/or inverts. According to backtests from Goldman, since the mid-1980s, significant stock drawdowns (i.e. market crashes) began only when term slope started steepening after being inverted. ...