Ever since the start of October when the Fed launched QE4 - or as
some still call it "Not QE" - in response to the Sept repo crisis,
figuring out the market has been pretty simple: if the Fed's balance
sheet goes up so does the S&P500, and vice versa.
The good news for traders is that for the past three months, the
Fed's balance sheet rose 11 of 12 weeks, and declined just 1 of 12, and
magically, the S&P did just that as well.
However, now that the year-end repo scare is history at least until
the April 15 tax date and certainly the next year end, it's time for the
Fed to start shrinking its balance sheet, mostly by allowing existing
term repo operations to expire without being rolled over. Conveniently,
the FOMC Minutes released moments ago provided the Fed's own big picture
take on when the massive liquidity injection since mid-September, which
expanded the Fed's balance sheet by $415BN in three and a half
months...
c
... with the Fed pointing out its "expectations to gradually
transition away from active repo operations [in 2020] as Treasury bill
purchases supply a larger base of reserves" and specifically, "the calendar of repo operations starting in mid-January could reflect a gradual reduction in active repo operations."
None of this is new, and it has almost become conventional wisdom
that when the Fed starts draining liquidity, the market impact will be
the polar opposite of what happened when it was injecting liquidity:
i.e., stocks will drop.
So with the Fed highlighting mid-January as the period when the
liquidity injection goes into reverse, here is some more details on just
which dates will be critical: as Curvature's Scott Skyrm points out,
these will be the days when the Fed's term repos maturing over the next
few weeks, supposedly without being rolled into further term repos, or
as he puts it, "during January, it will be interesting to see how the market reacts to the term RP ops maturing:" FEDは1月半ばに流動性注入が反転することを強調している、ここに示すのはそのなかでも重要な日付だ:Curvature社の Scott Skyrmが指摘するものだ、今後数週でFEDのterm reposが満期を迎えるだろう、term repoの繰延は無いと仮定している、彼の言によると「1月中に、term repo満期に市場がどう反応するか興味深いところだ:」
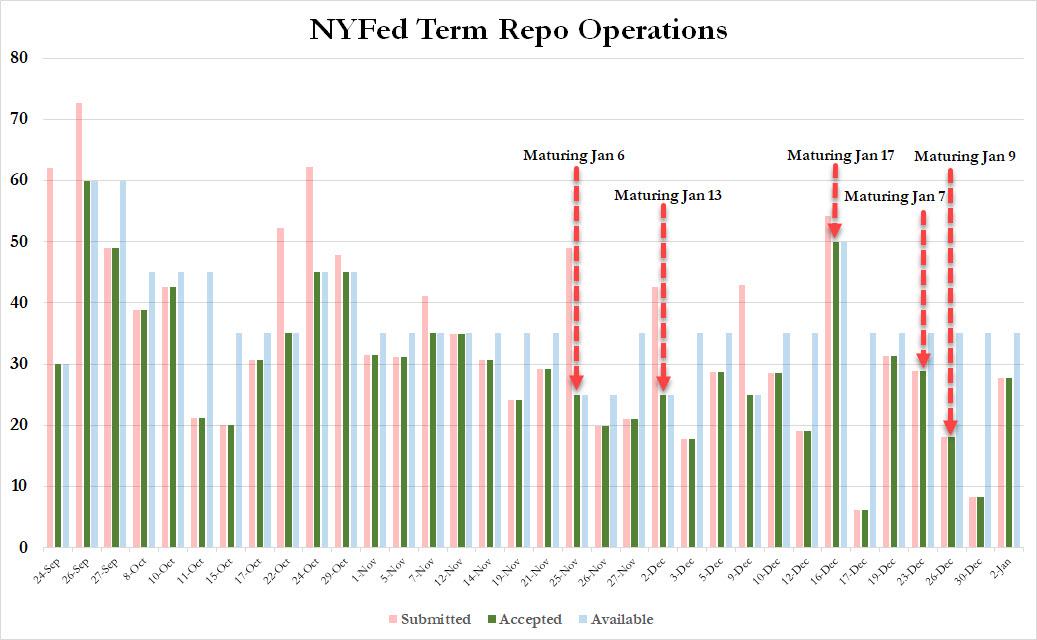
$25 billion leaves the market on Monday,
月曜には$25Bが市場から引き去られる、
$28.8 billion on Tuesday,
火曜には$28.8Bが引き去られる、
$18 billion next Friday, etc.
金曜には$18Bが引きさられる、というぐあいだ。
Of course, perhaps "interesting" is not the
right word, because it is clear that if liquidity is drained without a
matching injection, the market reaction will be anything but favorable.
That said, the Fed still has more term Repo ops scheduled to correspond
with those term roll-off dates, with at least three more term RP ops of
up to $35 billion scheduled in January. Whether or not banks decide to
use these to roll existing maturing term repos will determine if the
liquidity cliff starts hitting next week, or 3-4 weeks later. Finally,
it will also depend on whether the Fed decides that it had overinjected
the market with liquidity, and if it announces even more scheduled term
repos in February and onward.
当然のことだが、たぶん「興味深い」という言葉は適当ではない、というのも当分の注入なしに流動性が引き去られるのは明らかで、市場の反応は決して好感を持つものではないだろう。ということは、FEDは1月にまださらに term repoの満期を控えている。商業銀行が既存term repoの満期を繰延するかどうかで来週または3,4週後に流動性の崖が始まるかどうかが決まる。最終的には、FEDが市場に流動性を過剰注入するかどうかにかかっているだろう、そして2月以降のterm repoのさらなる対応スケジュール開示に依存する。
For now, however, here is a visual calendar of when some of the key December term repos mature over the next few days:
多量のオピオイドを米国に送り込み、米国で深刻な麻薬中毒問題を引き起こしています。現代版「阿片戦争」です。あのトヨタ初の女性取締役もオピオイド中毒で逮捕解任されましたよね。 US Is Dependent On China For Almost 80% Of Its Medicine by Tyler Durden Fri, 05/31/2019 - 12:55 Experts are warning that the U.S. has become way too reliant on China for all our medicine , our pain killers, antibiotics, vitamins, aspirin and many cancer treatment medicine. 専門家はこう警告する、米国はすべての医薬品、痛み止め、抗生物質、ビタミン、アスピリン、各種抗がん剤で、中国依存度が高すぎる。 Fox Business reports that according to FDA estimates at least 80 percent of active ingredients found in all of America’s medicine come from abroad, primarily from China . And it’s not just the ingredients, China wants to become the world’s dominant generic drug maker. So far Chinese companies are making generic for everything from high blood pressure to chemotherapy drugs. 90 percent of America’s prescriptions a...
米国はよく理解してませんが、日本の場合では量的緩和で日銀が国債買い上げした資金は日銀当座預金にそのままです、市中には流れていません。でもNHKのニュース等では「ジャブジャブ」という表現をアナウンサーが使い、さらに丁寧に水道の蛇口からお金が吐き出される画像まで示してくれます。これって心理効果が大きいですよね。量的緩和とは何かを7時のニュースや新聞でこれ以上丁寧に解説するのはそう簡単ではありません。一般の人も株式をやっている人も「イメージ」で捉える以上はそう簡単にできません。多くの人は量的緩和とはなにか、を理解していないと私は想像しています。 ただし、国債を買い上げるので長期金利が低下し住宅ローン金利等が下がったのは確実な効果です。一方で長短金利差が少なくなると銀行のビジネスモデルが成り立たなくなりますが。 This Is The One Chart Every Trader Should Have "Taped To Their Screen" by Tyler Durden Sat, 01/19/2019 - 18:55 After a year of tapering, the Fed’s balance sheet finally captured the market’s attention during the last three months of 2018. 一年間のテーパリング後、FEDバランスシートがとうとう市場の注目をあびることになった、2018年の最後の3ヶ月だ。 By the start of the fourth quarter, the Fed had finished raising the caps on monthly roll-off of its balance sheet to the full $50bn per month (peaking at $30bn USTs, $20bn MBS...
Amazonで買物をしてContrarianJを応援しよう Silver Outperforming Gold 2 Adam Hamilton July 26, 2019 3232 Words Silver has blasted higher in the last couple weeks, far outperforming gold. This is certainly noteworthy, as silver has stunk up the precious-metals joint for years. This deeply-out-of-favor metal may be embarking on a sea-change sentiment shift, finally returning to amplifying gold’s upside. Silver is not only radically undervalued relative to gold, but investors are aggressively buying. Silver’s upside potential is massive. ここ2週シルバーは急騰した、ゴールドを遥かに凌ぐものだ。これは注目すべきことだ、もう何年もシルバーはひどいものだった。この極端に嫌われた金属が大きく心理を買えている、とうとうゴールド上昇を増幅するに至った。シルバーは対ゴールドで極端に過小評価されているだけでなく、投資家は積極的に買い進んでいる。シルバーの潜在上昇力は巨大なものだ。 Silver’s performance in recent years has been brutally bad, repelling all but the most fanatical contrarians. Historically silver prices have been mostly ...
100年に一度と言われる出来事が過去20年で二回も起き、今度が三度目になるかどうか? Ignore The Yield Curve, They Said… 03-30-19 Written by Lance Roberts | Mar, 30, 2019 A Run For The Highs 高値に向かう Friday wrapped up the first quarter of 2019, and it was the best quarterly performance since 2009. As shown in the chart below, if you bought the bottom, you are “ killing it.” 2019Q1も金曜に終わり、2009年以来最良の四半期だった。下のチャートに示すが、もしみなさんが底値でかっていたなら、「息を呑まんばかりだ」ったろう。 However, you didn’t. しかしながら、そうはしなかったでしょう。 Despite all of the media “hoopla” about the rally, the reality is that for most, they are simply getting back to even over the last year. どのメディアもこのラリーで「大騒ぎ」だが、現実を思い起こすと、これは単に昨年のレベルに戻っただけのことだ。 That is, assuming you didn’t “sell the bottom” in December, which by looking at allocation changes, certainly appears to be the case for many. ということで、みなさんは12月の「底値で売る」ようなことをしなかったろう、それは多くの人も同じことだ。 If we deconstruct the ratio we can see the rotation a bit better この比率を分析すると資金移動をもう少しよく理解できる Not surpr...