The wild ride in job reports continues, this time to the upside with the unemployment unchanged but employment down. 雇用統計は大きく変化し、今回は表向き失業率は変わらずだが、しかしemployment 就業は減った。
Initial Reaction 当初の反応
In January, the BLS reported the population supposedly shrunk by
649,000. Last month the jobs only rose by 20,000. This month the BLS
says job gains were 196,0000. But the BLS also says employment fell by
201,000. The wild fluctuations continue.
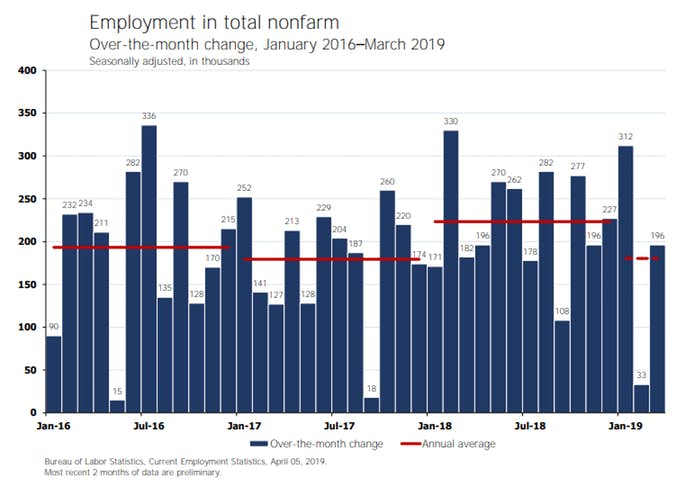
The change in total nonfarm payroll employment for January was
revised up from +311,000 to +312,000, and the change for February was
revised up from +20,000 to +33,000. With these revisions, employment
gains in January and February combined were 14,000 more than previously
reported. After revisions, job gains have averaged 180,000 per month
over the last 3 months.
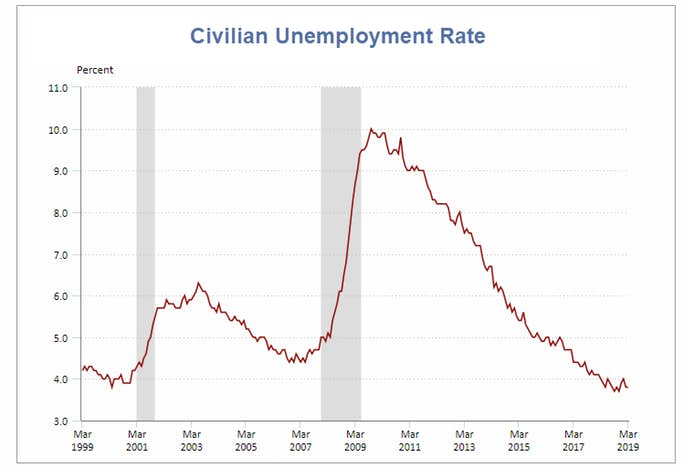
Baseline Unemployment Rate: Unchanged at 3.8% – Household Survey
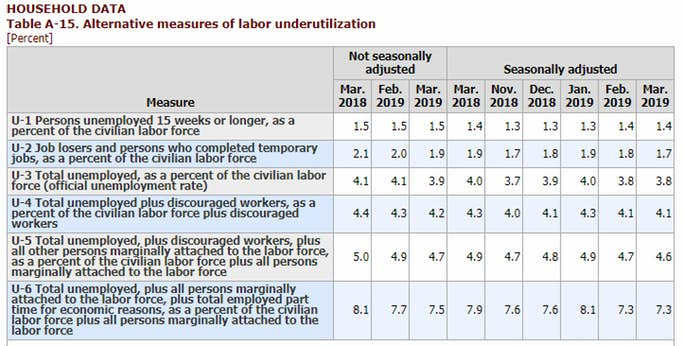
U-6 unemployment: Unchanged at 7.3% – Household Survey
Civilian Non-institutional Population: +145,000
Civilian Labor Force: -224,000 – Household Survey
Not in Labor Force: +369,000 – Household Survey
Participation Rate: -0.2 to 63.0– Household Survey
Employment Report Statement 雇用統計報告
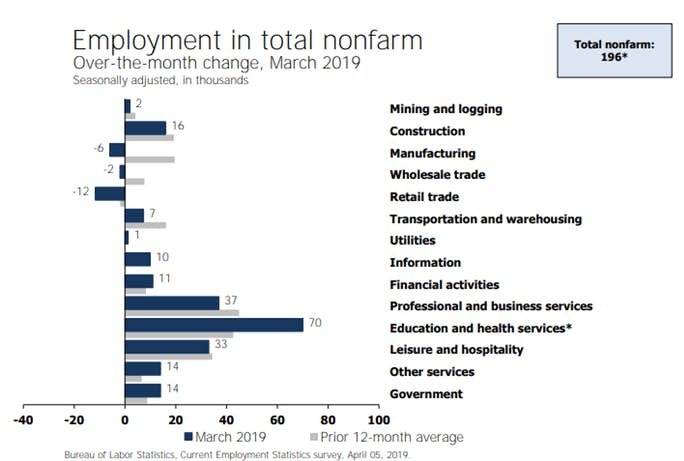
Total nonfarm payroll employment increased by 196,000 in March, and
the unemployment rate was unchanged at 3.8 percent, the U.S. Bureau of
Labor Statistics reported today. Notable job gains occurred in health
care and in professional and technical services.
The above Unemployment Rate Chart is from the BLS. Click on the link for an interactive chart.
上に示した失業率チャートはBLS発表のものだ。リンクをクリックするとインタラクティブ操作ができる。
Nonfarm Employment Change from Previous Month
非農業雇用の前月比較変化
Hours and Wages
就労時間と給与
Average weekly hours
of all private employees was flat at 34.4 hours. Average weekly hours
of all private service-providing employees was flat at 33.3 hours.
Average weekly hours of manufacturers was flat at 40.7 hours.
Average Hourly Earnings of All Nonfarm Workers
rose $0.4 to $27.70. That a 0.14% gain. Average hourly earnings of
private service-providing employees rose $0.05 to $27.47, a gain of
0.18%. Average hourly earnings of manufacturers fell $0.05 to $27.38, a
loss of 0.18%.
Average hourly earnings of Production and Supervisory Workers
rose $0.06 to $23.24. That’s a 0.26% gain. Average hourly earnings of
private service-providing employees rose $0.06 to $22.98, a gain of
0.26%. Average hourly earnings of manufacturers rose $0.02 to $21.93, a
gain of 0.09%
Birth Death Model 出生死亡モデル
Starting January 2014, I dropped the Birth/Death Model
charts from this report. For those who follow the numbers, I retain
this caution: Do not subtract the reported Birth-Death number from the
reported headline number. That approach is statistically invalid. Should
anything interesting arise in the Birth/Death numbers, I will comment
further.
Table 15 BLS Alternative Measures of Unemployment 図15 BLSによる他の失業率指標
Table A-15 is where one can find a better approximation of what the unemployment rate really is.
図A-15を見ることで本当の失業率に対するより「better」な数値を見つけることができる。
Notice I said “better” approximation not to be confused with “good” approximation.
注意してほしいが私は「better」というわけで「good」と混同しないように
The official unemployment rate is 3.8%. However, if you start
counting all the people who want a job but gave up, all the people with
part-time jobs that want a full-time job, all the people who dropped off
the unemployment rolls because their unemployment benefits ran out,
etc., you get a closer picture of what the unemployment rate is. That
number is in the last row labeled U-6.
Some of those dropping out of the labor force retired because they
wanted to retire. The rest is disability fraud, forced retirement,
discouraged workers, and kids moving back home because they cannot find a
job.
In
the payroll survey, three part-time jobs count as three jobs. The BLS
attempts to factor this in, but they do not weed out duplicate Social
Security numbers. The potential for double-counting jobs in the payroll
survey is large.
Household Survey vs. Payroll Survey 家計調査 vs. 雇用調査
The payroll survey (sometimes called the establishment survey) is the
headline jobs number, generally released the first Friday of every
month. It is based on employer reporting.
The household survey is a phone survey conducted by the BLS. It measures unemployment and many other factors.
家計調査はBLSによる電話聞き取り調査だ。これで失業とか他の多くのことを調べる。
If you work one hour, you are employed. If you don’t have a job and
fail to look for one, you are not considered unemployed, rather, you
drop out of the labor force.
These distortions artificially lower the unemployment rate,
artificially boost full-time employment, and artificially increase the
payroll jobs report every month.
Final Thoughts 最終的に思うところ
The past several jobs reports have had wild fluctuations. This month
repeated the story but in different ways. Last month I commented: “The
three month average of jobs is now +186,000 per month but the three
month average in employment is only +47,000 per month.”
過去の雇用統計は大きく変動している。今月も同様だがその原因は大きく異なる。先月私がコメントしたが:「3ヶ月平均で雇用 jobs は+186,000/月だが、しかし三ヶ月平均の就業数 employment はわずか+47,000/月だ。」
That discrepancy continues. For the last three months, jobs
are up an average of 180,000 per month. Employment is up 54,000 per
month.
Year-over-year employment went from 155,160 to 156,748. That’s an average of 132,000 per month and slowing, if the trend holds.
Amazonで買物をしてContrarianJを応援しよう "On The Precipice" by Tyler Durden Mon, 06/24/2019 - 14:30 Authored by Kevin Ludolph via Crescat Capital, Dear Investors: The US stock market is retesting its all-time highs at record valuations yet again. We strongly believe it is poised to fail. The problem for bullish late-cycle momentum investors trying to play a breakout to new highs here is the oncoming freight train of deteriorating macro-economic conditions. 米国株式は記録的バリエーションのもとで再度過去最高を試している。私どもはこれが失敗すると強く信じている。景気拡大終盤で強気のモメンタム投資家が新高値を試そうとしていることの問題は、マクロ経済条件の悪化にある。 US corporate profit growth, year-over-year, for the S&P 500 already fully evaporated in the first quarter of 2019 and is heading toward outright decline for the full year based on earnings estimate revision trends. Note the alligator jaws divergence in the chart be...
Powell Keeps The Bond Bull Kicking Written by Lance Roberts | Mar, 21, 2019 In a widely expected outcome, the Federal Reserve announced no change to the Fed funds rate but did leave open the possibility of a rate hike next year. Also, they committed to stopping “Quantitative Tightening (or Q.T.)” by the end of September. 多くの人が予想したとおり、FEDはFFR変更をしないだけでなく来年も不明とした。さらには、QTを9月末に終えると約束した。 The key language from yesterday’s announcement was: 昨日の発表の重要な部分はこういう具合だ: “ Information received since the Federal Open Market Committee met in January indicates that the labor market remains strong but that growth of economic activity has slowed from its solid rate in the fourth quarter . Payroll employment was little changed in February, but job gains have been solid, on average, in recent months, and the unemployment rate has remained low. 「1月のFOMC以来の情報を分析すると、労働市場は強いがQ4に比べると経済成長は鈍化している。2月の雇用環境にほとんど変化がなかった、ここ数ヶ月確実に雇用は増えている、そして失業率は低いままだ。 Recent indicators point to s...
中国が債務増加していることはたしかです。ただ日本の例を日銀資金循環報告でみると家計、320兆円、民間非金融機関1,785兆円、一般政府 1,284兆円となります。合算すると3,300兆円にもなり、GDPの600%を超えています。 https://www.boj.or.jp/statistics/sj/sjexp.pdf この記事の統計と同じ考え方で数値を採用しているのかどうか気になります。 加えて、この資金循環報告に書かれている海外資産というのが内数なのか外数なのか?私にはよくわかりません。当然海外債務も結構な額になります。一度日銀資金循環 図表1を見てください。詳しい方に教えていただければ。 この中国のたどる道は昔のソ連とかMMTと同様で、自国通貨ならいくら発行しても倒産はしない、というか為政者が痛みに耐えることができず緩和を続けるというものです。でも最終的には限界点に達します。ソ連は建国から崩壊まで70年かかりました。 自由主義経済なら立ち行かなくなった企業は退場してもらうというのが減速なのですが、これがうまくゆかないわけです。 でも日本は中国のはるか先を言っているように見えます。ちょっと検索したのですが、日本の債務に関しては政府債務に言及したものばかりで、この記事のように民間、個人まで総合的に記載しているのは日銀の資金循環統計しか見つけることができませんでした。 China Continues To Pile Debt On Top Of More Debt Written by Jesse Colombo | Feb, 27, 2019 Like many countries, China attempted to rein in its debt growth over the past couple years, but ultimately gave up and is now back to piling on even more debt. Bloomberg reports – 多くの国と同様に、中国もここ2年ほど債務増加を抑えようとしてきた、しかし結局の所諦めてしまい、今や更に債務を積み上げている。ブルームバーグ記事ーー For almost two years,...
Class 8 Heavy Truck Orders Crash 68% in January by Tyler Durden Wed, 02/06/2019 - 17:25 Among the latest dismal news about the strength of the US economy, on Tuesday ACT Research released preliminary truck orders for January 2019 which showed that Class 8 truck orders collapsed an astounding 68% for January. The decline is being attributed to a 300,000+ vehicle backlog potentially prompting fleets to halt purchases in the near term. 米国経済に関し最近憂鬱なニュースが多い中で、火曜にACT researchが2019年1月のトラック発注を開示した、1月にClass 8のトラック発注がなんと68%も急落した。この発注減は短期的に300,000台超の潜在在庫を生み出す。 Specifically, in January Class 8 net orders were 15,800 units (14,700 SA; 176,400 SAAR), down 68% YoY and down 26% MoM. Class 5- 7 January net orders were 23,400...