Ever since the start of October when the Fed launched QE4 - or as
some still call it "Not QE" - in response to the Sept repo crisis,
figuring out the market has been pretty simple: if the Fed's balance
sheet goes up so does the S&P500, and vice versa.
The good news for traders is that for the past three months, the
Fed's balance sheet rose 11 of 12 weeks, and declined just 1 of 12, and
magically, the S&P did just that as well.
However, now that the year-end repo scare is history at least until
the April 15 tax date and certainly the next year end, it's time for the
Fed to start shrinking its balance sheet, mostly by allowing existing
term repo operations to expire without being rolled over. Conveniently,
the FOMC Minutes released moments ago provided the Fed's own big picture
take on when the massive liquidity injection since mid-September, which
expanded the Fed's balance sheet by $415BN in three and a half
months...
c
... with the Fed pointing out its "expectations to gradually
transition away from active repo operations [in 2020] as Treasury bill
purchases supply a larger base of reserves" and specifically, "the calendar of repo operations starting in mid-January could reflect a gradual reduction in active repo operations."
None of this is new, and it has almost become conventional wisdom
that when the Fed starts draining liquidity, the market impact will be
the polar opposite of what happened when it was injecting liquidity:
i.e., stocks will drop.
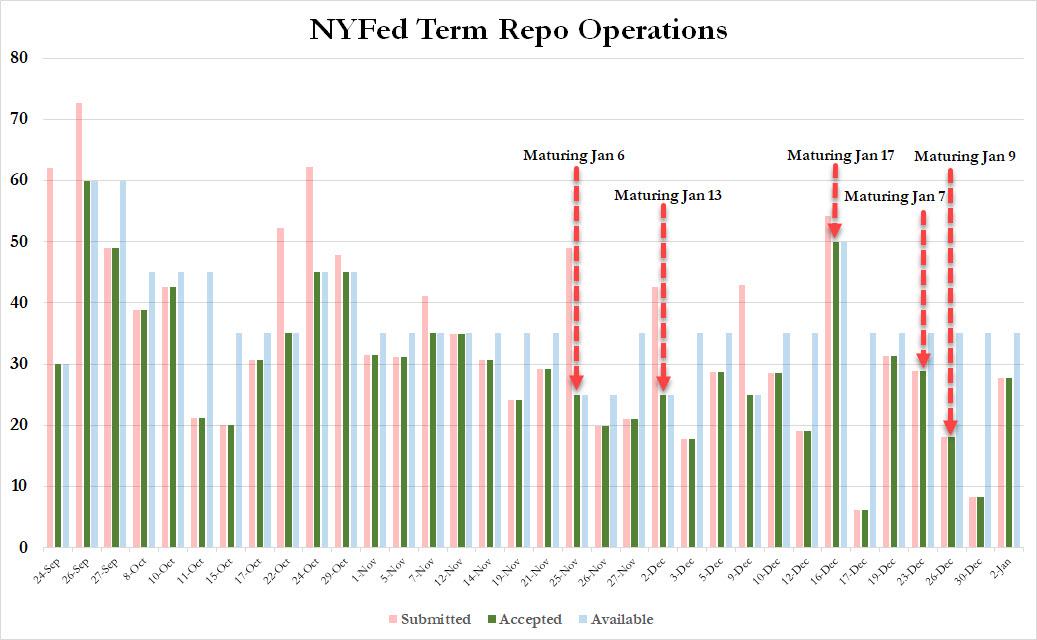
So with the Fed highlighting mid-January as the period when the
liquidity injection goes into reverse, here is some more details on just
which dates will be critical: as Curvature's Scott Skyrm points out,
these will be the days when the Fed's term repos maturing over the next
few weeks, supposedly without being rolled into further term repos, or
as he puts it, "during January, it will be interesting to see how the market reacts to the term RP ops maturing:" FEDは1月半ばに流動性注入が反転することを強調している、ここに示すのはそのなかでも重要な日付だ:Curvature社の Scott Skyrmが指摘するものだ、今後数週でFEDのterm reposが満期を迎えるだろう、term repoの繰延は無いと仮定している、彼の言によると「1月中に、term repo満期に市場がどう反応するか興味深いところだ:」
$25 billion leaves the market on Monday,
月曜には$25Bが市場から引き去られる、
$28.8 billion on Tuesday,
火曜には$28.8Bが引き去られる、
$18 billion next Friday, etc.
金曜には$18Bが引きさられる、というぐあいだ。
Of course, perhaps "interesting" is not the
right word, because it is clear that if liquidity is drained without a
matching injection, the market reaction will be anything but favorable.
That said, the Fed still has more term Repo ops scheduled to correspond
with those term roll-off dates, with at least three more term RP ops of
up to $35 billion scheduled in January. Whether or not banks decide to
use these to roll existing maturing term repos will determine if the
liquidity cliff starts hitting next week, or 3-4 weeks later. Finally,
it will also depend on whether the Fed decides that it had overinjected
the market with liquidity, and if it announces even more scheduled term
repos in February and onward.
当然のことだが、たぶん「興味深い」という言葉は適当ではない、というのも当分の注入なしに流動性が引き去られるのは明らかで、市場の反応は決して好感を持つものではないだろう。ということは、FEDは1月にまださらに term repoの満期を控えている。商業銀行が既存term repoの満期を繰延するかどうかで来週または3,4週後に流動性の崖が始まるかどうかが決まる。最終的には、FEDが市場に流動性を過剰注入するかどうかにかかっているだろう、そして2月以降のterm repoのさらなる対応スケジュール開示に依存する。
For now, however, here is a visual calendar of when some of the key December term repos mature over the next few days:
この記事よりももっと詳しい分析がこちらにあります。: https://www.adamtownsend.me/china-financial-stability-report/ 元データは毎年開示されるPBOCの英文報告に基づいたものです: http://www.pbc.gov.cn/english/130736/index.html ただ、毎年200ページ超もあり、そう簡単に読みこなせるものではありません。この記事の表のようなわかりやすい形で整理して開示はしていません。この記事の表にはどの年の何ページに書かれたデータであるかが示されています。日本語ネットの記事ではシャードーバンクの規模がよくわからないというものが多いですが、毎年PBOC自らがシャドーバンク規模を自ら認めています。その規模は驚くものです。 この記事に書かれている数値は驚くばかりです。ここまで信用創造をしているのかと驚きます。そりゃ昨年来RRRの低減とかの緩和策を連発してますが、効果が無いのももっともです。これまでの緩和の規模からすると昨年のこの手の緩和はその規模が全く足りないですね。一年以上前にZeroHedgeで中国企業の殆どがミンスキーポイントを超えている、企業の営業利益で債務金利が賄えず利払いのために新たな借金をしている、というのが詳しくデータで示されていましたが、なるほどなと思います。 The Black Swan So Ugly No One Will Talk About It by Phoenix Capita… Fri, 01/11/2019 - 11:55 The biggest black swan facing the financial system is China. 金融システムが直面する最大のブラックスワンは中国だ。 China has been the primary driver of growth for the global economy since the 2008 Crisis...
最後の2段落だけ訳をいれました。 Big Silver-Stock Potential Adam Hamilton February 7, 2020 2689 Words The silver miners’ stocks are looking interesting. While they really lagged silver’s surge on gold’s bull-market-breakout rally last summer, their upleg since remains intact. Gold stocks’ own upleg peaked in early September. And silver itself remains wildly undervalued relative to gold, overdue to mean revert dramatically higher. When that happens during gold’s next upleg, the silver stocks have big potential to soar. Like the global silver market is vastly smaller than gold’s, silver stocks are a proportionally-little fraction of the precious-metals miners. As a small subset of a usually-ignored contrarian sector, the silver stocks often languish in obscurity. For decades there wasn’t even a silver-stock index, making sector analysis difficult. ...
最後の2段落だけ訳をいれておきました。 Gold Buying Precarious Adam Hamilton January 10, 2020 3366 Words Gold dramatically surged to major new secular highs this past week, fueled by stunning geopolitical news. The US assassinated Iran’s top general, so Iran fired ballistic missiles at military bases in Iraq used by the US. That naturally ramped gold bullishness, spawning all kinds of predictions for much-higher prices. But geopolitically-driven gold spikes never last long, and the gold buying behind this surge is very precarious. Geopolitics are fascinating, the modern intersection of centuries of history, politics, religion, and military actions. Growing up, geopolitics were my second passion after the markets. I read everything I could on that broad topic, both nonfiction and fiction. Tom Clancy’s masterful novels were my favorites, and I love that wh...
最後の2段落だけ訳をいれておきます。 この記事は先週水曜締め切りで金曜に発行されたものです。 Gold Stocks’ Spring Rally 5 Adam Hamilton February 28, 2020 3225 Words Before their recent surge on gold regaining $1600, the gold stocks spent much of the past half-year or so largely drifting sideways to lower. That high consolidation really weighed on sentiment, with greed giving way to apathy. This sector normally tends to suffer a seasonal slump into mid-March, paving the way for gold stocks’ spring rally. That’s their second-strongest seasonal surge of the year running into early June. Seasonality is the tendency for prices to exhibit recurring patterns at certain times during the calendar year. While seasonality doesn’t drive price action, it quantifies annually-repeating behavior driven by sentiment, technicals, and fundamentals. We humans are creatures of habit and herd, which naturally c...
Gold Mid-Tiers’ Q4’19 Fundamentals Adam Hamilton March 20, 2020 3250 Words The mid-tier gold miners’ stocks have been annihilated with COVID-19 fears infecting traders’ sentiment. They crashed with gold getting hammered on extreme gold-futures selling! With blood in the streets, the buy-low opportunities are phenomenal. The fundamentally-superior mid-tier gold miners have epic upside potential during gold’s next upleg. This key sector just reported outstanding Q4’19 results on higher gold. The sheer carnage in gold-stock-land has been jaw-dropping! In late February, the gold-stock sector per its leading benchmark GDX VanEck Vectors Gold Miners ETF edged up to a 3.5-year high slightly above early September’s. That was fueled by gold’s $1600 breakout surge on COVID-19 fears. Yet as I warned in an essay the trading day before GDX’s pe...