Authored by Alasdair Macleod via GoldMoney.com,
We are all used to the bullion banks covering their shorts on Comex
by waiting until the speculators are over-bullish and vulnerable to
mark-downs that trigger their stops. Algorithmic traders go from long to
short in a heartbeat as well, and they dump contracts into a falling
market, speeding up the decline. We should say at this juncture that the
Managed Money speculators are short-term, attracted by futures
leverage, and their gold position is often part of a wider risk strategy
deployed by hedge funds. They do not intend to stand for delivery. The
wider investment world taking strategic portfolio decisions does not
often get involved with gold, so the Comex gold contract has been a
secular play.
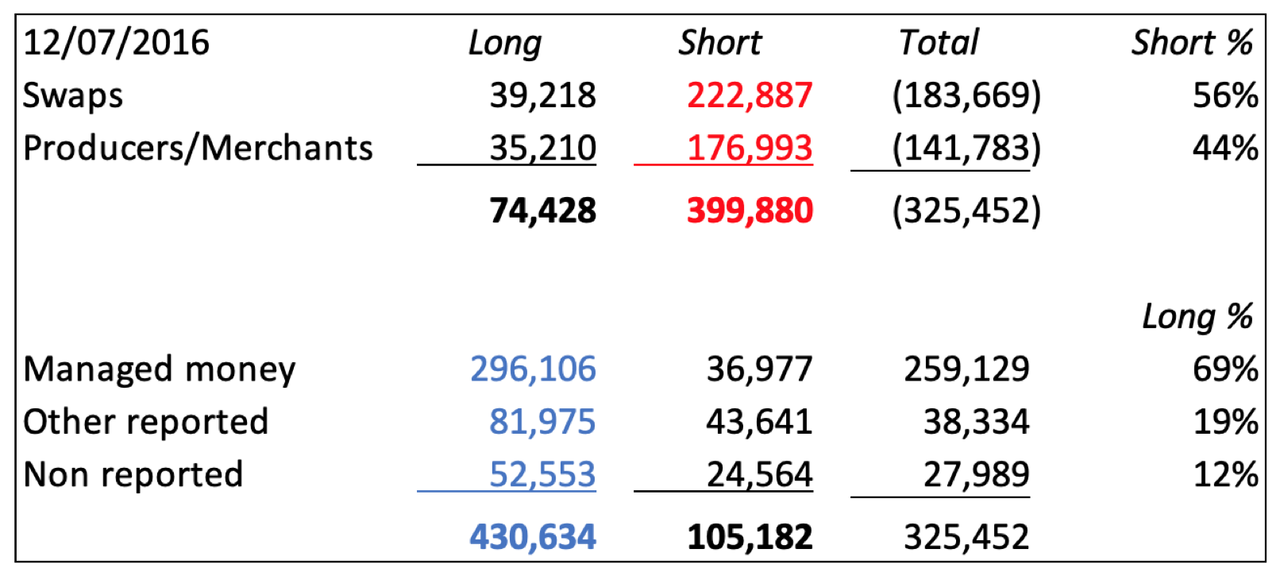
The table below shows a typical set-up, in this case July 2016. The
Managed Money category (296,106 — net 259,129 contracts) is close to
record long. Open interest was 633,000 contracts and the gold price was
at $1360, having run up from $1040 the previous December.
In the non-speculative category, the bullion banks (Swaps) had 56% of
the shorts and the Producer/Merchants 44%. Mark-to-market value of the
Swaps net short position was $25bn. Of the speculative longs, the
managed money category (hedge funds) held 69%, and at 296,106 long
contracts it was almost a record. There was a high level of bullishness;
easy pickings for the bullion banks, who by the following December
drove the price down to $1120, reducing their net shorts to under 50,000
contracts.
It was a game that evolved out of Comex futures being used simply to
offset long bullion positions at the LBMA. Over time, bullion bank
traders increased their trading position limits, as opposed to their
pure hedging activity, making easy money jobbing the other side of
Managed Money trades.
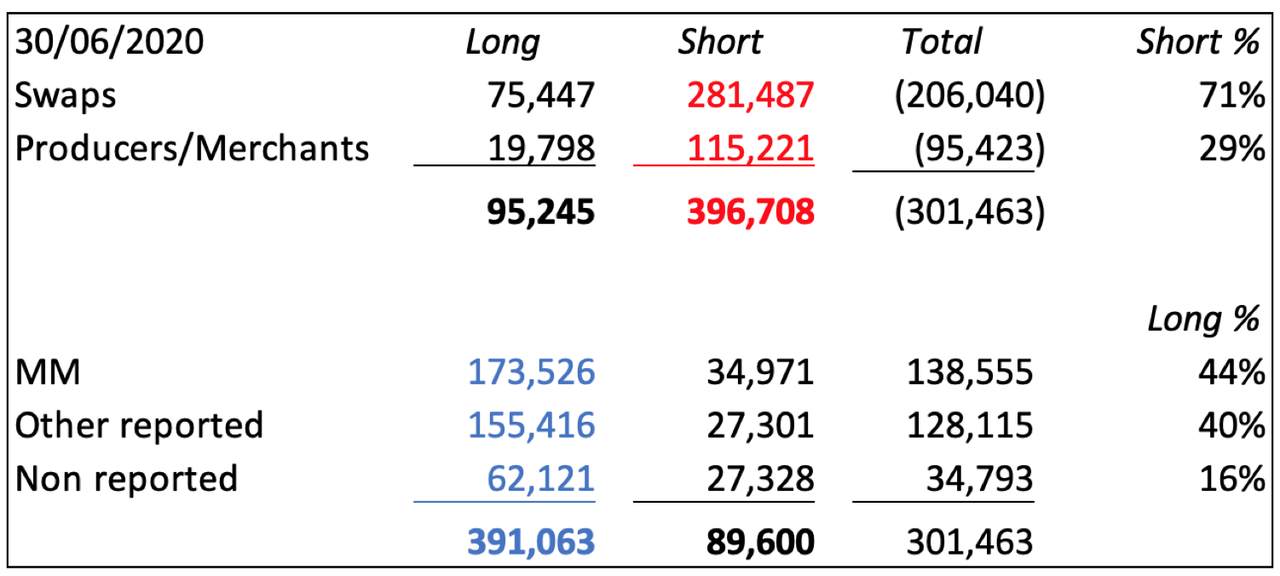
Now look at the current situation, with the gold price at decade highs ($1775) and open interest at 561,628 (30 June).
では、現在の状況を見てみよう、ゴールド価格は十年ぶりの高値($1775)になり、open interestは6月30日時点で561,628枚だ。
In the non-speculator category, the Swaps are more short than they
were in July 2016 despite open interest being 71,372 contracts lower.
The mark-to-market value is record net short at $36.6 billion. What has
happened is the Producer/Merchants have cut their positions, presumably
deciding that hedging mine output is less important in the current
inflationary environment. Consequently, the bullion banks are bearing
71% of the short exposure.
The speculator category makes this more interesting still. At 138,555
net long, hedge funds are only 25,000 contracts longer than average,
and compared with their bullishness in July 2016 have hardly got going.
It is the other categories, Other Reported and Non-reported have taken
56% of the long side, and they are not behaving like skittish hedge
funds at all. These include family offices, the ultra-wealthy and
foreigners through Globex who are standing for delivery as a means of
getting their hands on physical bullion —171 tonnes from the June
contract alone.
Bullion banks are between a rock and a hard place. For years they’ve
been playing the hedge funds as an angler hooks and plays a fish. That
game has ceased and there is no easy way for them to get level. For the
moment they are trying to put a lid on the price, but the cost has been
rising open interest, and therefore rising mark-to-market positions.
The August active contract runs off the board at the end of this
month and bullion banks are likely to be forced into large delivery
volumes again. Furthermore, the exchange for delivery arbitrage facility
between Comex and the LBMA is broken, allowing Comex premiums to London
spot to go unchallenged.
It is increasingly possible the gold contract is evolving into deep crisis, and that force majeure might have to be declared if, as seems increasingly inevitable, a wider banking crisis ensues.
How Are Gold And Money Supply Related? by Tyler Durden Sun, 06/14/2020 - 13:00 Authored by Mike Shedlock via MishTalk, M2 Money Supply is surging. Will gold follow? M2マネーサプライが急増している。ゴールドはこれを追従するだろうか? Let's investigate an alleged relationship between gold and M2, a measure of money supply in the US. よく言われるM2(米国のマネーサプライ指標)とゴールドの関係について調べてみよう。 "There’s a clear correlation between the annual growth rate in M2 money supply and the price of the yellow metal. " 「M2の年率増加速度とゴールド価格の間には明らかな相関がある。」 Clear Correlation? 明らかな相関? The Tweet claims something different than my lead chart depicts. So let's investigate the above idea in other time frames. このツイートの主張は私が示す最初のチャートが示すものとは異なる。というわけでこのtweetの主張を別の時間フレームで見てみよう。 Gold vs Rate of Change in M2 Money Supply ゴールド vs M2マネーサプライの変化率 If we look at longer time frames, the rate of increase in M2 theory falls flat on its face....