“A WSJ article suggesting
that the Fed would not only stop hiking interest rates but also cease
the balance sheet reduction which has been extracting liquidity from the
market.
In
mid-2018, the Federal Reserve was adamant that a strong economy and
rising inflationary pressures required tighter monetary conditions. At
that time they were discussing additional rate hikes and a continued
reduction of their $4 Trillion balance sheet.
All it
took was a rough December, pressure from Wall Street’s member banks, and
a disgruntled White House to completely flip their thinking.”
12月に相場が荒れ、Wall Streetの持ち株銀行から圧力を受け、そしてホワイトハウスを不機嫌にさせて、考え方を完全に反転させた。」This is a change for Jerome Powell, who was believed to be
substantially against Fed interventions, shows his worst fear being
realized – being held “hostage” by the markets. A look at Fed meeting minutes from 2013 was his recognition of that fear. FEDの市場介入に基本的に反対の立場だったJerome Powell が考えを改めてしまい、彼が一番恐れていたことが現実となったーー市場の「虜」になってしまうという。2013年のFOMC議事録を見ると彼はこの恐れを認識していた。
“I have one final point, which is to ask, what is the plan if the economy does not cooperate? We
are at $4 trillion in expectation now. That is where the balance sheet
stops in expectation now. If we have two bad employment reports, the
markets are going to move that number way out. We’re headed for $5
trillion, as others have mentioned. And the idea that
President Kocherlakota said and Governor Duke echoed— that we ’re now a
captive of the market — is somewhat chilling to me.”
This week, the Fed meets to discuss their next policy moves. If
the Fed announces a reduction/elimination of future rate hikes and/or a
reduction/elimination of the balance sheet reduction, stocks will
likely find a bid. 今週、FEDは今後の政策変更について議論する。もしFEDが今後の金利引き上げを取りやめ and/or バランスシート縮小を弱めるなら、株式は多分上昇するだろう。
At least in the short-term.
少なくとも短期的には。
Longer-term the markets are still dealing with an aging economic
growth cycle, weakening rates of earnings growth, and rising political
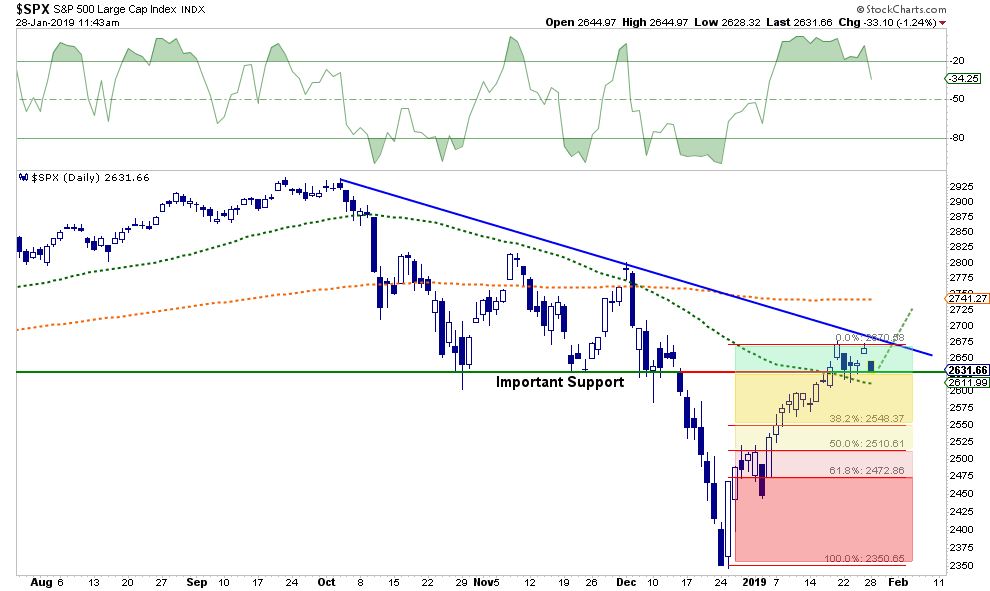
tensions. But from a technical basis, they are also dealing with a break
of long-term trend lines and very major “sell” signals.
The problem for the Fed is that while ceasing rate hikes and balance
sheet reductions may be a short-term positive, monetary policy is
already substantially tighter than it was at the lows. In other words, “stopping” tightening is not the same as “easing.”
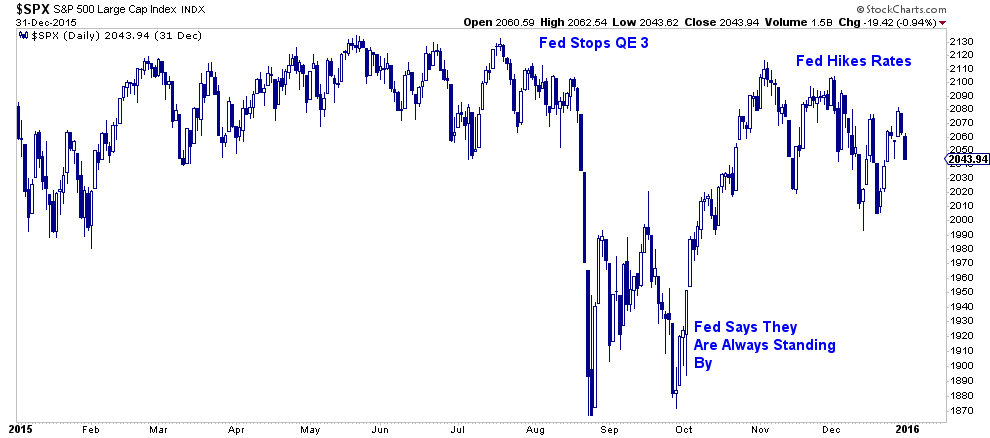
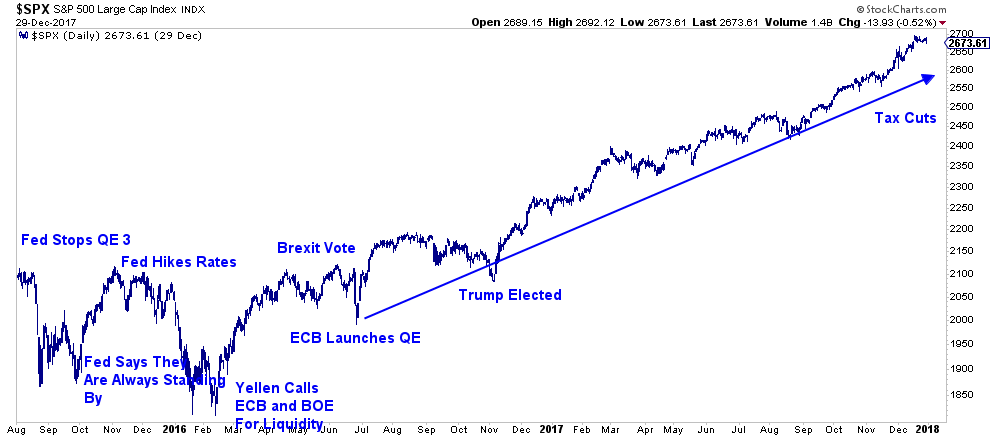
We have seen a similar period previously. During the 2015-2016
correction, the Fed had just announced it’s intent to start hiking rates
and had stopped reinvesting liquidity into the markets. (Early tightening.) 我々は同様の状況をかつて目にしている。2015−2016の調整期間、FEDはまさにそのとき金利引き上げ開始意図をアナウンスした、そして市場への流動性再投入を止めた(初期引き締め)。
The market plunged sharply prompting several Fed Presidents to make
announcements reminding markets they still remained extremely “accommodative.” 市場は急落し、FED議長が相場を維持するように求めた、彼らがまだ極端な「緩和」姿勢のままでいるとアナウンスするように。
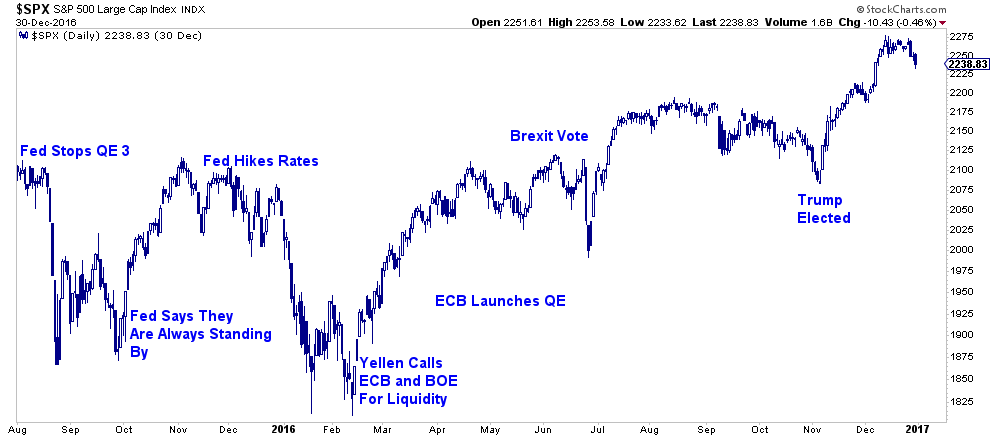
The market rallied back closing in on previous highs. It certainly
looked as if the bulls had regained control of the market. Headlines
declared the “correction” was over. But, it wasn’t.
The retest of lows, and setting of new lows, happened over the next 60-days. With concerns over the impact of the upcoming “Brexit”
vote, the Fed Chairman Janet Yellen coordinated with global Central
Banks to provide liquidity to support global markets in the event of a
disorderly “break up.”
In November of that same year, Donald Trump was elected to office
with promises of deregulation, tax cuts, and massive infrastructure
spending projects which provided an additional boost to equities into
the end of the year.
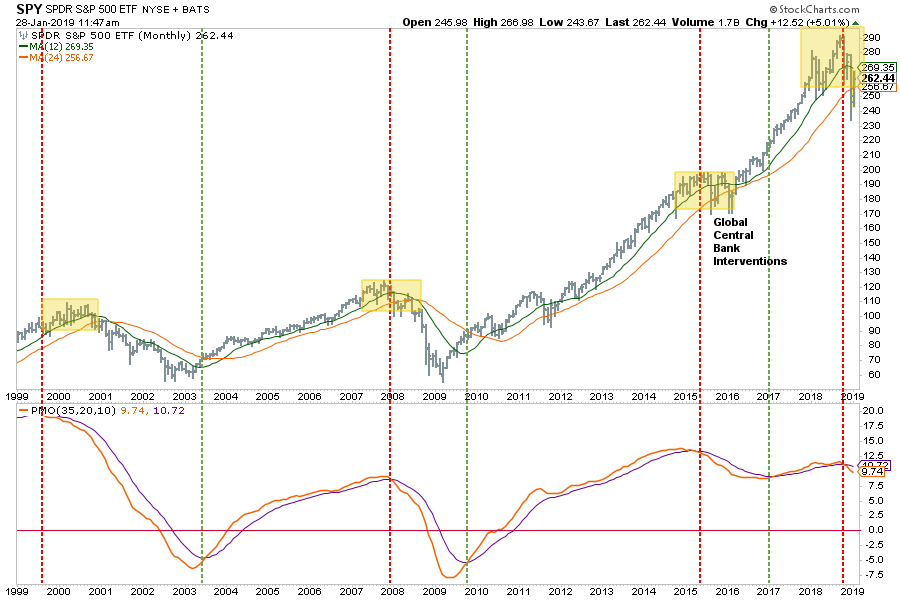
Those promises combined with massive Central Bank stimulus led to one
of the longest bull market runs in history with virtually no
volatility.
これらの選挙公約と巨額の中央銀行刺激策が相まってほとんど変動のない史上最長級のブル相場を形成した。
So, here we are today.
そう、いま現在我々はここにいる。
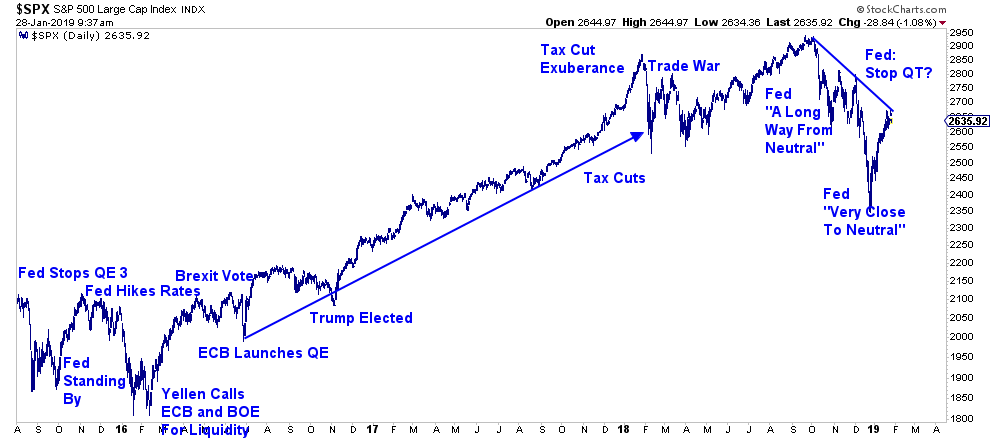
The Trump Administration successfully passed tax cut legislation for
corporations in December of 2017. Subsequently, stocks surged at the
beginning of 2018 as bottom line earnings were expected to explode.
However, that surge also marked the “blow off” top of the rally.
しかしながら、この急騰もラリーの「吹上」頂点を迎えた。
As the Administration launched its “Trade War” with China.
Stocks fell in February. However, the markets were able to regain their
footing in April as the first look at earnings, post tax-cuts, had
soared.
Then came October. The ongoing tariffs on goods being shipped, along
with a stronger dollar, began to weigh on corporate outlooks. But it was
the Fed, who was in the process of tightening monetary policy, uttered
the words that spooked the markets.
“We are still a long-way from the ‘neutral rate.'” – Jerome Powell
「「中立金利」までにはまだ長い道のりがある。」ーーJerome Powell
Despite evidence of an already slowing economy, and the yield curve
almost inverted, the idea the Fed would remain consistent in hiking
interest rates and reducing their balance sheet further weighed on
investor confidence.
The “Fed Put” was gone.
Despite commentary from the Fed they were only “data dependent,” all it took was a 20% correction from the highs to change their minds. But not just the Fed’s.
While the WSJ is reporting a change in attitude from the Fed on the
reduction of their balance sheet, the White House, which has pinned
their measurement of success to stock prices, took prompt action.
The Secretary of the Treasury made announcements assuring the markets
of stability and pushing for banks to put liquidity back into the
markets. The Trump Administration has repeatedly assured the markets
that “trade talks” are going well and “deal” is close to being done.
For now, the markets have bought into the “rhetoric” and have rallied sharply from the lows.
今の所、市場はその「言葉を信じて」買い込み安値から急速に反発した。
“Mr. Market” clearly has control over both fiscal and monetary policy. “Data dependency” has been relegated to the “dust bin of history.” 「Mr. Market」は明らかに財政・金融政策をコントロールしている。「Data dependency」など「dust bin of history 無用の長物」と投げ捨てられている。
So, is the bull back?
では、ブルが戻ってきたのか?
Or, is the market, despite all of the support, set to retest lows as seen in early 2016? もしくは全力のサポートにもかかわらず、2016年と同様に市場は安値をテストしているのだろうか? Bryce Coward, CFA recently studied all the previous similar declines:
Bryce Coward, CFAは最近、同様の以前の下落を研究した:
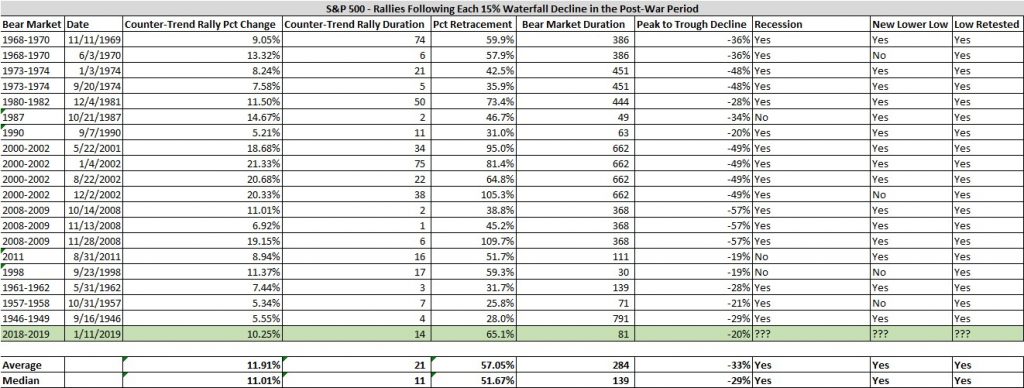
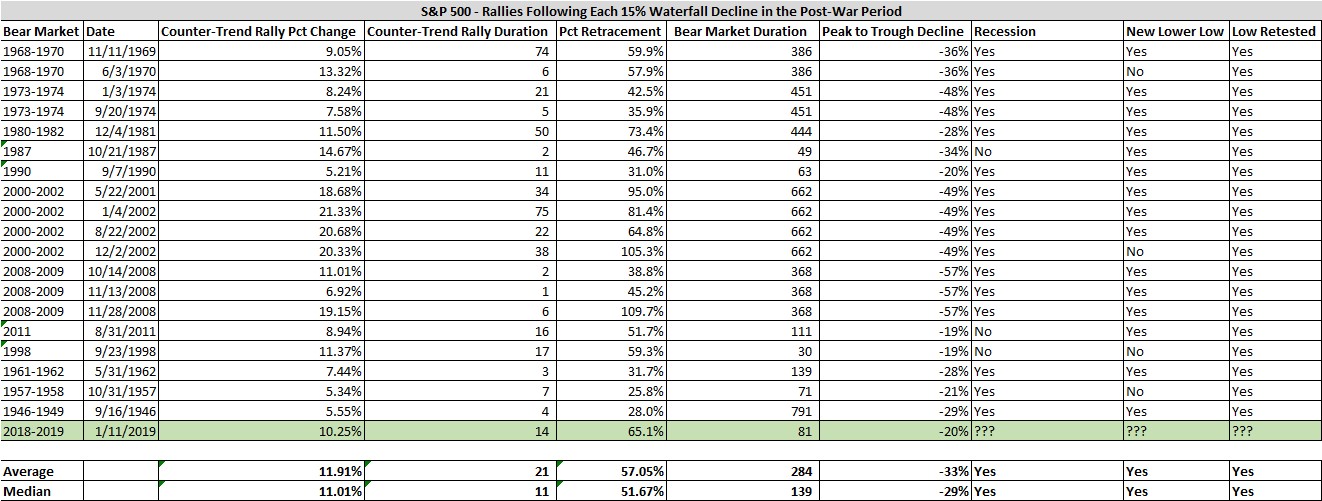
“We’ve cataloged all 20
uninterrupted 15% declines in the post-war period and documented what
has happened afterward, as well as the type of market environment in
which those declines have taken place. By uninterrupted decline, we mean
a waterfall decline of at least 15% without an intermediate
counter-trend rally of at least 5%. Some bullet points describing the
rallies following those declines are below:
The average counter-trend rally following a 15% waterfall
decline is 11.9% (11% median) and it takes place over 21 trading days on
average (median 11 days).
15%のwaterfall 下落後の反転上昇平均は11.9%、そして平均で21営業日を要している。
The rallies end up retracing 57% of the decline on average (median 52%).
平均して57%のあや戻しでラリーは終わっている。
The average of those bear markets have a peak-to-trough decline of 33% (median 29%)
これらのベア相場での天井から底値までの平均は33%。
The duration of those bear markets is 284 trading days on average (median 139 days)
ベア相場の期間は平均284営業日。
In 16 of 19 instances (excluding the decline we just witnessed), a recession was associated with the bear markets.
19例のうち16例で、景気後退に伴いベア相場となった。
Waterfall declines of at least 15% have only taken place in bear markets.
少なくとも15%の Waterfall 下落はベア相場でのみ起きている。
100% of the time the low resulting from the waterfall decline was retested, and in 15 of 19 cases a new lower lower was made.”
What do these data say about the current counter-trend rally?
これらのデータを分析して現在の反転ラリーで何が言えるだろうか?
First,
this rally has already retraced 65% of the waterfall decline (greater
than average and median) and has lasted about three weeks (less than
average but greater than median). This suggests upside from here may be limited in both magnitude and duration.
Furthermore, these data strongly suggest the major index will retest the Christmas Eve low at the very least and most likely will make a new lower low in the weeks and months ahead.
While
we are not forecasting a recession at this time, waterfall declines of
the magnitude just witnessed tend to take place in recessionary market
environments, so we need to at least be open to that possibility.
Finally, waterfall declines typically take place in bear markets lasting an average of 284 days (median 139 days). At just 81 days in duration, these data suggests we have bit further to run before we reach the bear market nadir.
That said, there are four instances of waterfall declines taking place
in short bear markets, so we don’t place much weight on this particular
piece.
While the markets could certainly rally in the weeks ahead, there are
significant challenges coming from both weaker economic growth, rising
debt levels, and slowing earnings growth.
“Finally, even stock prices
themselves can be considered excessive. In fact, when compared to a
regression trend line on the S&P Composite going back to inception
in 1871, the index price reached 122% above its long-term trend this
past September. Another way of saying that is that the S&P 500 is
122% overbought. In other words, if stock prices were simply to revert
to their long-term mean, the S&P 500 would be down closer to 1300
than recent highs near 2900.”
“There are certainly
plenty more examples of excess in the stock market. But these few should
give you an idea why, if we have entered a longer-term bear market, the
oft-derided bears may end up getting the last laugh.”
How Are Gold And Money Supply Related? by Tyler Durden Sun, 06/14/2020 - 13:00 Authored by Mike Shedlock via MishTalk, M2 Money Supply is surging. Will gold follow? M2マネーサプライが急増している。ゴールドはこれを追従するだろうか? Let's investigate an alleged relationship between gold and M2, a measure of money supply in the US. よく言われるM2(米国のマネーサプライ指標)とゴールドの関係について調べてみよう。 "There’s a clear correlation between the annual growth rate in M2 money supply and the price of the yellow metal. " 「M2の年率増加速度とゴールド価格の間には明らかな相関がある。」 Clear Correlation? 明らかな相関? The Tweet claims something different than my lead chart depicts. So let's investigate the above idea in other time frames. このツイートの主張は私が示す最初のチャートが示すものとは異なる。というわけでこのtweetの主張を別の時間フレームで見てみよう。 Gold vs Rate of Change in M2 Money Supply ゴールド vs M2マネーサプライの変化率 If we look at longer time frames, the rate of increase in M2 theory falls flat on its face....
Is The Stock Market As Confused As You Are About A Recession? Written by Lance Roberts | Apr, 1, 2019 Last week, Barron’s ran an article entitled “The Stock Market Is Just As Confused About A Potential Recession As You Are?” To wit: 先週バロンズにこういう記事が掲載された「株式市場は景気後退を予感させるほどに混乱しているだろうか?」見てみよう: “Investors have long used where we are in the economic cycle to decide which stocks to buy and sell. New research from Nomura’s Joseph Mezrich flips that on its head by showing how investors can use stock performance to help determine where we are in the cycle. Too bad the market is sending mixed messages right now.” 長らく投資家は現在景気サイクルのどこに居るかを見てこの株式を売るか買うかを判断してきた。野村證券のJoseph Mezrichの最近の研究では、これが逆さで、投資家は株式のパフォーマンスを見て今景気サイクルのどこにいるかを判断している。最悪なことに現在相場は悪化改善混在のメッセージを送っている。」 But let’s be clear here; no one wants the party to end. So, despite a struggling stock market over the last year, slowing economic growth, and a collapsing yield curve, there are s...